Functional Cosmetics Market by Functionality (Conditioning Agents, UV Filters, Anti-Ageing Agents Skin-Lightening Agents), Application (Skin Care, Hair Care), and Region(Europe, Asia Pacific, North America) - Global Forecast to 2028
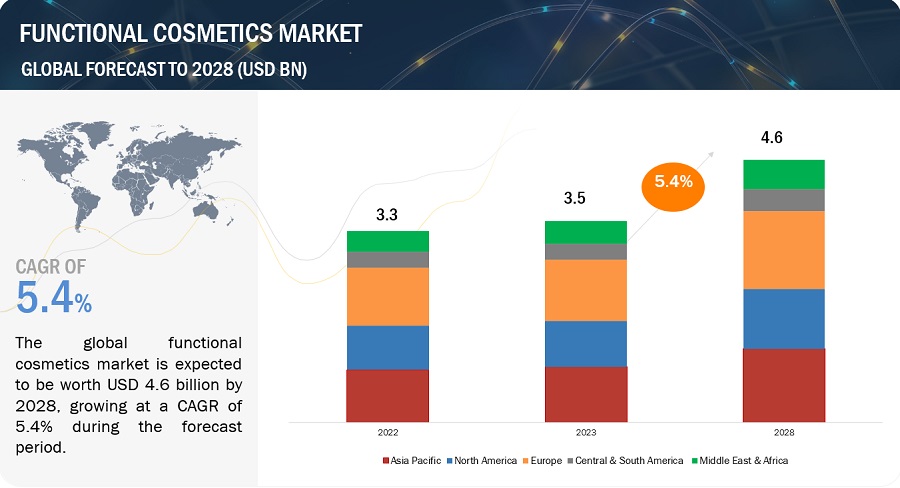
In terms of value, the functional cosmetics market is estimated to grow from USD 3.3 billion in 2022 to USD 4.6 billion by 2028, at a CAGR of 5.4%. The market is triggered by population growth across the globe and rising demand for cosmetics. The increasing concerns about aging skin and the need for an even skin tone are contributing to the high use of functional cosmetics. Temperature variations and rising heat levels are influencing the demand growth of sun care functional cosmetic products. BASF SE (Germany), Nouryon (Netherlands), Ashland Inc. (US), Clariant AG (Germany), Evonik Industries AG (Germany), are the major service providers of functional cosmetics. These players mainly focus on expansion and new product launches to increase their geographic reach , garner new projects, strengthen their product and service portfolio and cater to the untapped markets.
To know about the assumptions considered for the study, Request for Free Sample Report
Market Dynamics
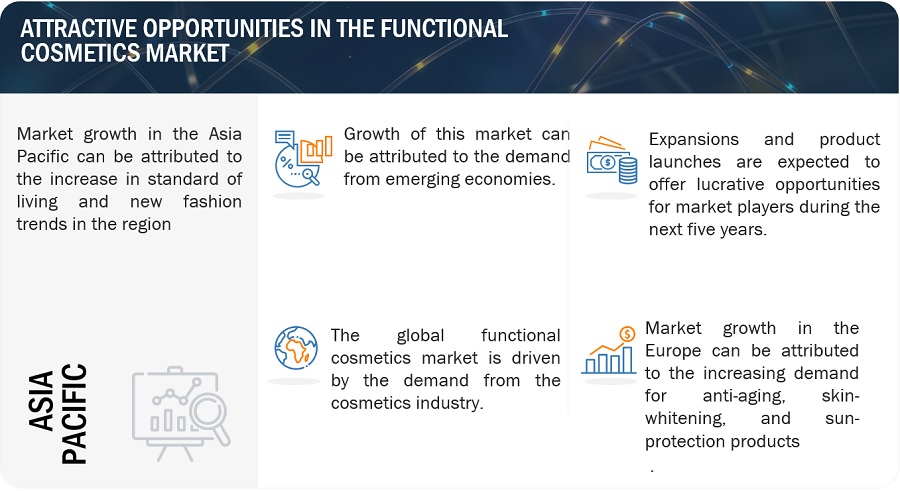
Driver: Accelerating demand for anti-aging, skin-whitening, and sun protection products
On average, 65% of the population falls under the age group of 16-64 years worldwide, according to the Population Reference Bureau (PRB) statistics 2022. There is a trend of using anti-aging products due to environmental effects and the desire to get youthful skin. Thus, increasing awareness of cosmetics and the desire to look younger are boosting the demand for anti-aging products across the globe. The desire for even toned and light-colored skin is the major factor driving the demand for skin whitening/lightening products. Organic products are gaining importance in North America, Europe, and majorly in Asia Pacific, with India, China, and Japan leading the market. The rising standard of living of the middle-class population, strong economic growth, and increased per capita spending on organic beauty products are the key parameters, increasing the global demand for these products.
Restraints: Consumer skepticism
Consumer skepticism is a psychological phenomenon in which customers question the reliability, authenticity, or dependability of marketing promises, products, or services. In a functional cosmetics market, diverse items and services are tailored to meet certain consumer requirements and desires. Competition, innovation, and a steady flow of information characterize these markets. However, the quantity of options and information can also lead to customer misunderstanding and skepticism. This skepticism can be attributed to a variety of variables, including previous experiences, information overload, and the influence of social networks.
Opportunities: Personalization and Customization
Some functional cosmetic brands allow customers to select the specific ingredients that they want to include in their products. Some functional cosmetic brands offer products that are custom blended for the individual customer. This is done by combining different ingredients in specific ratios to create a product that is tailored to the customer's specific needs.
Challenges: High product cost
Functional cosmetics often require more marketing than traditional cosmetics. This is because companies need to educate consumers about the benefits of functional cosmetics and to convince them to pay a premium for these products. The cost of marketing can also be a significant factor in the overall cost of a functional cosmetic product. All these factors conclude that the increasing demand for natural and organic products drives the functional cosmetics market. All these factors conclude that the high product cost is challenges to the functional cosmetics market.
Functional Cosmetics Market Ecosystem
The functional cosmetics ecosystem includes companies manufacturing functional cosmetics, such as BASF SE, Nouryon, Evonik Industries AG, Clariant AG, Ashland Inc., Stepan Company, Gattefosse, Lucas Meyer Cosmetics, Croda International Plc, and Air Liquide S.A.
Based on functionality , conditioning agents was the largest segment for functional cosmetics market, in terms of value, in 2022.
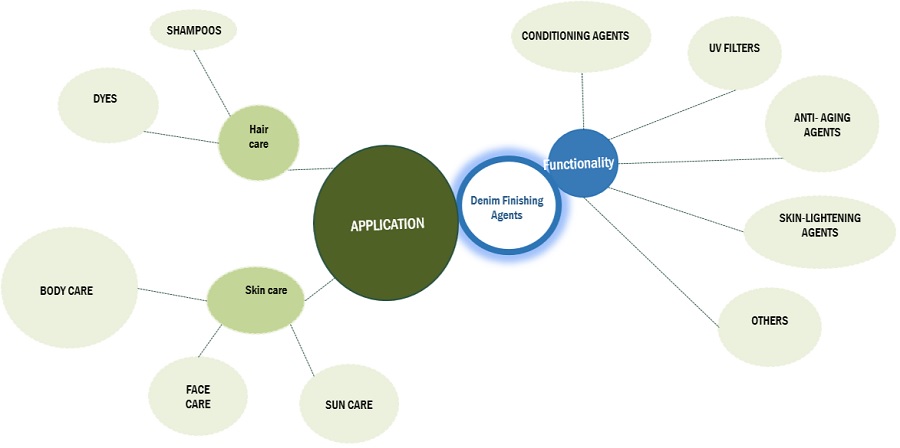
The functional cosmetics market is classified into conditioning agents, UV filters, anti-aging agents, skin-lightening agents, and others based on functionality. The others category includes cleansing agents, soothing agents, self-tanning agents, anti-acne, anti-oxidants, and emollients. The conditioning agent segment accounted for the maximum share of the market in 2022. The low cost and benefits of conditioning agents make them more suitable for skin care and hair care products. The high per capita spending and increased consumer inclination to use cosmetic products in their day-to-day life is driving the demand for cosmetics products. Asia Pacific is projected to witness the highest CAGR between 2023 and 2028, mainly due to the rising population in the region.
Based on application, skin care was the largest segment for functional cosmetics market, in terms of value, in 2022.
Functional cosmetics are used in skin care and hair care products to deliver the proposed benefits. The skin care application accounted for the larger market share in terms of value, of the global functional cosmetics market in 2022. It is estimated to have high demand due to growing aspirations to have younger skin and even skin tone, and aging population growth. The increasing impact of global warming, with a rise in excess heat levels, is surging the demand for sun protection and moisturizing agents.
“Europe accounted for the largest market share for functional cosmetics market, in terms of value, in 2022”
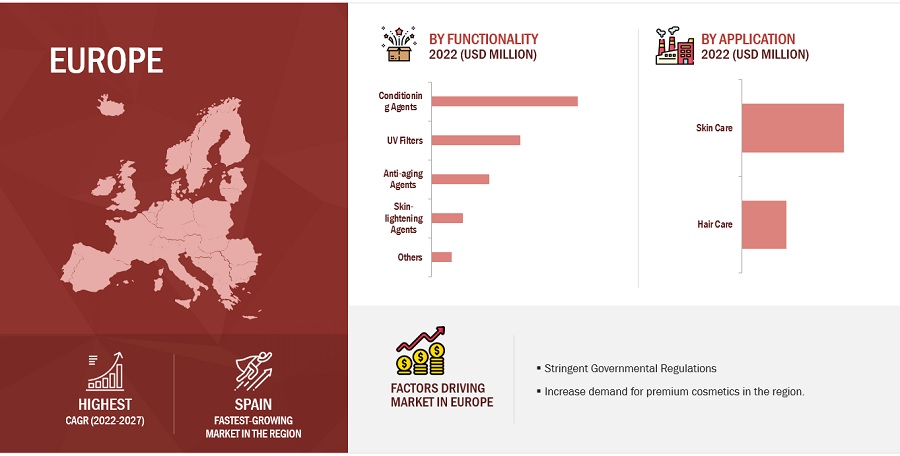
The European personal care industry has already started focusing on VOC-free, alkyl phenyl ethoxylates (APE)-free, and easily biodegradable eco-friendly surfactant products using renewable raw materials. The trend toward natural products is estimated to continue during the forecast period to keep up with the environmental regulations for manufacturers. The presence of major premium personal care products & cosmetics manufacturers in the region, such as L'Oréal (France), Beiersdorf (Germany), and Clarins (France), is another factor driving the demand for functional cosmetics. The demand for premium skin care products, cosmetics, and perfumes is rising in European countries. This has led to increased production, thereby driving the functional cosmetics market.
To know about the assumptions considered for the study, download the pdf brochure
Key Market Players
The key players profiled in the report include BASF SE (Germany), Nouryon (Netherlands), Ashland Inc. (US), Clariant AG (Germany), Evonik Industries AG (Germany), Gattefosse (France), Stepan Company (US), Lucas Meyer Cosmetics (Canada), Croda International Plc (UK), and Air Liquide S.A. (France), among others, these are the key manufacturers that secured major market share in the last few years.
Please visit 360Quadrants to see the vendor listing of Top 20 Personal Care Ingredients Companies, Worldwide 2023
Scope of the Report
|
Report Metric |
Details |
|
Years considered for the study |
2017–2028 |
|
Base year considered
|
2022 |
|
Forecast period |
2023–2028 |
|
Units considered |
Value (USD Million/Billion) |
|
Segments covered |
Functionality, Application, and Region |
|
Regions covered |
Asia Pacific, North America, Europe, Middle East & Africa, and Central & South America |
|
Companies profiled |
The key players profiled in the report include BASF SE (Germany), Nouryon (Netherlands), Ashland Inc. (US), Clariant AG (Germany), Evonik Industries AG (Germany), Gattefosse (France), Stepan Company (US), Lucas Meyer Cosmetics (Canada), Croda International Plc (UK), and Air Liquide S.A. (France) among others. |
This report categorizes the global functional cosmetics market based on functionality, application and region.
On the basis of functionality, the Functional cosmetics market has been segmented as follows:
- Conditioning Agents
- UV Filters
- Anti-Ageing Agents
- Skin-Lightening Agents
- Others
On the basis of Application , the Functional cosmetics market has been segmented as follows:
- Skin Care
- Hair Care
On the basis of region, the Functional cosmetics market has been segmented as follows:
- Asia Pacific
- North America
- Europe
- Middle East & Arica
- Central & South America
Recent Developments
- In April 2022, Nouryon introduced a natural polymer for sunscreen formulation. SolAmaze Natural is compatible with organic and synthetic sunscreen formulations. The product is bio-based and biodegradable.
- In October 2021, Evonik acquired Botanica to expand its active cosmetic ingredients market. It will enhance its entire product portfolio by opening new markets, accelerating growth, and creating significant value.
- In August 2021, Clariant AG acquired the remaining 70% of Brazilian personal care specialty company Beraca and took over full control. This acquisition will strengthen its functional cosmetics business, assuming full operational ownership of Beraca's broad portfolio of natural ingredients.
- In June 2021, Evonik Industries AG boosted its nutrition & care segment’s portfolio with the acquisition of the cosmetic delivery company Infinitec Activos. It will help company to provide best customer services.
- In August 2020, BASF SE has announced the launch of a new functional cosmetic product Lamesoft. It is a naturally derived and biodegradable product. It can be used to stabilize products in skin and hair cleansing formulas. It can be used to stabilize surfactant-based and wax-based opacifiers.
Frequently Asked Questions (FAQ):
Which are the major players in Functional cosmetics market?
The key players profiled in the report include BASF SE (Germany), Nouryon (Netherlands), Ashland Inc. (US), Clariant AG (Germany), Evonik Industries AG (Germany), Gattefosse (France), Stepan Company (US), Lucas Meyer Cosmetics (Canada), Croda International Plc (UK), and Air Liquide S.A. (France).
Who are the top 5 players in the market?
BASF SE (Germany), Nouryon (Netherlands), Ashland Inc. (US), Clariant AG (Germany), Evonik Industries AG (Germany)are the major service providers of functional cosmetics market.
What are the drives and opportunities for the functional cosmetics market?
The market is triggered by population growth across the globe and rising demand for cosmetics. The increasing concerns about aging skin and the need for an even skin tone are contributing to the high use of functional cosmetics. Temperature variations and rising heat levels are influencing the demand growth of sun care functional cosmetic products.
What are the various strategies key players are focusing within Functional cosmetics market?
New acquisitions, expansion and partnership are some of the strategies atoped by key players to expand their global presence.
What are the major factors restraining Functional cosmetics market growth during the forecast period?
The major factor restraining the growth of the functional cosmetics market is the high cost associated with shifting to products from natural or organic origin. The higher feedstock cost is pulling back the ingredient manufacturers to choose organic-based products in the cosmetic formulation. Consumers' preference for natural/organic cosmetic products to synthetic cosmetics is further restraining the functional cosmetics market. .
To speak to our analyst for a discussion on the above findings, click Speak to Analyst


- 5.1 INTRODUCTION
-
5.2 MARKET DYNAMICSDRIVERS- Increasing demand for multifunctional ingredients- Accelerating demand for anti-aging, skin-whitening, and sun protection products- Increasing demand for natural and organic products- Rising awareness about skin healthRESTRAINTS- Risks related to use of chemicals- Consumer skepticismOPPORTUNITIES- Shifting focus toward male-specific cosmetics- Personalization and customizationCHALLENGES- High product cost
-
5.3 PORTER’S FIVE FORCES ANALYSISTHREAT OF NEW ENTRANTSTHREAT OF SUBSTITUTESBARGAINING POWER OF SUPPLIERSBARGAINING POWER OF BUYERSINTENSITY OF COMPETITIVE RIVALRY
-
5.4 MACROECONOMIC INDICATORSGDP TRENDS AND FORECASTS OF MAJOR ECONOMIES
-
6.1 SUPPLY CHAIN ANALYSISRAW MATERIALSMANUFACTURING OF FUNCTIONAL COSMETICSDISTRIBUTION NETWORKEND USE INDUSTRIES
-
6.2 KEY STAKEHOLDERS AND BUYING CRITERIAKEY STAKEHOLDERS IN BUYING PROCESSBUYING CRITERIA
-
6.3 TRENDS/DISRUPTIONS IMPACTING CUSTOMER BUSINESSREVENUE SHIFTS AND NEW REVENUE POCKETS FOR FUNCTIONAL COSMETICS MARKET
-
6.4 CONNECTED MARKETS: ECOSYSTEM ANALYSIS
-
6.5 TECHNOLOGY ANALYSISCOSMETIC NANOTECHNOLOGYMODIFACE SKIN TECHNOLOGY
-
6.6 CASE STUDY ANALYSISCASE STUDY ON COATS GROUP PLC
-
6.7 TRADE DATA STATISTICSIMPORT SCENARIO OF FUNCTIONAL COSMETICSEXPORT SCENARIO OF FUNCTIONAL COSMETICS
-
6.8 TARIFF AND REGULATORY LANDSCAPEREGULATORY BODIES, GOVERNMENT AGENCIES, AND OTHER ORGANIZATIONSREGULATIONS FOR FUNCTIONAL COSMETICS MARKET
- 6.9 KEY CONFERENCES AND EVENTS IN 2023–2024
-
6.10 PATENT ANALYSISAPPROACHDOCUMENT TYPEJURISDICTION ANALYSISTOP APPLICANTS
- 7.1 INTRODUCTION
-
7.2 CONDITIONING AGENTSNEED TO IMPROVE APPEARANCE OF DAMAGED HAIR
-
7.3 UV FILTERSINCREASING DEMAND FOR SUN PROTECTION COSMETICS TO DRIVE DEMAND
-
7.4 ANTI-AGING AGENTSINCREASED POLLUTION LEVELS, GLOBAL WARMING, AND OTHER ENVIRONMENTAL FACTORS TO DRIVE MARKET
-
7.5 SKIN-LIGHTENING AGENTSINCREASING DEMAND FOR FAIRNESS TO AUGMENT MARKET GROWTH
- 7.6 OTHERS
- 8.1 INTRODUCTION
-
8.2 SKIN CAREINCREASING AWARENESS ABOUT SKIN HEALTH TO DRIVE MARKETBODY CAREFACE CARESUN CARE
-
8.3 HAIR CAREINCREASING HAIR-RELATED PROBLEMS TO DRIVE MARKET GROWTHSHAMPOOSDYES
- 9.1 INTRODUCTION
-
9.2 NORTH AMERICAIMPACT OF RECESSION ON NORTH AMERICANORTH AMERICA FUNCTIONAL COSMETICS MARKET, BY FUNCTIONALITYNORTH AMERICA FUNCTIONAL COSMETICS MARKET, BY APPLICATIONNORTH AMERICA FUNCTIONAL COSMETICS MARKET, BY COUNTRY- US- Canada- Mexico
-
9.3 ASIA PACIFICIMPACT OF RECESSION ON ASIA PACIFICASIA PACIFIC FUNCTIONAL COSMETICS MARKET, BY FUNCTIONALITYASIA PACIFIC FUNCTIONAL COSMETICS MARKET, BY APPLICATIONASIA PACIFIC FUNCTIONAL COSMETICS MARKET, BY COUNTRY- China- Japan- India- South Korea
-
9.4 EUROPEIMPACT OF RECESSION ON EUROPEEUROPE FUNCTIONAL COSMETICS MARKET, BY FUNCTIONALITYEUROPE FUNCTIONAL COSMETICS MARKET, BY APPLICATIONEUROPE FUNCTIONAL COSMETICS MARKET, BY COUNTRY- Germany- France- UK- Italy- Spain- Poland
-
9.5 MIDDLE EAST & AFRICAIMPACT OF RECESSION ON MIDDLE EAST & AFRICAMIDDLE EAST & AFRICA FUNCTIONAL COSMETICS MARKET, BY FUNCTIONALITYMIDDLE EAST & AFRICA FUNCTIONAL COSMETICS MARKET, BY APPLICATIONMIDDLE EAST & AFRICA FUNCTIONAL COSMETICS MARKET, BY COUNTRY- Turkey- Iran- Saudi Arabia- South Africa
-
9.6 CENTRAL & SOUTH AMERICAIMPACT OF RECESSION ON CENTRAL & SOUTH AMERICACENTRAL & SOUTH AMERICA FUNCTIONAL COSMETICS MARKET, BY FUNCTIONALITYCENTRAL & SOUTH AMERICA FUNCTIONAL COSMETICS MARKET, BY APPLICATIONCENTRAL & SOUTH AMERICA FUNCTIONAL COSMETICS MARKET, BY COUNTRY- Brazil

- 10.1 INTRODUCTION
- 10.2 STRATEGIES ADOPTED BY KEY PLAYERS
- 10.3 RANKING OF KEY MARKET PLAYERS, 2022
- 10.4 MARKET SHARE ANALYSIS
- 10.5 REVENUE ANALYSIS OF KEY COMPANIES
- 10.6 COMPANY PRODUCT FOOTPRINT ANALYSIS
-
10.7 COMPANY EVALUATION MATRIX (TIER 1)STARSEMERGING LEADERSPERVASIVE PLAYERSPARTICIPANTS
- 10.8 COMPETITIVE BENCHMARKING
-
10.9 STARTUP/SME EVALUATION MATRIXRESPONSIVE COMPANIESPROGRESSIVE COMPANIESDYNAMIC COMPANIESSTARTING BLOCKS
-
10.10 COMPETITIVE SCENARIOS AND TRENDSPRODUCT LAUNCHESDEALS
-
11.1 MAJOR PLAYERSBASF SE- Business overview- Products/Solutions/Services offered- Recent developments- MnM viewNOURYON- Business overview- Products/Solutions/Services offered- Recent developments- MnM viewEVONIK INDUSTRIES AG- Business overview- Products/Solutions/Services offered- Recent developments- MnM viewCLARIANT AG- Business overview- Products/Solutions/Services offered- Recent developments- MnM viewASHLAND INC.- Business overview- Products/Solutions/Services offered- Recent developments- MnM viewGATTEFOSSE- Business overview- Products/Solutions/Services offered- Recent developmentsSTEPAN COMPANY- Business overview- Products/Solutions/Services offered- Recent developmentsLUCAS MEYER COSMETICS- Business overview- Products/Solutions/Services offered- Recent developmentsCRODA INTERNATIONAL PLC- Business overview- Products/Solutions/Services offered- Recent developmentsAIR LIQUIDE S.A.- Business overview- Products/Solutions/Services offered- Recent developments
-
11.2 OTHER KEY PLAYERSCP KELCOEASTMAN CHEMICAL COMPANYEMERY OLEOCHEMICAL GROUPGIVAUDAN SASYMRISE AGSONNEBORN LLCVANTAGE SPECIALTY CHEMICALSUNITED-GUARDIAN, INC.INNOSPEC INC.KAO CORPORATIONMOMENTIVE PERFORMANCE MATERIALS INC.ADEKA CORPORATIONDUPONT DE NEMOURS, INC.ROYAL DSMSOLLICE BIOTECH
- 12.1 INTRODUCTION
- 12.2 LIMITATIONS
-
12.3 PERSONAL CARE INGREDIENTS MARKETMARKET DEFINITIONMARKET OVERVIEWPERSONAL CARE INGREDIENTS MARKET, BY REGION- Europe- Asia Pacific- North America- Middle East & Africa- South America
- 13.1 DISCUSSION GUIDE
- 13.2 KNOWLEDGESTORE: MARKETSANDMARKETS’ SUBSCRIPTION PORTAL
- 13.3 CUSTOMIZATION OPTIONS
- 13.4 RELATED REPORTS
- 13.5 AUTHOR DETAILS
- TABLE 1 FUNCTIONAL COSMETICS MARKET: RISK ASSESSMENT
- TABLE 2 TOP 10 ORGANIC SKIN CARE COMPANIES GLOBALLY, 2022
- TABLE 3 FUNCTIONAL COSMETICS MARKET: PORTER’S FIVE FORCES ANALYSIS
- TABLE 4 GDP TRENDS AND FORECASTS, BY MAJOR ECONOMIES, 2020–2028 (USD BILLION)
- TABLE 5 INFLUENCE OF STAKEHOLDERS ON BUYING PROCESS FOR APPLICATIONS (%)
- TABLE 6 KEY BUYING CRITERIA FOR APPLICATIONS
- TABLE 7 FUNCTIONAL COSMETICS MARKET: ROLE IN ECOSYSTEM
- TABLE 8 BENEFITS OF COSMETIC NANOTECHNOLOGY
- TABLE 9 BENEFITS OF MODIFACE SKIN TECHNOLOGY
- TABLE 10 IMPORT OF FUNCTIONAL COSMETICS, BY REGION, 2017–2022 (USD MILLION)
- TABLE 11 EXPORT OF FUNCTIONAL COSMETICS, BY REGION, 2017–2022 (USD MILLION)
- TABLE 12 FUNCTIONAL COSMETICS MARKET: KEY CONFERENCES & EVENTS, 2023–2024
- TABLE 13 PATENT STATUS: PATENT APPLICATIONS, LIMITED PATENTS, AND GRANTED PATENTS
- TABLE 14 PATENTS BY PROCTER & GAMBLE
- TABLE 15 PATENTS BY L’OREAL S.A.
- TABLE 16 PATENTS BY APPLE BEAUTY INC.
- TABLE 17 TOP 10 PATENT OWNERS IN US, 2012–2022
- TABLE 18 FUNCTIONAL COSMETICS MARKET, BY FUNCTIONALITY, 2016–2021 (USD MILLION)
- TABLE 19 FUNCTIONAL COSMETICS MARKET, BY FUNCTIONALITY, 2022–2028 (USD MILLION)
- TABLE 20 CONDITIONING AGENTS: FUNCTIONAL COSMETICS MARKET, BY REGION, 2016–2021 (USD MILLION)
- TABLE 21 CONDITIONING AGENTS: FUNCTIONAL COSMETICS MARKET, BY REGION, 2022–2028 (USD MILLION)
- TABLE 22 UV FILTERS: FUNCTIONAL COSMETICS MARKET, BY REGION, 2016–2021 (USD MILLION)
- TABLE 23 UV FILTERS: FUNCTIONAL COSMETICS MARKET, BY REGION, 2022–2028 (USD MILLION)
- TABLE 24 ANTI-AGING AGENTS: FUNCTIONAL COSMETICS MARKET, BY REGION, 2016–2021 (USD MILLION)
- TABLE 25 ANTI-AGING AGENTS: FUNCTIONAL COSMETICS MARKET, BY REGION, 2022–2028 (USD MILLION)
- TABLE 26 SKIN-LIGHTENING AGENTS: FUNCTIONAL COSMETICS MARKET, BY REGION, 2016–2021 (USD MILLION)
- TABLE 27 SKIN-LIGHTENING AGENTS: FUNCTIONAL COSMETICS MARKET, BY REGION, 2022–2028 (USD MILLION)
- TABLE 28 OTHERS: FUNCTIONAL COSMETICS MARKET, BY REGION, 2016–2021 (USD MILLION)
- TABLE 29 OTHERS: FUNCTIONAL COSMETICS MARKET, BY REGION, 2022–2028 (USD MILLION)
- TABLE 30 FUNCTIONAL COSMETICS MARKET, BY APPLICATION, 2016–2021 (USD MILLION)
- TABLE 31 FUNCTIONAL COSMETICS MARKET, BY APPLICATION, 2022–2028 (USD MILLION)
- TABLE 32 FUNCTIONAL COSMETICS MARKET IN SKIN CARE APPLICATION, BY REGION, 2016–2021 (USD MILLION)
- TABLE 33 FUNCTIONAL COSMETICS MARKET IN SKIN CARE APPLICATION, BY REGION, 2022–2028 (USD MILLION)
- TABLE 34 FUNCTIONAL COSMETICS MARKET IN HAIR CARE APPLICATION, BY REGION, 2016–2021 (USD MILLION)
- TABLE 35 FUNCTIONAL COSMETICS MARKET IN HAIR CARE APPLICATION, BY REGION, 2022–2028 (USD MILLION)
- TABLE 36 FUNCTIONAL COSMETICS MARKET, BY REGION, 2016–2021 (USD MILLION)
- TABLE 37 FUNCTIONAL COSMETICS MARKET, BY REGION, 2022–2028 (USD MILLION)
- TABLE 38 NORTH AMERICA: FUNCTIONAL COSMETICS MARKET, BY FUNCTIONALITY, 2016–2021 (USD MILLION)
- TABLE 39 NORTH AMERICA: FUNCTIONAL COSMETICS MARKET, BY FUNCTIONALITY, 2022–2028 (USD MILLION)
- TABLE 40 NORTH AMERICA: FUNCTIONAL COSMETICS MARKET, BY APPLICATION, 2016–2021 (USD MILLION)
- TABLE 41 NORTH AMERICA: FUNCTIONAL COSMETICS MARKET, BY APPLICATION, 2022–2028 (USD MILLION)
- TABLE 42 NORTH AMERICA: FUNCTIONAL COSMETICS MARKET, BY COUNTRY, 2016–2021 (USD MILLION)
- TABLE 43 NORTH AMERICA: FUNCTIONAL COSMETICS MARKET, BY COUNTRY, 2022–2028 (USD MILLION)
- TABLE 44 US: FUNCTIONAL COSMETICS MARKET, BY APPLICATION, 2016–2021 (USD MILLION)
- TABLE 45 US: FUNCTIONAL COSMETICS MARKET, BY APPLICATION, 2022–2028 (USD MILLION)
- TABLE 46 CANADA: FUNCTIONAL COSMETICS MARKET, BY APPLICATION, 2016–2021 (USD MILLION)
- TABLE 47 CANADA: FUNCTIONAL COSMETICS MARKET, BY APPLICATION, 2022–2028 (USD MILLION)
- TABLE 48 MEXICO: FUNCTIONAL COSMETICS MARKET, BY APPLICATION, 2016–2021 (USD MILLION)
- TABLE 49 MEXICO: FUNCTIONAL COSMETICS MARKET, BY APPLICATION, 2022–2028 (USD MILLION)
- TABLE 50 ASIA PACIFIC: FUNCTIONAL COSMETICS MARKET, BY FUNCTIONALITY, 2016–2021 (USD MILLION)
- TABLE 51 ASIA PACIFIC: FUNCTIONAL COSMETICS MARKET, BY FUNCTIONALITY, 2022–2028 (USD MILLION)
- TABLE 52 ASIA PACIFIC: FUNCTIONAL COSMETICS MARKET, BY APPLICATION, 2016–2021 (USD MILLION)
- TABLE 53 ASIA PACIFIC: FUNCTIONAL COSMETICS MARKET, BY APPLICATION, 2022–2028 (USD MILLION)
- TABLE 54 ASIA PACIFIC: FUNCTIONAL COSMETICS MARKET, BY COUNTRY, 2016–2021 (USD MILLION)
- TABLE 55 ASIA PACIFIC: FUNCTIONAL COSMETICS MARKET, BY COUNTRY, 2022–2028 (USD MILLION)
- TABLE 56 CHINA: FUNCTIONAL COSMETICS MARKET, BY APPLICATION, 2016–2021 (USD MILLION)
- TABLE 57 CHINA: FUNCTIONAL COSMETICS MARKET, BY APPLICATION, 2022–2028 (USD MILLION)
- TABLE 58 JAPAN: FUNCTIONAL COSMETICS MARKET, BY APPLICATION, 2016–2021 (USD MILLION)
- TABLE 59 JAPAN: FUNCTIONAL COSMETICS MARKET, BY APPLICATION, 2022–2028 (USD MILLION)
- TABLE 60 INDIA: FUNCTIONAL COSMETICS MARKET, BY APPLICATION, 2016–2021 (USD MILLION)
- TABLE 61 INDIA: FUNCTIONAL COSMETICS MARKET, BY APPLICATION, 2022–2028 (USD MILLION)
- TABLE 62 SOUTH KOREA: FUNCTIONAL COSMETICS MARKET, BY APPLICATION, 2016–2021 (USD MILLION)
- TABLE 63 SOUTH KOREA: FUNCTIONAL COSMETICS MARKET, BY APPLICATION, 2022–2028 (USD MILLION)
- TABLE 64 EUROPE: FUNCTIONAL COSMETICS MARKET, BY FUNCTIONALITY, 2016–2021 (USD MILLION)
- TABLE 65 EUROPE: FUNCTIONAL COSMETICS MARKET, BY FUNCTIONALITY, 2022–2028 (USD MILLION)
- TABLE 66 EUROPE: FUNCTIONAL COSMETICS MARKET, BY APPLICATION, 2016–2021 (USD MILLION)
- TABLE 67 EUROPE: FUNCTIONAL COSMETICS MARKET, BY APPLICATION, 2022–2028 (USD MILLION)
- TABLE 68 EUROPE: FUNCTIONAL COSMETICS MARKET, BY COUNTRY, 2016–2021 (USD MILLION)
- TABLE 69 EUROPE: FUNCTIONAL COSMETICS MARKET, BY COUNTRY, 2022–2028 (USD MILLION)
- TABLE 70 GERMANY: FUNCTIONAL COSMETICS MARKET, BY APPLICATION, 2016–2021 (USD MILLION)
- TABLE 71 GERMANY: FUNCTIONAL COSMETICS MARKET, BY APPLICATION, 2022–2028 (USD MILLION)
- TABLE 72 FRANCE: FUNCTIONAL COSMETICS MARKET, BY APPLICATION, 2016–2021 (USD MILLION)
- TABLE 73 FRANCE: FUNCTIONAL COSMETICS MARKET SIZE, BY APPLICATION, 2022–2028 (USD MILLION)
- TABLE 74 UK: FUNCTIONAL COSMETICS MARKET, BY APPLICATION, 2016–2021 (USD MILLION)
- TABLE 75 UK: FUNCTIONAL COSMETICS MARKET, BY APPLICATION, 2022–2028 (USD MILLION)
- TABLE 76 ITALY: FUNCTIONAL COSMETICS MARKET, BY APPLICATION, 2016–2021 (USD MILLION)
- TABLE 77 ITALY: FUNCTIONAL COSMETICS MARKET, BY APPLICATION, 2022–2028 (USD MILLION)
- TABLE 78 SPAIN: FUNCTIONAL COSMETICS MARKET, BY APPLICATION, 2016–2021 (USD MILLION)
- TABLE 79 SPAIN: FUNCTIONAL COSMETICS MARKET, BY APPLICATION, 2022–2028 (USD MILLION)
- TABLE 80 POLAND: FUNCTIONAL COSMETICS MARKET, BY APPLICATION, 2016–2021 (USD MILLION)
- TABLE 81 POLAND: FUNCTIONAL COSMETICS MARKET, BY APPLICATION, 2022–2028 (USD MILLION)
- TABLE 82 MIDDLE EAST & AFRICA: FUNCTIONAL COSMETICS MARKET, BY FUNCTIONALITY, 2016–2021 (USD MILLION)
- TABLE 83 MIDDLE EAST & AFRICA: FUNCTIONAL COSMETICS MARKET, BY FUNCTIONALITY, 2022–2028 (USD MILLION)
- TABLE 84 MIDDLE EAST & AFRICA: FUNCTIONAL COSMETICS MARKET, BY APPLICATION, 2016–2021 (USD MILLION)
- TABLE 85 MIDDLE EAST & AFRICA: FUNCTIONAL COSMETICS MARKET, BY APPLICATION, 2022–2028 (USD MILLION)
- TABLE 86 MIDDLE EAST & AFRICA: FUNCTIONAL COSMETICS MARKET, BY COUNTRY, 2016–2021 (USD MILLION)
- TABLE 87 MIDDLE EAST & AFRICA: FUNCTIONAL COSMETICS MARKET, BY COUNTRY, 2022–2028 (USD MILLION)
- TABLE 88 TURKEY: FUNCTIONAL COSMETICS MARKET, BY APPLICATION, 2016–2021 (USD MILLION)
- TABLE 89 TURKEY: FUNCTIONAL COSMETICS MARKET, BY APPLICATION, 2022–2028 (USD MILLION)
- TABLE 90 IRAN: FUNCTIONAL COSMETICS MARKET, BY APPLICATION, 2016–2021 (USD MILLION)
- TABLE 91 IRAN: FUNCTIONAL COSMETICS MARKET, BY APPLICATION, 2022–2028 (USD MILLION)
- TABLE 92 SAUDI ARABIA: FUNCTIONAL COSMETICS MARKET, BY APPLICATION, 2016–2021 (USD MILLION)
- TABLE 93 SAUDI ARABIA: FUNCTIONAL COSMETICS MARKET, BY APPLICATION, 2022–2028 (USD MILLION)
- TABLE 94 SOUTH AFRICA: FUNCTIONAL COSMETICS MARKET, BY APPLICATION, 2016–2021 (USD MILLION)
- TABLE 95 SOUTH AFRICA: FUNCTIONAL COSMETICS MARKET, BY APPLICATION, 2022–2028 (USD MILLION)
- TABLE 96 CENTRAL & SOUTH AMERICA: FUNCTIONAL COSMETICS MARKET, BY FUNCTIONALITY, 2016–2021 (USD MILLION)
- TABLE 97 CENTRAL & SOUTH AMERICA: FUNCTIONAL COSMETICS MARKET, BY FUNCTIONALITY, 2022–2028 (USD MILLION)
- TABLE 98 CENTRAL & SOUTH AMERICA: FUNCTIONAL COSMETICS MARKET, BY APPLICATION, 2016–2021 (USD MILLION)
- TABLE 99 CENTRAL & SOUTH AMERICA: FUNCTIONAL COSMETICS MARKET, BY APPLICATION, 2022–2028 (USD MILLION)
- TABLE 100 CENTRAL & SOUTH AMERICA: FUNCTIONAL COSMETICS MARKET, BY COUNTRY, 2016–2021 (USD MILLION)
- TABLE 101 CENTRAL & SOUTH AMERICA: FUNCTIONAL COSMETICS MARKET, BY COUNTRY, 2022–2028 (USD MILLION)
- TABLE 102 BRAZIL: FUNCTIONAL COSMETICS MARKET, BY APPLICATION, 2016–2021 (USD MILLION)
- TABLE 103 BRAZIL: FUNCTIONAL COSMETICS MARKET, BY APPLICATION, 2022–2028 (USD MILLION)
- TABLE 104 OVERVIEW OF STRATEGIES ADOPTED BY KEY PLAYERS
- TABLE 105 FUNCTIONAL COSMETICS MARKET: DEGREE OF COMPETITION
- TABLE 106 FUNCTIONAL COSMETICS MARKET: FUNCTIONALITY FOOTPRINT
- TABLE 107 FUNCTIONAL COSMETICS MARKET: APPLICATION FOOTPRINT
- TABLE 108 FUNCTIONAL COSMETICS MARKET: COMPANY REGION FOOTPRINT
- TABLE 109 FUNCTIONAL COSMETICS: DETAILED LIST OF KEY STARTUPS/SMES
- TABLE 110 FUNCTIONAL COSMETICS: COMPETITIVE BENCHMARKING OF KEY STARTUPS/SMES
- TABLE 111 PRODUCT LAUNCHES (2019–2023)
- TABLE 112 DEALS (2019–2023)
- TABLE 113 BASF SE: COMPANY OVERVIEW
- TABLE 114 NOURYON: COMPANY OVERVIEW
- TABLE 115 EVONIK INDUSTRIES AG: COMPANY OVERVIEW
- TABLE 116 CLARIANT AG: COMPANY OVERVIEW
- TABLE 117 ASHLAND INC.: COMPANY OVERVIEW
- TABLE 118 GATTEFOSSE: COMPANY OVERVIEW
- TABLE 119 STEPAN COMPANY: COMPANY OVERVIEW
- TABLE 120 LUCAS MEYER COSMETICS: COMPANY OVERVIEW
- TABLE 121 CRODA INTERNATIONAL PLC: COMPANY OVERVIEW
- TABLE 122 AIR LIQUIDE S.A.: COMPANY OVERVIEW
- TABLE 123 CP KELCO: COMPANY OVERVIEW
- TABLE 124 EASTMAN CHEMICAL COMPANY: COMPANY OVERVIEW
- TABLE 125 EMERY OLEOCHEMICAL GROUP: COMPANY OVERVIEW
- TABLE 126 GIVAUDAN SA: COMPANY OVERVIEW
- TABLE 127 SYMRISE AG: COMPANY OVERVIEW
- TABLE 128 SONNEBORN LLC: COMPANY OVERVIEW
- TABLE 129 VANTAGE SPECIALTY CHEMICALS: COMPANY OVERVIEW
- TABLE 130 UNITED-GUARDIAN, INC.: COMPANY OVERVIEW
- TABLE 131 INNOSPEC INC.: COMPANY OVERVIEW
- TABLE 132 KAO CORPORATION: COMPANY OVERVIEW
- TABLE 133 MOMENTIVE PERFORMANCE MATERIALS INC.: COMPANY OVERVIEW
- TABLE 134 ADEKA CORPORATION: COMPANY OVERVIEW
- TABLE 135 DUPONT DE NEMOURS, INC.: COMPANY OVERVIEW
- TABLE 136 ROYAL DSM: COMPANY OVERVIEW
- TABLE 137 SOLLICE BIOTECH: COMPANY OVERVIEW
- TABLE 138 PERSONAL CARE INGREDIENTS MARKET, BY REGION, 2017–2021 (USD MILLION)
- TABLE 139 PERSONAL CARE INGREDIENTS MARKET, BY REGION, 2022–2027 (USD MILLION)
- TABLE 140 PERSONAL CARE INGREDIENTS MARKET, BY REGION, 2017–2021 (KILOTON)
- TABLE 141 PERSONAL CARE INGREDIENTS MARKET, BY REGION, 2022–2027 (KILOTON)
- TABLE 142 EUROPE: PERSONAL CARE INGREDIENTS MARKET, BY COUNTRY, 2017–2021 (USD MILLION)
- TABLE 143 EUROPE: PERSONAL CARE INGREDIENTS MARKET, BY COUNTRY, 2022–2027 (USD MILLION)
- TABLE 144 EUROPE: PERSONAL CARE INGREDIENTS MARKET, BY COUNTRY, 2017–2021 (KILOTON)
- TABLE 145 EUROPE: PERSONAL CARE INGREDIENTS MARKET, BY COUNTRY, 2022–2027 (KILOTON)
- TABLE 146 ASIA PACIFIC: PERSONAL CARE INGREDIENTS MARKET, BY COUNTRY, 2017–2021 (USD MILLION)
- TABLE 147 ASIA PACIFIC: PERSONAL CARE INGREDIENTS MARKET, BY COUNTRY, 2022–2027 (USD MILLION)
- TABLE 148 ASIA PACIFIC: PERSONAL CARE INGREDIENTS MARKET, BY COUNTRY, 2017–2021 (KILOTON)
- TABLE 149 ASIA PACIFIC: PERSONAL CARE INGREDIENTS MARKET, BY COUNTRY, 2022–2027 (KILOTON)
- TABLE 150 NORTH AMERICA: PERSONAL CARE INGREDIENTS MARKET, BY COUNTRY, 2017–2021 (USD MILLION)
- TABLE 151 NORTH AMERICA: PERSONAL CARE INGREDIENTS MARKET, BY COUNTRY, 2022–2027 (USD MILLION)
- TABLE 152 NORTH AMERICA: PERSONAL CARE INGREDIENTS MARKET, BY COUNTRY, 2017–2021 (KILOTON)
- TABLE 153 NORTH AMERICA: PERSONAL CARE INGREDIENTS MARKET, BY COUNTRY, 2022–2027 (KILOTON)
- TABLE 154 MIDDLE EAST & AFRICA: PERSONAL CARE INGREDIENTS MARKET, BY COUNTRY, 2017–2021 (USD MILLION)
- TABLE 155 MIDDLE EAST & AFRICA: PERSONAL CARE INGREDIENTS MARKET, BY COUNTRY, 2022–2027 (USD MILLION)
- TABLE 156 MIDDLE EAST & AFRICA: PERSONAL CARE INGREDIENTS MARKET, BY COUNTRY, 2017–2021 (KILOTON)
- TABLE 157 MIDDLE EAST & AFRICA: PERSONAL CARE INGREDIENTS MARKET, BY COUNTRY, 2022–2027 (KILOTON)
- TABLE 158 SOUTH AMERICA: PERSONAL CARE INGREDIENTS MARKET, BY COUNTRY, 2017–2021 (USD MILLION)
- TABLE 159 SOUTH AMERICA: PERSONAL CARE INGREDIENTS MARKET, BY COUNTRY, 2022–2027 (USD MILLION)
- TABLE 160 SOUTH AMERICA: PERSONAL CARE INGREDIENTS MARKET, BY COUNTRY, 2017–2021 (KILOTON)
- TABLE 161 SOUTH AMERICA: PERSONAL CARE INGREDIENTS MARKET, BY COUNTRY, 2022–2027 (KILOTON)
- FIGURE 1 FUNCTIONAL COSMETICS MARKET SEGMENTATION
- FIGURE 2 FUNCTIONAL COSMETICS MARKET: RESEARCH DESIGN
- FIGURE 3 MARKET SIZE ESTIMATION METHODOLOGY: APPROACH 1 (SUPPLY SIDE): REVENUE OF FUNCTIONALITIES
- FIGURE 4 MARKET SIZE ESTIMATION METHODOLOGY: APPROACH 1 BOTTOM-UP (SUPPLY SIDE): COLLECTIVE REVENUE OF ALL FUNCTIONALITIES
- FIGURE 5 MARKET SIZE ESTIMATION METHODOLOGY: APPROACH 2 –BOTTOM-UP (DEMAND SIDE): FUNCTIONALITY
- FIGURE 6 MARKET SIZE ESTIMATION METHODOLOGY: APPROACH 3 TOP-DOWN
- FIGURE 7 FUNCTIONAL COSMETICS MARKET: DATA TRIANGULATION
- FIGURE 8 MARKET CAGR PROJECTIONS (SUPPLY SIDE)
- FIGURE 9 MARKET GROWTH PROJECTIONS FROM DEMAND-SIDE DRIVERS AND OPPORTUNITIES
- FIGURE 10 CONDITIONING AGENTS SEGMENT ACCOUNTED FOR LARGEST SHARE OF FUNCTIONAL COSMETICS MARKET IN 2022
- FIGURE 11 SKIN CARE TO BE LARGER AND FASTER GROWING APPLICATION OF FUNCTIONAL COSMETICS MARKET BETWEEN 2023 AND 2028
- FIGURE 12 EUROPE ACCOUNTED FOR LARGEST SHARE OF FUNCTIONAL COSMETICS MARKET IN 2022
- FIGURE 13 HIGH GROWTH EXPECTED IN EMERGING ECONOMIES DURING FORECAST PERIOD
- FIGURE 14 ASIA PACIFIC TO RECORD HIGHEST GROWTH DURING FORECAST PERIOD
- FIGURE 15 GERMANY AND CONDITIONING AGENTS ACCOUNTED FOR LARGEST MARKET SHARE IN 2022
- FIGURE 16 SKIN CARE SEGMENT LED FUNCTIONAL COSMETICS MARKET ACROSS REGIONS
- FIGURE 17 INDIA TO REGISTER HIGHEST CAGR DURING FORECAST PERIOD
- FIGURE 18 DRIVERS, RESTRAINTS, OPPORTUNITIES, AND CHALLENGES IN FUNCTIONAL COSMETICS MARKET
- FIGURE 19 MARKET SIZE OF LEADING COUNTRIES IN NATURAL & ORGANIC COSMETICS, 2022
- FIGURE 20 FUNCTIONAL COSMETICS MARKET: PORTER’S FIVE FORCES ANALYSIS
- FIGURE 21 FUNCTIONAL COSMETICS MARKET: SUPPLY CHAIN ANALYSIS
- FIGURE 22 INFLUENCE OF STAKEHOLDERS ON BUYING PROCESS FOR APPLICATIONS
- FIGURE 23 KEY BUYING CRITERIA FOR APPLICATIONS
- FIGURE 24 REVENUE SHIFT FOR FUNCTIONAL COSMETICS MARKET
- FIGURE 25 FUNCTIONAL COSMETICS MARKET: ECOSYSTEM
- FIGURE 26 IMPORT OF FUNCTIONAL COSMETICS, BY KEY COUNTRY (2017– 2022)
- FIGURE 27 EXPORT OF FUNCTIONAL COSMETICS, BY KEY COUNTRY (2017–2022)
- FIGURE 28 PATENTS REGISTERED IN FUNCTIONAL COSMETICS MARKET, 2012–2022
- FIGURE 29 PATENT PUBLICATION TRENDS, 2012–2022
- FIGURE 30 LEGAL STATUS OF PATENTS FILED IN FUNCTIONAL COSMETICS MARKET
- FIGURE 31 MAXIMUM PATENTS FILED IN JURISDICTION OF US
- FIGURE 32 PROCTER & GAMBLE REGISTERED HIGHEST NUMBER OF PATENTS BETWEEN 2012 AND 2022
- FIGURE 33 CONDITIONING AGENTS SEGMENT TO DOMINATE FUNCTIONAL COSMETICS MARKET DURING FORECAST PERIOD
- FIGURE 34 SKIN CARE APPLICATION TO DOMINATE FUNCTIONAL COSMETICS MARKET DURING FORECAST PERIOD
- FIGURE 35 ASIA PACIFIC TO BE FASTEST-GROWING MARKET FOR FUNCTIONAL COSMETICS DURING FORECAST PERIOD
- FIGURE 36 NORTH AMERICA: FUNCTIONAL COSMETICS MARKET SNAPSHOT
- FIGURE 37 ASIA PACIFIC: FUNCTIONAL COSMETICS MARKET SNAPSHOT
- FIGURE 38 EUROPE: FUNCTIONAL COSMETICS MARKET SNAPSHOT
- FIGURE 39 RANKING OF TOP FIVE PLAYERS, 2022
- FIGURE 40 BASF SE LED FUNCTIONAL COSMETICS MARKET IN 2022
- FIGURE 41 REVENUE ANALYSIS OF KEY COMPANIES DURING PAST FIVE YEARS
- FIGURE 42 FUNCTIONAL COSMETICS: COMPANY FOOTPRINT
- FIGURE 43 COMPANY EVALUATION MATRIX FOR FUNCTIONAL COSMETICS (TIER 1)
- FIGURE 44 STARTUP/SME EVALUATION MATRIX FOR FUNCTIONAL COSMETICS
- FIGURE 45 BASF SE: COMPANY SNAPSHOT
- FIGURE 46 NOURYON: COMPANY SNAPSHOT
- FIGURE 47 EVONIK INDUSTRIES AG: COMPANY SNAPSHOT
- FIGURE 48 CLARIANT AG: COMPANY SNAPSHOT
- FIGURE 49 ASHLAND INC.: COMPANY SNAPSHOT
- FIGURE 50 STEPAN COMPANY: COMPANY SNAPSHOT
- FIGURE 51 CRODA INTERNATIONAL PLC: COMPANY SNAPSHOT
- FIGURE 52 AIR LIQUIDE S.A.: COMPANY SNAPSHOT
The study involved four major activities in estimating the market size for functional cosmetics. Exhaustive secondary research was done to collect information on the market, the peer market, and the parent market. The next step was to validate these findings, assumptions, and sizing with industry experts across the value chain through primary research. Both top-down and bottom-up approaches were employed to estimate the complete market size. Post that, the market breakdown and data triangulation procedures were used to estimate the market size of the segments and subsegments.
Secondary Research
Secondary sources used in this study included annual reports, press releases, and investor presentations of companies; white papers; certified publications; articles from recognized authors; and gold standard & silver standard websites such as Factiva, ICIS, Bloomberg, and others. The findings of this study were verified through primary research by conducting extensive interviews with key officials such as CEOs, VPs, directors, and other executives. The breakdown of profiles of the primary interviewees is illustrated in the figure below:
Primary Research
The Functional cosmetics market comprises several stakeholders, such as raw material suppliers, end-product manufacturers, and regulatory organizations in the supply chain. The demand side of this market is characterized by the automotive, medical, electronics, and others. The supply side is characterized by advancements in technology and diverse application industries. Various primary sources from both the supply and demand sides of the market were interviewed to obtain qualitative and quantitative information.
Breakdown of Primary Participants
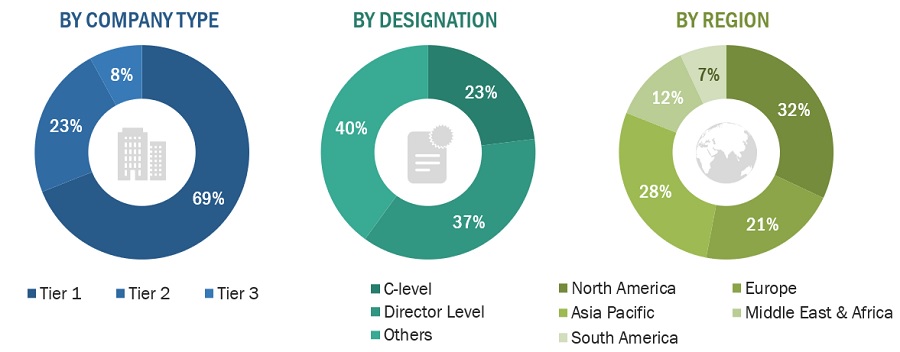
Note: Tier 1, Tier 2, and Tier 3 companies are classified based on their market revenue in 2022 available in the public domain, product portfolios, and geographical presence.
Other designations include consultants and sales, marketing, and procurement managers.
To know about the assumptions considered for the study, download the pdf brochure
|
COMPANY NAME |
DESIGNATION |
|
BASF SE |
Director of Marketing |
|
Nouryon |
Manager- Sales & Marketing |
|
Evonik Industries AG |
Sales Manager |
|
Clariant AG |
Production Manager |
|
Ashland Inc. |
Sales Manager |
Market Size Estimation
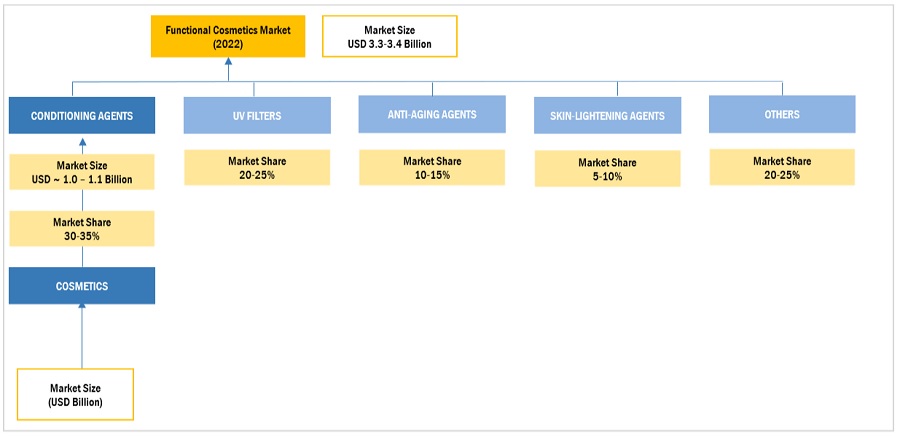
Both top-down and bottom-up approaches were used to estimate and validate the total size of the Functional cosmetics market. These methods were also used extensively to estimate the size of various subsegments in the market. The research methodology used to estimate the market size includes the following:
- The key players in the industry have been identified through extensive secondary research.
- The supply chain of the industry has been determined through primary and secondary research.
- All percentage shares, splits, and breakdowns have been determined using secondary sources and verified through primary sources.
- All possible parameters that affect the markets covered in this research study have been accounted for, viewed in extensive detail, verified through primary research, and analyzed to obtain the final quantitative and qualitative data.
Functional Cosmetics Market: Bottom-Up Approach
To know about the assumptions considered for the study, Request for Free Sample Report
Functional Cosmetics Market: Top-Down Approach

Data Triangulation
After arriving at the overall market size—using the market size estimation processes as explained above—the market was split into several segments and subsegments. To complete the overall market engineering process and arrive at the exact statistics of each market segment and subsegment, the data triangulation, and market breakdown procedures were employed, wherever applicable. The data was triangulated by studying various factors and trends from both the demand and supply sides in the functional cosmetics industry.
Market Definition
According to BIORIUS, functional cosmetics are cosmetic ingredients that help whiten the skin, decrease wrinkles, protect from ultraviolet (UV) rays, change hair color, remove hair or nourish hair, and correct dryness, cracking, or peeling skin.
Key Stakeholders
- Functional cosmetics manufacturers
- Functional cosmetics distributors
- Functional cosmetics suppliers
- Government and research organizations
- Investment banks and private equity firms Venture capital firms
- Wastewater treatment equipment manufacturers, dealers, and suppliers
- Water testing and packaging vendors
Report Objectives
- To define, describe, and forecast the functional cosmetics market in terms of value
- To provide detailed information regarding the drivers, opportunities, restraints, and challenges influencing market growth
- To estimate and forecast the market size by functionality, application, and region
- To forecast the size of the market for five main regions: Europe, North America, Asia Pacific, Central South America, and the Middle East & Africa, along with their key countries
- To strategically analyze micromarkets1 with respect to their growth trends, prospects, and contribution to the overall market
- To analyze opportunities in the market for stakeholders and provide a competitive landscape for market leaders
- To analyze competitive developments, such as deals and expansions, in the market
- To analyze the impact of the recession on the market
- To strategically profile key players and comprehensively analyze their growth strategies
Available Customizations
Along with the given market data, MarketsandMarkets offers customizations according to the company’s specific needs. The following customization options are available for the report:
Regional Analysis
- Further breakdown of a region with respect to a particular country or additional application type
Company Information
- Detailed analysis and profiles of additional market players (up to five)


 Generating Response ...


Growth opportunities and latent adjacency in Functional Cosmetics Market