Functional Food Ingredients Market

Functional Food Ingredients Market by Type (Probiotics, Prebiotics, Proteins & Amino Acids, Phytochemicals & Plant Extracts, Omega-3 Fatty Acids, Carotenoids, and Fibers & Specialty Carbohydrates), Source, Application, and Region - Global Forecast to 2026

Report Code: FB 3559 Jun, 2021, by marketsandmarkets.com
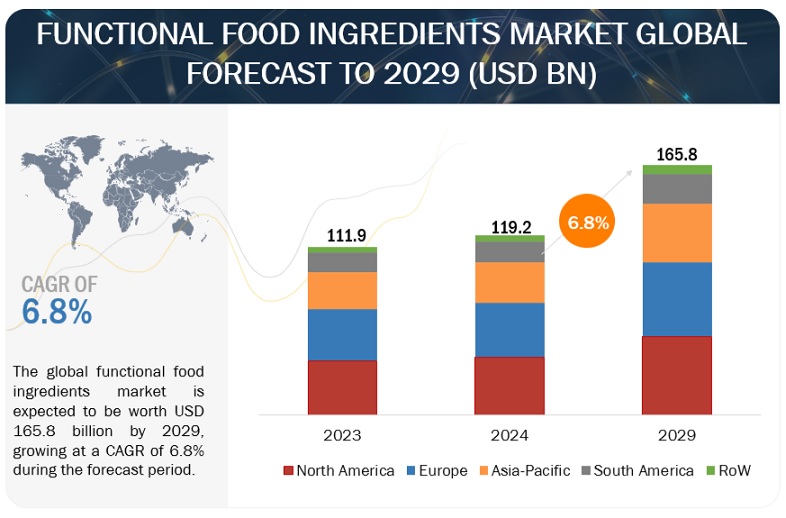
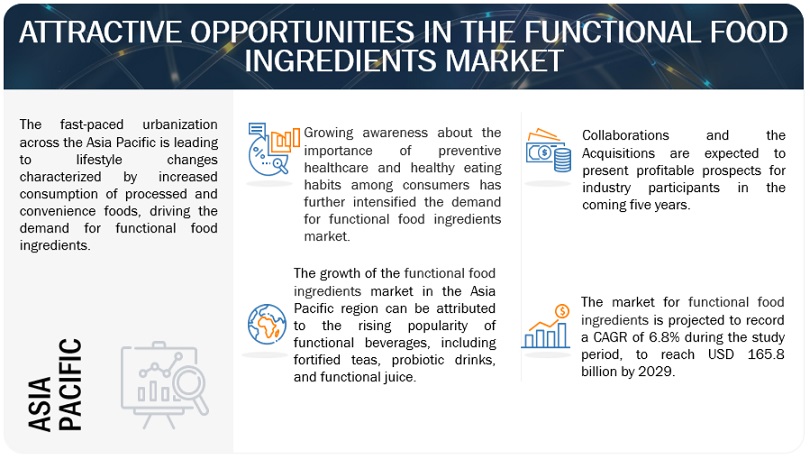
The functional food ingredients market is estimated at USD 98.9 billion in 2021; it is projected to grow at a CAGR of 6.8% to reach USD 137.1 billion by 2026. The market is anticipated to experience growth during the forecast period due to the increasing preference for nutritional and convenient food, as well as the rising demand for fortified food and beverage products. However, there are certain factors that hinder the market growth. These include the need to adhere to international quality standards and regulations, as well as the lack of awareness about functional ingredients such as prebiotics and probiotics in developing countries.
 

Functional Food Ingredients Market

To know about the assumptions considered for the study, Request for Free Sample Report
Prebiotics and probiotics are the emerging functional food ingredient segments in which researchers are focusing on developing different applications and benefits. Nutrigenomics or personalized nutrition is a specialized diet in which food scientists seek to treat chronic health conditions such as cardiovascular disease, obesity, Alzheimer’s disease, and diabetes using specific functional food ingredients.

It is an emerging concept in the functional food ingredients market, and leading food manufacturers such as Cargill (US), Archer Daniels Midland Company (US), and Koninklijke DSM N.V. (Netherlands) are investing substantially in R&D. The most common emerging technologies in the industry are high-hydrostatic pressure, ultrasound-assisted and microwave-assisted extraction, pulsed electric field, radio-frequency drying, high voltage electrical discharge, and supercritical fluids. Other emerging technologies still under development include cold plasma treatment, electro-osmotic dewatering, and nanoencapsulation.

Veganism has shown remarkable growth over the last couple of years. It is further projected to increase, and consumer demand is projected to shift to plant-based meat and dairy products. The current outbreak of COVID-19 and negative associations with animal-based foods will further shift the consumers to plant-based ingredients. Since a large number of protein ingredients have entered the market for food products, it is further projected to increase. Due to COVID-19, sustainability, low-carbon footprint, and positive health effects offered by plant-based ingredients such as pea protein, pea starch, antioxidants from Brussel sprouts, polyphenols from fig and omega-3, and other functional ingredients from hemp will enable plant-based ingredients to take further precedence over animal-based food. This will further drive revenues and investments in plant-sourced ingredients.

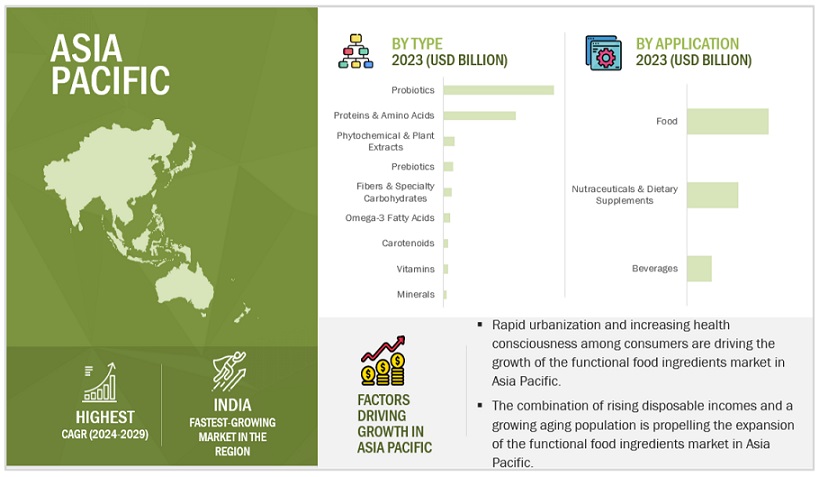
The North American market accounted for the largest share in 2020. Functional food ingredients market is projected to be driven by the increase in consumer demand for healthy convenience food due to their busy lifestyles. Further, increasing occurrences of obesity and cardiac diseases have led consumers to demand functional food products, thereby driving the market. The South American market is projected to grow at the highest CAGR from 2021 to 2026. The growing food processing industry in the region, along with the growing health consciousness, has a direct impact on the industry in the region owing to the use of the ingredients in energy drinks & bars, dairy products, and infant-fortified food. This is the key reason for the high growth rates of all types of ingredients in this region.

Functional Food Ingredients Market Dynamics

Drivers: Increase in consumption of nutritive convenience and fortified food

The global demand for fortified food is expanding at a robust pace. Functional food ingredients such as vitamins, minerals, antioxidants, hydrocolloids, prebiotics, amino acids, plant extracts, and carotenoids are the key ingredients of fortified food. The health-conscious population is rapidly expanding in emerging markets, which will drive the demand for the fortification of food. The nutritional consumption differences across regions contribute greatly to the apparent differences in the health of populations across the countries. Various factors such as increasing instances of chronic diseases and micronutrient deficiencies, growth of the middle class in emerging economies, new government fortification programs, growth of the world’s older population in regions such as Europe, and growing interest in health and wellness, owing to COVID-19, is expected to drive the sales of fortified foods, further driving the demand for functional food ingredients market.

Restraints: Higher cost for functional food products due to the inclusion of healthier or naturally sourced ingredients

The development and commerce aspects are complex, expensive, and uncertain. Factors behind the success of product development are technological conditions, consumer demand, and legislative, regulatory background. Substantial investment is required for the R&D of a strain to be used for the production of new functional ingredients such as probiotics. Probiotic strains and products are developed and produced in accordance with international food regulations. Also, highly sterilized and technical equipment and processes are required for the manufacturing and extraction of various other functional ingredients. As a result of the high cost of production, the price of the final product is also high. Marketing and distribution further add to the product price. Although consumers are aware of the health benefits derived from these expensive functional food ingredients, their high prices restrict consumers from buying the product

Opportunities: Adoption of new technologies in the functional food industry

The introduction of new technologies such as encapsulation, nanoencapsulation, and bio-encapsulation drives technological innovations in the functional food ingredients market. Encapsulation technology helps in enhancing the taste of many food products. For instance, omega-3 fatty acids are associated with bad odor. The taste and fragrance of these ingredients are enhanced with the use of encapsulation technology. The recent advancements in liposome technology are being used in the manufacturing of several ingredients such as probiotics and other ingredients, offering numerous health benefits. Thus, this has increased technological innovations for niche applications such as gourmet food and infant.

Challenges: Complexities related to the integration and adulteration of functional food products

Consumers’ knowledge of the health effects of specific ingredients can affect the acceptance of specific functional food. The common functional ingredients such as minerals, fiber, and vitamins are preferred over new and improved products such as foods enriched with probiotics, prebiotics, flavonoids, carotenoids, and conjugated linolenic acid.

The researcher has to work in-depth to overcome all the challenges in the functional food ingredients market related to the selection and development of strain and related production processes. The basic requirement for probiotics is that products should contain sufficient numbers of microorganisms up to the expiry date. Thus, probiotics must contain specific strains and maintain certain numbers of live cells for them to produce health benefits in the host.

The growing awareness about the health benefits of carotenoids such as beta-carotene, lutein, and zeaxanthin, the demand for carotenoids is expected to increase in the coming years.

Carotenoids are protective nutrients and are naturally occurring pigments present in most plants. They are mainly found in plants, algae, and photosynthetic bacteria; however, humans and animals have to rely on food as a source of these compounds. Some flavonoids include quercetin, kaempferol, catechins, and anthocyanidins. Flavonoids are known for their antioxidant and anti-inflammatory health benefits as well as their role in the strengthening of cardiovascular and nervous systems.

Carotenoids are a widely distributed group of naturally occurring pigments synthesized by plants, algae, and photosynthetic bacteria. They are extensively used as safe, natural colorants for food, feed, and cosmetics. They are known to be essential for plant growth and photosynthesis and are a main dietary source of vitamin A in humans. They reduce the risk of several chronic health disorders, heart disease, and eye degeneration. As a result, the functional food ingredients market is experiencing growth.

Plant source is projected to be the fastest-growing segment in the natural source segment from 2021 to 2026

Prebiotics, proteins, omega-3 fatty acids, minerals, fibers, phytochemicals, and plant extracts are the major types of the ingredients derived from plant sources. Plant-based proteins are a major source of protein for vegetarians and vegans. Their high nutritional profile, low carbon footprint, and low price are driving their consumption. Soy, corn, pulses, millet, sorghum, sunflower seeds, wheat, groundnuts, barley, and beans are some of the major plant-based sources that are rich in amino acid content. The growing inclination of consumers toward natural and plant-based products has been fueling the demand for plant-based food amino acids over the last few years. Phytochemicals are also derived from plant sources such as fruits & vegetables, nuts & seeds, and spices & herbs, among others.

The energy drinks segment in the beverages application is projected to grow at the highest CAGR in the functional food ingredients market during the forecast period

Functional food ingredients such as vitamins, minerals, and proteins are used in energy drinks. Many energy drinks have been developed by companies to provide specific medical or health benefits, such as promoting heart health, improving immunity, and helping to boost energy. With the broadening range of functional applications being sought by consumers, suppliers are looking to utilize new ingredients that better meet the functional goals of consumers. In the sports drink field, suppliers are expanding their choice of ingredients to enhance sports nutrition benefits. Drinks with creatine's and branch-chained amino acids are growing in popularity.

Functional Food Ingredients Market by Region

North America is projected to account for the largest market size during the forecast period

The North American region dominates the market in 2020. This dominance is driven by the prevalence of chronic diseases due to hectic lifestyles and increasing awareness among consumers regarding the health benefits of functional foods. In addition, the region has the highest prevalence of obesity. The functional food ingredients market focuses on investing more in research programs with an aim to introduce new ingredients to address the diversified demands from potential customers in the region. The key market players in the North American industry include Cargill, Incorporated (US), Archer Daniels Midland Company (US), and DuPont (US). These industry players have their R&D centers where they develop a wide range of ingredients for the food & beverage industry. Cargill invested USD 146 million to expand its protein production facility in Nashville, Tennessee, US.

Top Companies in Functional Food Ingredients Market

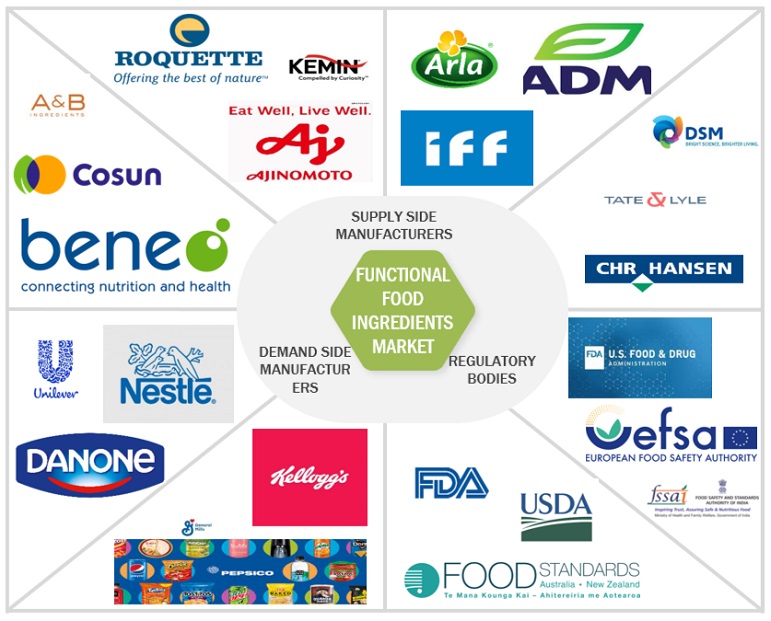
Key players in this market include Cargill, Incorporated (US), BASF SE (Germany), Archer Daniels Midland Company (US), DuPont (US), Arla Foods (Denmark), Kerry Group (Ireland), Ajinomoto Co., Inc. (Japan), Koninklijke DSM N.V. (Netherlands), Ingredion Incorporated (US), and Tate & Lyle PLC (UK). Some of the other players include Chr. Hansen Holding A/S (Denmark), Kemin Industries, Inc. (US), BENEO (Germany), Royal Cosun (Netherland), Roquette Frères (France), Soylent (US), A&B Ingredients (US), Golden Grain Group Limited (China), Sugarlogix (US), and Stratum Nutrition (US).

Functional Food Ingredients Market Report Scope

Report Metric

Details

Functional Food Ingredients Market Estimated Size (2021) US $98.9 Billion
Projected Market Valuation (2026) US $137.1 Billion
Value-based CAGR (2021-2026) 6.8% CAGR

Number of Pages

326 Pages Report

Forecast period

2021–2026

Market Drivers

  • Increase in consumption of nutritive convenience and fortified food
  • Growth in health awareness among consumers leading to increased consumption of healthier diets
  • Rise in incidences of chronic diseases

Market Opportunities

  • Development of different techniques to create high-value natural carotenoids

Units considered

Value (USD) & Volume (Tons)

Segments covered

Types, sources, applications, health benefits, and regions.

Regions covered

North America, Asia Pacific, Europe, South America, and RoW

Companies studied

Cargill, Incorporated, BASF SE, Archer Daniels Midland Company, DuPont, Arla Foods, Kerry Group, Ajinomoto Co., Inc., Koninklijke DSM N.V., Ingredion Incorporated, Tate & Lyle PLC, Chr. Hansen Holding A/S, Kemin Industries, Inc., BENEO, Royal Cosun, Roquette Frères, Soylent, A&B Ingredients, Golden Grain Group Limited, Sugarlogix, Stratum Nutrition

Largest Growing Region

North America

Functional Food Ingredients Market Highlights

This research report categorizes the functional food ingredients market based on types, sources, applications, health benefits, and regions

Segment

Subsegment

Market by Type

  • Probiotics
  • Proteins & amino acids
  • Phytochemicals & plant extracts
  • Prebiotics
  • Fibers & specialty carbohydrates
  • Fibers & specialty carbohydrates
  • Carotenoids
  • Vitamins

Market By Health Benefits

  • Gut health
  • Cardiovascular health
  • Cardiovascular health
  • Immunity
  • Nutritive health
  • Weight management
  • Other health benefits

Market By Application

  • Food
    • Infant food
    • Dairy products
    • Bakery products
    • Confectionery Products
    • Snacks
    • Other food applications (breakfast cereal and flours)
  • Beverages
    • Juices
    • Health drinks

Market By Type

  • Natural
    • Animal
    • Microbial
    • Plant
  • Synthetic

Market by Region

  • North America
  • Europe
  • Asia Pacific (APAC)
  • South America
  • Rest of the World (RoW)

Recent Developments in Functional Food Ingredients Market

  • In May 2022, Cargill launched a new probiotic product named EpiCor, which is a dried yeast fermentate clinically shown in dietary supplement trials to beneficially modulate the gut microbiota and provide immune system support.
  • In February 2022, Cargill and Manna Tree invested in Evolve BioSystems, Inc., which would help the company continue commercializing next-generation probiotics capable of addressing a widespread deficiency in the infant gut microbiome.
  • In September 2021, ADM launched Arcon T textured pea proteins, Prolite MeatTEX textured wheat protein, and Prolite MeatXT non-textured wheat protein. These highly functional protein solutions would improve the texture and density of meat alternatives and are particularly useful for achieving consumer-preferred, meat-like texture. It would be easier for the company to overcome the barrier by creating better-tasting products with improved texture and color.
  • In February 2021, Grupo Arcor and Ingredion Incorporated entered into a joint venture, which would help companies’ manufacture expertise, complementary geographic footprints, and commercial capabilities to broaden food & beverage ingredient offerings to customers in Argentina, Chile, and Uruguay.

Frequently Asked Questions (FAQ):

To speak to our analyst for a discussion on the above findings, click Speak to Analyst


TABLE OF CONTENTS

1 INTRODUCTION (Page No. - 29)
    1.1 OBJECTIVES OF THE STUDY
    1.2 MARKET DEFINITION
    1.3 STUDY SCOPE
           FIGURE 1 MARKET SEGMENTATION
           1.3.1 INCLUSIONS AND EXCLUSIONS
    1.4 REGIONS COVERED
    1.5 PERIODIZATION CONSIDERED
    1.6 CURRENCY CONSIDERED
           TABLE 1 USD EXCHANGE RATES, 2016–2020
    1.7 VOLUME UNIT CONSIDERED
    1.8 STAKEHOLDERS
    1.9 SUMMARY OF CHANGES

2 RESEARCH METHODOLOGY (Page No. - 36)
    2.1 RESEARCH DATA
           FIGURE 2 FUNCTIONAL FOOD INGREDIENTS MARKET: RESEARCH DESIGN
           2.1.1 SECONDARY DATA
                    2.1.1.1 Key data from secondary sources
           2.1.2 PRIMARY DATA
                    2.1.2.1 Key industry insights
                    2.1.2.2 Breakdown of primary interviews
           FIGURE 3 BREAKDOWN OF PRIMARY INTERVIEWS, BY COMPANY TYPE, DESIGNATION, AND REGION
    2.2 MARKET SIZE ESTIMATION
           FIGURE 4 MARKET SIZE ESTIMATION: SUPPLY SIDE (1/2)
           FIGURE 5 MARKET SIZE ESTIMATION: SUPPLY SIDE (2/2)
           FIGURE 6 MARKET SIZE ESTIMATION: DEMAND SIDE
           2.2.1 MARKET SIZE ESTIMATION: BOTTOM-UP APPROACH
                    FIGURE 7 MARKET SIZE ESTIMATION: BOTTOM-UP APPROACH
           2.2.2 MARKET SIZE ESTIMATION METHODOLOGY: TOP-DOWN APPROACH
                    FIGURE 8 MARKET SIZE ESTIMATION: TOP-DOWN APPROACH
    2.3 DATA TRIANGULATION
           FIGURE 9 DATA TRIANGULATION
    2.4 ASSUMPTIONS FOR THE STUDY
    2.5 RESEARCH LIMITATIONS & ASSOCIATED RISKS
    2.6 MARKET SCENARIOS CONSIDERED FOR THE IMPACT OF COVID-19
           2.6.1 SCENARIO-BASED MODELLING
    2.7 COVID-19 HEALTH ASSESSMENT
           FIGURE 10 COVID-19: GLOBAL PROPAGATION
           FIGURE 11 COVID-19 PROPAGATION: SELECT COUNTRIES
    2.8 COVID-19 ECONOMIC ASSESSMENT
           FIGURE 12 REVISED GROSS DOMESTIC PRODUCT FORECASTS FOR SELECT G20 COUNTRIES IN 2020
           2.8.1 COVID-19 ECONOMIC IMPACT—SCENARIO ASSESSMENT
                    FIGURE 13 CRITERIA IMPACTING THE GLOBAL ECONOMY
                    FIGURE 14 SCENARIOS IN TERMS OF RECOVERY OF GLOBAL ECONOMY

3 EXECUTIVE SUMMARY (Page No. - 53)
    TABLE 2 FUNCTIONAL FOOD INGREDIENTS MARKET SNAPSHOT, 2021 VS. 2026
    FIGURE 15 IMPACT OF COVID-19 ON THE MARKET SIZE, BY SCENARIO, 2020 VS. 2021 (USD MILLION)
    FIGURE 16 MARKET SIZE, BY TYPE, 2021 VS. 2026 (USD MILLION)
    FIGURE 17 MARKET SHARE (VALUE), BY SOURCE, 2021 VS. 2026
    FIGURE 18 MARKET SIZE, BY APPLICATION, 2021 VS. 2026 (USD MILLION)
    FIGURE 19 MARKET SHARE (VALUE), BY REGION, 2020

4 PREMIUM INSIGHTS (Page No. - 58)
    4.1 ATTRACTIVE OPPORTUNITIES IN THE MARKET
           FIGURE 20 GROWING HEALTH AWARENESS AMONG CONSUMERS TO DRIVE THE DEMAND FOR FUNCTIONAL FOOD INGREDIENTS
    4.2 MARKET, BY KEY COUNTRY
           FIGURE 21 BRAZIL & INDIA ARE PROJECTED TO BE THE FASTEST-GROWING MARKETS DURING THE FORECAST PERIOD
    4.3 NORTH AMERICA: MARKET, BY KEY TYPE & COUNTRY
           FIGURE 22 PROBIOTICS ACCOUNTED FOR THE LARGEST SHARE OF THE NORTH AMERICAN MARKET IN 2020
    4.4 MARKET, BY APPLICATION & REGION
           FIGURE 23 NORTH AMERICA TO DOMINATE THE MARKET ACROSS ALL APPLICATIONS IN 2020

5 FUNCTIONAL FOOD INGREDIENTS, BY SOURCE & REGION (Page No. - 61)
           FIGURE 24 NATURAL SOURCE TO BE THE FASTER-GROWING SEGMENT DURING THE FORECAST PERIOD
    5.1 COVID-19 IMPACT ON THE MARKET
           FIGURE 25 CHART OF PRE- & POST-COVID SCENARIOS IN THE FUNCTIONAL FOOD INGREDIENTS MARKET

6 MARKET OVERVIEW (Page No. - 62)
    6.1 INTRODUCTION
    6.2 MACROECONOMIC INDICATORS
           6.2.1 DEVELOPMENT IN THE RETAIL INDUSTRY
                     FIGURE 26 INDIA: RETAIL MARKET SIZE, 2021 (USD BILLION)
                     FIGURE 27 AUSTRALIA: RETAIL SALES OF FUNCTIONAL AND FORTIFIED FOOD PRODUCTS, 2018–2022 (USD MILLION)
                     FIGURE 28 INDIA: ONLINE RETAIL MARKET SIZE, 2021 (USD BILLION)
           6.2.2 RISE IN THE NUMBER OF DUAL-INCOME HOUSEHOLDS
                     FIGURE 29 US: EMPLOYMENT STATUS OF PARENTS WITH OWN CHILDREN OF UNDER 18 YEARS, 2020
    6.3 MARKET DYNAMICS
           FIGURE 30 MARKET DYNAMICS: FUNCTIONAL FOOD INGREDIENTS MARKET
           6.3.1 DRIVERS
                    6.3.1.1 Increase in consumption of nutritive convenience and fortified food
                               FIGURE 31 NUMBER OF COUNTRIES MANDATING FOOD FORTIFICATION, 2011–2019
                               FIGURE 32 CONSUMER PERCEPTION OF SPECIFIC NUTRIENTS’ ADEQUACY IN DIETS, 2020
                    6.3.1.2 Growth in health awareness among consumers leading to increased consumption of healthier diets
                               FIGURE 33 DIETS FOLLOWED BY CONSUMERS IN 2020
                    6.3.1.3 Rise in incidences of chronic diseases
                               FIGURE 34 CHRONIC DISEASES WERE AMONG THE TOP TEN CAUSES OF DEATH AMONG ALL AGES, 2019 (MILLION)
                    6.3.1.4 Research & development and expansion of production capacity to enhance applicability & accelerate growth
                    6.3.1.5 Mandates on food fortification by government organizations
                               TABLE 3 PREVALENCE OF THE THREE MAJOR MICRONUTRIENT DEFICIENCIES, BY REGION, 2009
           6.3.2 RESTRAINTS
                    6.3.2.1 Higher cost for functional food products due to the inclusion of healthier or naturally sourced ingredients
                               FIGURE 35 FREQUENCY OF FUNCTIONAL FOOD CONSUMPTION, 2019
                    6.3.2.2 Increase in instances of allergies and intolerances related to few ingredients
           6.3.3 OPPORTUNITIES: FUNCTIONAL FOOD INGREDIENTS MARKET
                    6.3.3.1 Development of different techniques to create high-value natural carotenoids
                               FIGURE 36 CAROTENOIDS PROCESSING, BY TECHNOLOGY
                    6.3.3.2 Alternative sources to obtain omega-3
                               TABLE 4 UPCOMING ALTERNATIVE SOURCES FOR OMEGA-3 FATTY ACIDS
                    6.3.3.3 Adoption of new technologies in the functional food industry
                               6.3.3.3.1 Use of encapsulation technology
           6.3.4 CHALLENGES
                    6.3.4.1 Complexities related to the integration and adulteration of functional food products
                    6.3.4.2 Lack of consistency in regulations pertaining to various ingredients
    6.4 IMPACT OF COVID-19 ON THE MARKET DYNAMICS
           6.4.1 COVID-19 BOOSTS THE DEMAND FOR HIGH-QUALITY AND PREMIUM PRODUCTS
           6.4.2 COVID-19 IMPACT ON RAW MATERIAL AVAILABILITY AND SUPPLY CHAIN DISRUPTION
           6.4.3 COVID-19 TO SHIFT THE DEMAND TOWARD PLANT-SOURCED INGREDIENTS

7 INDUSTRY TRENDS (Page No. - 78)
    7.1 INTRODUCTION
    7.2 SUPPLY CHAIN ANALYSIS
           FIGURE 37 PRODUCT DEVELOPMENT AND MANUFACTURING PLAY A VITAL ROLE IN THE SUPPLY CHAIN FOR THE FUNCTIONAL FOOD INGREDIENTS MARKET
    7.3 ECOSYSTEM
           FIGURE 38 FUNCTIONAL FOOD INGREDIENTS: MARKET MAP
           TABLE 5 MARKET: ECOSYSTEM
           7.3.1 UPSTREAM
                    7.3.1.1 Ingredient Manufacturers
                    7.3.1.2 Technology Providers
                    7.3.1.3 Start-ups/Emerging Companies
           7.3.2 DOWNSTREAM
                    7.3.2.1 Regulatory Bodies
                    7.3.2.2 End Users
    7.4 VALUE CHAIN ANALYSIS
           FIGURE 39 MARKET: VALUE CHAIN
           7.4.1 SOURCING OF RAW MATERIALS
           7.4.2 PRODUCTION & PROCESSING
           7.4.3 DISTRIBUTION, MARKETING, AND SALES
    7.5 TECHNOLOGY ANALYSIS
           7.5.1 FUNCTIONAL FOOD INGREDIENTS AND MICROENCAPSULATION
                    7.5.1.1 Encapsulation of Omega-3 to mask the odor
           7.5.2 FUNCTIONAL FOOD INGREDIENTS AND ROBOTS
    7.6 PRICING ANALYSIS: FUNCTIONAL FOOD INGREDIENTS MARKET, BY TYPE
           FIGURE 40 PRICING TREND OF THE FUNCTIONAL FOOD INGREDIENTS, 2017–2020 (USD/KG)
    7.7 TRENDS/DISRUPTIONS IMPACTING THE CUSTOMER’S BUSINESS
           FIGURE 41 YC-YCC: REVENUE SHIFT FOR THE MARKET
    7.8 PORTER’S FIVE FORCES ANALYSIS
           TABLE 6 MARKET: PORTER’S FIVE FORCES ANALYSIS
           7.8.1 INTENSITY OF COMPETITIVE RIVALRY
           7.8.2 BARGAINING POWER OF SUPPLIERS
           7.8.3 BARGAINING POWER OF BUYERS
           7.8.4 THREAT OF NEW ENTRANTS
           7.8.5 THREAT OF SUBSTITUTES
    7.9 PATENT ANALYSIS
           FIGURE 42 PATENT INSIGHTS, 2020
           FIGURE 43 LIST OF TOP PATENTS IN THE MARKET FOR THE LAST TEN YEARS
           TABLE 7 KEY PATENTS PERTAINING TO FUNCTIONAL FOOD INGREDIENTS, 2020–2021
    7.10 TRADE ANALYSIS
           TABLE 8 KEY EXPORTING COUNTRIES WITH EXPORT VALUE OF VITAMINS & VITAMIN SUPPLEMENTS, 2019 (USD MILLION)
           FIGURE 44 IMPORT TARIFF OF KEY COUNTRIES ON VITAMINS & VITAMIN SUPPLEMENTS, 2019
    7.11 CASE STUDIES ANALYSIS: FUNCTIONAL FOOD INGREDIENTS MARKET
           7.11.1 USE CASE 1: TATSEWISE’S AI AND MACHINE LEARNING SOLUTION HELPED MEET THE INCREASING DEMAND
           7.11.2 USE CASE 2: MINDRIGHT’S BARS HELPED COMBAT MENTAL HEALTH ISSUES

8 REGULATORY FRAMEWORKS (Page No. - 101)
    8.1 INTRODUCTION
    8.2 NORTH AMERICA
           8.2.1 CANADA
           8.2.2 US
           8.2.3 MEXICO
    8.3 EUROPEAN UNION (EU)
    8.4 ASIA PACIFIC
           8.4.1 JAPAN
           8.4.2 CHINA
           8.4.3 INDIA
           8.4.4 AUSTRALIA & NEW ZEALAND
    8.5 SOUTH AMERICA
           8.5.1 BRAZIL
           8.5.2 ARGENTINA
    8.6 REST OF THE WORLD (ROW)
           8.6.1 MIDDLE EAST
    8.7 PROBIOTICS
           8.7.1 INTRODUCTION
                    TABLE 9 NATIONAL/INTERNATIONAL BODIES FOR SAFETY STANDARDS AND REGULATIONS
           8.7.2 NORTH AMERICA: REGULATORY ENVIRONMENT ANALYSIS
                    8.7.2.1 US
                    8.7.2.2 Canada
           8.7.3 EUROPE: REGULATORY ENVIRONMENT ANALYSIS
           8.7.4 ASIA PACIFIC: REGULATORY ENVIRONMENT ANALYSIS
                    8.7.4.1 Japan
                    8.7.4.2 India
           8.7.5 SOUTH AMERICA: REGULATORY ENVIRONMENT ANALYSIS
                    8.7.5.1 Brazil
    8.8 PREBIOTICS
           8.8.1 INTRODUCTION
           8.8.2 ASIA PACIFIC
                    8.8.2.1 Japan
                    8.8.2.2 Australia & New Zealand
                    8.8.2.3 South Korea
                    8.8.2.4 India
                               TABLE 10 SCHEDULE XI OF FOOD SAFETY AND STANDARDS REGULATIONS, 2015, FOR THE LIST OF APPROVED PREBIOTIC INGREDIENTS
           8.8.3 NORTH AMERICA
                    8.8.3.1 US
                    8.8.3.2 Canada
                               TABLE 11 LIST OF ACCEPTED DIETARY FIBERS BY CANADIAN REGULATORY AUTHORITIES & THEIR SOURCES
                    8.8.3.3 European Union

9 FUNCTIONAL FOOD INGREDIENTS MARKET, BY HEALTH BENEFITS (Page No. - 111)
    9.1 INTRODUCTION
    9.2 GUT HEALTH
    9.3 CARDIOVASCULAR HEALTH
    9.4 BONE HEALTH
           TABLE 12 BONE-BUILDING NUTRIENTS & THEIR THERAPEUTIC RANGE
    9.5 IMMUNITY
    9.6 NUTRITIVE HEALTH
    9.7 WEIGHT MANAGEMENT
    9.8 OTHER HEALTH BENEFITS

10 FUNCTIONAL FOOD INGREDIENTS MARKET, BY TYPE (Page No. - 115)
     10.1 INTRODUCTION
             FIGURE 45 MARKET SIZE, BY TYPE, 2021 VS. 2026 (USD MILLION)
             TABLE 13 MARKET SIZE, BY TYPE, 2016–2020 (USD MILLION)
             TABLE 14 MARKET SIZE, BY TYPE, 2021–2026 (USD MILLION)
     10.2 COVID-19 IMPACT ON THE MARKET, BY TYPE
             10.2.1 OPTIMISTIC SCENARIO
                        TABLE 15 OPTIMISTIC SCENARIO: MARKET SIZE, BY TYPE, 2018–2021 (USD MILLION)
             10.2.2 REALISTIC SCENARIO
                        TABLE 16 REALISTIC SCENARIO: MARKET SIZE, BY TYPE, 2018–2021 (USD MILLION)
             10.2.3 PESSIMISTIC SCENARIO
                        TABLE 17 PESSIMISTIC SCENARIO: FUNCTIONAL FOOD INGREDIENTS MARKET SIZE, BY TYPE, 2018–2021 (USD MILLION)
     10.3 PROBIOTICS
             10.3.1 HIGH CONSUMER DEMAND FOR SCIENTIFICALLY PROVEN HEALTH FOOD AND SUPPLEMENTS, PARTICULARLY IN DEVELOPED ECONOMIES
                        TABLE 18 PROBIOTIC COMPONENTS & THEIR BENEFITS
                        TABLE 19 PROBIOTICS IN FUNCTIONAL FOOD MARKET SIZE, BY REGION, 2016–2020 (USD MILLION)
                        TABLE 20 PROBIOTICS IN FUNCTIONAL FOOD MARKET SIZE, BY REGION, 2021–2026 (USD MILLION)
                        TABLE 21 PROBIOTICS IN FUNCTIONAL FOOD MARKET SIZE, BY REGION, 2016–2020 (TONS)
                        TABLE 22 PROBIOTICS IN FUNCTIONAL FOOD MARKET SIZE, BY REGION, 2021–2026 (TONS)
     10.4 PROTEINS & AMINO ACIDS
             10.4.1 RISE IN AWARENESS ABOUT THE HEALTH BENEFITS OF AMINO ACIDS IS DRIVING THE DEMAND
                        TABLE 23 RECOMMENDED DIETARY ALLOWANCES (RDA) FOR PROTEINS IN DIFFERENT AGE GROUPS
                        TABLE 24 FUNCTIONS OF PROTEIN
                        TABLE 25 PROTEINS & AMINO ACIDS IN FUNCTIONAL FOOD INGREDIENTS MARKET SIZE, BY REGION, 2016–2020 (USD MILLION)
                        TABLE 26 PROTEINS & AMINO ACIDS IN FUNCTIONAL FOOD MARKET SIZE, BY REGION, 2021–2026 (USD MILLION)
                        TABLE 27 PROTEINS & AMINO ACIDS IN FUNCTIONAL FOOD MARKET SIZE, BY REGION, 2016–2020 (TONS)
                        TABLE 28 PROTEINS & AMINO ACIDS IN FUNCTIONAL FOOD MARKET SIZE, BY REGION, 2021–2026 (TONS)
     10.5 PHYTOCHEMICALS & PLANT EXTRACTS
             10.5.1 INCREASE IN USE OF PHYTOCHEMICALS & PLANT EXTRACTS IN NUTRACEUTICALS DUE TO SIDE EFFECTS OF CHEMICAL INGREDIENTS
                        TABLE 29 PHYTOCHEMICALS & PLANT EXTRACTS IN FUNCTIONAL FOOD MARKET SIZE, BY REGION, 2016–2020 (USD MILLION)
                        TABLE 30 PHYTOCHEMICALS & PLANT EXTRACTS IN FUNCTIONAL FOOD MARKET SIZE, BY REGION, 2021–2026 (USD MILLION)
                        TABLE 31 PHYTOCHEMICALS & PLANT EXTRACTS IN FUNCTIONAL FOOD MARKET SIZE, BY REGION, 2016–2020 (TONS)
                        TABLE 32 PHYTOCHEMICALS & PLANT EXTRACTS IN FUNCTIONAL FOOD MARKET SIZE, BY REGION, 2021–2026 (TONS)
     10.6 PREBIOTICS
             10.6.1 RAPID GROWTH IN PREBIOTICS DUE TO BENEFITS IN WEIGHT MANAGEMENT AND INFANT HEALTH IMPROVEMENT
                        TABLE 33 PREBIOTICS IN FUNCTIONAL FOOD MARKET SIZE, BY REGION, 2016–2020 (USD MILLION)
                        TABLE 34 PREBIOTICS IN FUNCTIONAL FOOD MARKET SIZE, BY REGION, 2021–2026 (USD MILLION)
                        TABLE 35 PREBIOTICS IN FUNCTIONAL FOOD MARKET SIZE, BY REGION, 2016–2020 (TONS)
                        TABLE 36 PREBIOTICS IN FUNCTIONAL FOOD MARKET SIZE, BY REGION, 2021–2026 (TONS)
                        TABLE 37 PREBIOTIC COMPONENTS & THEIR BENEFITS
                        TABLE 38 PREBIOTICS IN FUNCTIONAL FOOD MARKET SIZE, BY TYPE, 2016–2020 (USD MILLION)
                        TABLE 39 PREBIOTICS IN FUNCTIONAL FOOD MARKET SIZE, BY TYPE, 2021–2026 (USD MILLION)
     10.7 FIBERS & SPECIALTY CARBOHYDRATES
             10.7.1 FIBERS HELP IN PROMOTING HEALTH AND REDUCING THE RISK OF CHRONIC DISEASES
                        TABLE 40 FIBERS & SPECIALTY CARBOHYDRATES IN FUNCTIONAL FOOD INGREDIENTS  MARKET SIZE, BY REGION, 2016–2020 (USD MILLION)
                        TABLE 41 FIBERS & SPECIALTY CARBOHYDRATES IN FUNCTIONAL FOOD MARKET SIZE, BY REGION, 2021–2026 (USD MILLION)
                        TABLE 42 FIBERS & SPECIALTY CARBOHYDRATES IN FUNCTIONAL FOOD MARKET SIZE, BY REGION, 2016–2020 (TONS)
                        TABLE 43 FIBERS & SPECIALTY CARBOHYDRATES IN FUNCTIONAL FOOD MARKET SIZE, BY REGION, 2021–2026 (TONS)
     10.8 OMEGA-3 FATTY ACIDS
             10.8.1 OMEGA-3 FATTY ACIDS AID IN REDUCING THE RISK OF SEVERAL CHRONIC MENTAL AND PHYSICAL DISEASES
                        TABLE 44 OMEGA-3 FATTY ACIDS IN FUNCTIONAL FOOD MARKET SIZE, BY REGION, 2016–2020 (USD MILLION)
                        TABLE 45 OMEGA-3 FATTY ACIDS IN FUNCTIONAL FOOD MARKET SIZE, BY REGION, 2021–2026 (USD MILLION)
                        TABLE 46 OMEGA-3 FATTY ACIDS IN FUNCTIONAL FOOD MARKET SIZE, BY REGION, 2016–2020 (TONS)
                        TABLE 47 OMEGA-3 FATTY ACIDS IN FUNCTIONAL FOOD MARKET SIZE, BY REGION, 2021–2026 (TONS)
     10.9 CAROTENOIDS
             10.9.1 CAROTENOIDS SUCH AS LUTEIN AND ZEAXANTHIN REDUCE THE RISK OF EYE DISEASES
                        TABLE 48 COMMON DIETARY SOURCES OF CAROTENOIDS IN VEGETABLE FOODS (ΜG/100 FRESH WEIGHT)
           FIGURE 46 CLASSIFICATION OF CAROTENOIDS
                        TABLE 49 CAROTENOIDS IN FUNCTIONAL FOOD MARKET SIZE, BY REGION, 2016–2020 (USD MILLION)
                        TABLE 50 CAROTENOIDS IN FUNCTIONAL FOOD MARKET SIZE, BY REGION, 2021–2026 (USD MILLION)
                        TABLE 51 CAROTENOIDS IN FUNCTIONAL FOOD MARKET SIZE, BY REGION, 2016–2020 (TONS)
                        TABLE 52 CAROTENOIDS IN FUNCTIONAL FOOD MARKET SIZE, BY REGION, 2021–2026 (TONS)
                        TABLE 53 CAROTENOIDS IN FUNCTIONAL FOOD MARKET SIZE, BY TYPE, 2016–2020 (USD MILLION)
                        TABLE 54 CAROTENOIDS IN FUNCTIONAL FOOD MARKET SIZE, BY TYPE, 2021–2026 (USD MILLION)
     10.10 VITAMINS
             10.10.1 AWARENESS, WIDE ACCEPTANCE, AND EASY AVAILABILITY OF DIFFERENT TYPES OF VITAMINS HAVE LED TO A SURGE IN DEMAND
                        TABLE 55 VITAMINS CLASSIFIED AS MICRONUTRIENTS
                        TABLE 56 FAT-SOLUBLE & WATER-SOLUBLE VITAMINS
                        TABLE 57 VITAMINS IN FUNCTIONAL FOOD INGREDIENTS MARKET SIZE, BY REGION, 2016–2020 (USD MILLION)
                        TABLE 58 VITAMINS IN FUNCTIONAL FOOD MARKET SIZE, BY REGION, 2021–2026 (USD MILLION)
                        TABLE 59 VITAMINS IN FUNCTIONAL FOOD MARKET SIZE, BY REGION, 2016–2020 (TONS)
                        TABLE 60 VITAMINS IN FUNCTIONAL FOOD MARKET SIZE, BY REGION, 2021–2026 (TONS)
     10.11 MINERALS
             10.11.1 MINERALS PROVIDE SEVERAL HEALTH BENEFITS
             10.11.2 MACROMINERALS
             10.11.3 MICROMINERALS
                        TABLE 61 MACROMINERALS & THEIR FUNCTIONS
                        TABLE 62 MICRO MINERALS & THEIR FUNCTIONS
                        TABLE 63 MINERALS IN FUNCTIONAL FOOD MARKET SIZE, BY REGION, 2016–2020 (USD MILLION)
                        TABLE 64 MINERALS IN FUNCTIONAL FOOD MARKET SIZE, BY REGION, 2021–2026 (USD MILLION)
                        TABLE 65 MINERALS IN FUNCTIONAL FOOD MARKET SIZE, BY REGION, 2016–2020 (TONS)
                        TABLE 66 MINERALS IN FUNCTIONAL FOOD MARKET SIZE, BY REGION, 2021–2026 (TONS)

11 FUNCTIONAL FOOD INGREDIENTS MARKET, BY SOURCE (Page No. - 150)
     11.1 INTRODUCTION
             FIGURE 47 MARKET SHARE (VALUE), BY SOURCE, 2021 VS. 2026
             TABLE 67 MARKET SIZE, BY SOURCE, 2016–2020 (USD MILLION)
             TABLE 68 MARKET SIZE, BY SOURCE, 2021–2026 (USD MILLION)
     11.2 NATURAL SOURCE
             11.2.1 INCREASE IN CONSUMER EMPHASIS ON NATURAL FOODS AND RE-USE OF FOOD WASTES AS SOURCES FOR FUNCTIONAL INGREDIENTS
                        FIGURE 48 MAJOR SOURCES OF FOOD WASTES, 2017
                        TABLE 69 NATURAL MARKET SIZE, BY TYPE, 2016–2020 (USD MILLION)
                        TABLE 70 NATURAL MARKET SIZE, BY TYPE, 2021–2026 (USD MILLION)
                        TABLE 71 NATURAL MARKET SIZE, BY REGION, 2016–2020 (USD MILLION)
                        TABLE 72 NATURAL MARKET SIZE, BY REGION, 2021–2026 (USD MILLION)
             11.2.2 ANIMAL
             11.2.3 MICROBIAL
             11.2.4 PLANT
     11.3 SYNTHETIC SOURCE
             11.3.1 RISE IN CONCERNS ON GUT HEALTH DRIVE THE DEMAND FOR BIOTECHNOLOGICALLY PRODUCED PREBIOTIC AND PROBIOTICS
             11.3.2 VITAMINS
             11.3.3 PHYTOCHEMICALS
             11.3.4 AMINO ACIDS
             11.3.5 CAROTENOIDS
                        TABLE 73 SYNTHETIC MARKET SIZE, BY REGION, 2016–2020 (USD MILLION)
                        TABLE 74 SYNTHETIC MARKET SIZE, BY REGION, 2021–2026 (USD MILLION)

12 FUNCTIONAL FOOD INGREDIENTS MARKET, BY APPLICATION (Page No. - 158)
     12.1 INTRODUCTION
             FIGURE 49 MARKET SHARE (VALUE), BY APPLICATION, 2021 VS. 2026
             TABLE 75 MARKET SIZE, BY APPLICATION, 2016–2020 (USD MILLION)
             TABLE 76 MARKET SIZE, BY APPLICATION, 2021–2026 (USD MILLION)
     12.2 COVID-19 IMPACT ON THE MARKET, BY APPLICATION
             12.2.1 OPTIMISTIC SCENARIO
                        TABLE 77 OPTIMISTIC SCENARIO: MARKET SIZE, BY APPLICATION, 2018–2021 (USD MILLION)
             12.2.2 REALISTIC SCENARIO
                        TABLE 78 REALISTIC SCENARIO: MARKET SIZE, BY APPLICATION, 2018–2021 (USD MILLION)
             12.2.3 PESSIMISTIC SCENARIO
                        TABLE 79 PESSIMISTIC SCENARIO: MARKET SIZE, BY APPLICATION, 2018–2021 (USD MILLION)
     12.3 FOOD
             12.3.1 COST-EFFECTIVE FOOD PRODUCTS WITH HIGH NUTRITIONAL BENEFITS TEND TO DRIVE THE MARKET
                        TABLE 80 MARKET SIZE IN FOOD, BY SUBAPPLICATION, 2016–2020 (USD MILLION)
                        TABLE 81 MARKET SIZE IN FOOD, BY SUBAPPLICATION, 2021–2026 (USD MILLION)
                        TABLE 82 FUNCTIONAL FOOD INGREDIENTS MARKET SIZE IN FOOD, BY REGION, 2016–2020 (USD MILLION)
                        TABLE 83 MARKET SIZE IN FOOD, BY REGION, 2021–2026 (USD MILLION)
             12.3.2 INFANT FOOD
                        TABLE 84 RECOMMENDED DIETARY REFERENCE INTAKES (DRIS) FOR MACRONUTRIENTS
                        TABLE 85 RECOMMENDED DIETARY REFERENCE INTAKES (DRI’S) FOR MICRONUTRIENTS
             12.3.3 DAIRY PRODUCTS
             12.3.4 BAKERY PRODUCTS
             12.3.5 CONFECTIONERY PRODUCTS
             12.3.6 SNACKS
             12.3.7 MEAT & MEAT PRODUCTS
                        FIGURE 50 GLOBAL MEAT PRODUCTION, 2000–2018 (MILLION TONNES)
             12.3.8 OTHER TYPES
                        FIGURE 51 GLOBALLY RISING IMPORTS AND EXPORTS OF CEREALS AND CEREAL PRODUCTS, 2016–2020
     12.4 BEVERAGES
             12.4.1 HEALTH BEVERAGES AND DRINKS DEMAND DRIVE GROWTH FOR FUNCTIONAL JUICES AND BEVERAGES
                        TABLE 86 MARKET SIZE IN BEVERAGES, BY SUBAPPLICATION, 2016–2020 (USD MILLION)
                        TABLE 87 MARKET SIZE IN BEVERAGES, BY SUBAPPLICATION, 2021–2026 (USD MILLION)
                        TABLE 88 MARKET SIZE IN BEVERAGES, BY REGION, 2016–2020 (USD MILLION)
                        TABLE 89 MARKET SIZE IN BEVERAGES, BY REGION, 2021–2026 (USD MILLION)
             12.4.2 ENERGY DRINKS
             12.4.3 JUICES
             12.4.4 HEALTH DRINKS

13 FUNCTIONAL FOOD INGREDIENTS, BY REGION (Page No. - 171)
     13.1 INTRODUCTION
             TABLE 90 MARKET SIZE, BY REGION, 2016–2020 (USD MILLION)
             TABLE 91 MARKET SIZE, BY REGION, 2021–2026 (USD MILLION)
             FIGURE 52 REGIONAL SNAPSHOT: THE US HELD THE LARGEST SHARE OF THE FUNCTIONAL FOOD INGREDIENTS MARKET, 2020
     13.2 COVID-19 IMPACT ON THE MARKET, BY REGION
             13.2.1 OPTIMISTIC SCENARIO
                        TABLE 92 OPTIMISTIC SCENARIO: COVID-19 IMPACT ON THE MARKET SIZE, BY REGION, 2018–2021 (USD MILLION)
             13.2.2 REALISTIC SCENARIO
                        TABLE 93 REALISTIC SCENARIO: COVID-19 IMPACT ON THE MARKET SIZE, BY REGION, 2018–2021 (USD MILLION)
             13.2.3 PESSIMISTIC SCENARIO
                        TABLE 94 PESSIMISTIC SCENARIO: COVID-19 IMPACT ON THE MARKET, BY REGION, 2018–2021 (USD MILLION)
     13.3 NORTH AMERICA
             FIGURE 53 NORTH AMERICA: MARKET SNAPSHOT
             TABLE 95 NORTH AMERICA: MARKET SIZE, BY COUNTRY, 2016–2020 (USD MILLION)
             TABLE 96 NORTH AMERICA: MARKET SIZE, BY COUNTRY, 2021–2026 (USD MILLION)
             TABLE 97 NORTH AMERICA: MARKET SIZE, BY TYPE, 2016–2020 (USD MILLION)
             TABLE 98 NORTH AMERICA: MARKET SIZE, BY TYPE, 2021–2026 (USD MILLION)
             TABLE 99 NORTH AMERICA: MARKET SIZE, BY TYPE, 2016–2020 (TONS)
             TABLE 100 NORTH AMERICA: MARKET SIZE, BY TYPE, 2021–2026 (TONS)
             TABLE 101 NORTH AMERICA: MARKET SIZE, BY SOURCE, 2016–2020 (USD MILLION)
             TABLE 102 NORTH AMERICA: MARKET SIZE, BY SOURCE, 2021–2026 (USD MILLION)
             TABLE 103 NORTH AMERICA: FUNCTIONAL FOOD INGREDIENTS MARKET SIZE, BY APPLICATION, 2016–2020 (USD MILLION)
             TABLE 104 NORTH AMERICA: MARKET SIZE, BY APPLICATION, 2021–2026 (USD MILLION)
             13.3.1 US
                        13.3.1.1 Presence of key players and increase in obesity among people estimated to drive the market growth
                                     TABLE 105 US: MARKET SIZE, BY TYPE, 2016–2020 (USD MILLION)
                                     TABLE 106 US: MARKET SIZE, BY TYPE, 2021–2026 (USD MILLION)
             13.3.2 CANADA
                        13.3.2.1 Supportive government policies and rise in consumer awareness fueling the market growth
                                     TABLE 107 CANADA: APPROVED INFANT FORMULAS, 2019
                                     TABLE 108 CANADA: MARKET SIZE, BY TYPE, 2016–2020 (USD MILLION)
                                     TABLE 109 CANADA: MARKET SIZE, BY TYPE, 2021–2026 (USD MILLION)
             13.3.3 MEXICO
                        13.3.3.1 Rise in per capita expenditure on nutritious and healthy foods is estimated to boost the market
                                     FIGURE 54 MEXICO: PER CAPITA EXPENDITURE ON FOOD, 2010–2018
                                     TABLE 110 MEXICO: MARKET SIZE, BY TYPE, 2016–2020 (USD MILLION)
                                     TABLE 111 MEXICO: MARKET SIZE, BY TYPE, 2021–2026 (USD MILLION)
     13.4 EUROPE
             TABLE 112 EUROPE: FUNCTIONAL FOOD INGREDIENTS MARKET SIZE, BY COUNTRY, 2016–2020 (USD MILLION)
             TABLE 113 EUROPE: MARKET SIZE, BY COUNTRY, 2021–2026 (USD MILLION)
             TABLE 114 EUROPE: MARKET SIZE, BY TYPE, 2016–2020 (USD MILLION)
             TABLE 115 EUROPE: MARKET SIZE, BY TYPE, 2021–2026 (USD MILLION)
             TABLE 116 EUROPE: MARKET SIZE, BY TYPE, 2016–2020 (TONS)
             TABLE 117 EUROPE: MARKET SIZE, BY TYPE, 2021–2026 (TONS)
             TABLE 118 EUROPE: MARKET SIZE, BY SOURCE, 2016–2020 (USD MILLION)
             TABLE 119 EUROPE: MARKET SIZE, BY SOURCE, 2021–2026 (USD MILLION)
             TABLE 120 EUROPE: MARKET SIZE, BY APPLICATION, 2016–2020 (USD MILLION)
             TABLE 121 EUROPE: MARKET SIZE, BY APPLICATION, 2021–2026 (USD MILLION)
             13.4.1 UK
                        13.4.1.1 Consumers’ high awareness of various functional ingredients and other wellness ingredients
                                     TABLE 122 UK: MARKET SIZE, BY TYPE, 2016–2020 (USD MILLION)
                                     TABLE 123 UK: MARKET SIZE, BY TYPE, 2021–2026 (USD MILLION)
             13.4.2 FRANCE
                        13.4.2.1 Preference for better eating habits resulted in the adoption of alternatives, especially among women
                                     TABLE 124 FRANCE: MARKET SIZE, BY TYPE, 2016–2020 (USD MILLION)
                                     TABLE 125 FRANCE: MARKET SIZE, BY TYPE, 2021–2026 (USD MILLION)
             13.4.3 GERMANY
                        13.4.3.1 Manufacturers are constantly improving their products with newer technology and innovations
                                     TABLE 126 GERMANY: FUNCTIONAL FOOD INGREDIENTS MARKET SIZE, BY TYPE, 2016–2020 (USD MILLION)
                                     TABLE 127 GERMANY: MARKET SIZE, BY TYPE, 2021–2026 (USD MILLION)
             13.4.4 ITALY
                        13.4.4.1 Stringent quality control mandates for functional food ingredients such as omega-3 and folic acid hindered market growth
                                     TABLE 128 ITALY: MARKET SIZE, BY TYPE,2016–2020 (USD MILLION)
                                     TABLE 129 ITALY: MARKET SIZE, BY TYPE, 2021–2026 (USD MILLION)
             13.4.5 SPAIN
                        13.4.5.1 The most popular products in the country are those fortified with fiber, probiotic bacteria, omega-3 acids, folic acids, calcium, and vitamins A and D
                                     TABLE 130 SPAIN: MARKET SIZE, BY TYPE, 2016–2020 (USD MILLION)
                                     TABLE 131 SPAIN: MARKET SIZE, BY TYPE, 2021–2026 (USD MILLION)
             13.4.6 RUSSIA
                        13.4.6.1 Lack of government initiatives to promote the consumption of functional food hindered the growth
                                     TABLE 132 RUSSIA: MARKET SIZE, BY TYPE, 2016–2020 (USD MILLION)
                                     TABLE 133 RUSSIA: MARKET SIZE, BY TYPE, 2021–2026 (USD MILLION)
             13.4.7 REST OF EUROPE
                        TABLE 134 REST OF EUROPE: MARKET SIZE, BY TYPE, 2016–2020 (USD MILLION)
                        TABLE 135 REST OF EUROPE: MARKET SIZE, BY TYPE, 2021–2026 (USD MILLION)
     13.5 ASIA PACIFIC
             TABLE 136 ASIA PACIFIC: MARKET SIZE, BY COUNTRY, 2016–2020 (USD MILLION)
             TABLE 137 ASIA PACIFIC: MARKET SIZE, BY COUNTRY, 2021–2026 (USD MILLION)
             TABLE 138 ASIA PACIFIC: FUNCTIONAL FOOD INGREDIENTS MARKET SIZE, BY TYPE, 2016–2020 (USD MILLION)
             TABLE 139 ASIA PACIFIC: MARKET SIZE, BY TYPE, 2021–2026 (USD MILLION)
             TABLE 140 ASIA PACIFIC: MARKET SIZE, BY TYPE, 2016–2020 (TONS)
             TABLE 141 ASIA PACIFIC: MARKET SIZE, BY TYPE, 2021–2026 (TONS)
             TABLE 142 ASIA PACIFIC: MARKET SIZE, BY SOURCE, 2016–2020 (USD MILLION)
             TABLE 143 ASIA PACIFIC: MARKET SIZE, BY SOURCE, 2021–2026 (USD MILLION)
             TABLE 144 ASIA PACIFIC: MARKET SIZE, BY APPLICATION, 2016–2020 (USD MILLION)
             TABLE 145 ASIA PACIFIC: MARKET SIZE, BY APPLICATION, 2021–2026 (USD MILLION)
             13.5.1 CHINA
                        13.5.1.1 Changing lifestyles of consumers and preference for fortified food & beverage products drive the market in China
                                     TABLE 146 CHINA: MARKET SIZE, BY TYPE, 2016–2020 (USD MILLION)
                                     TABLE 147 CHINA: MARKET SIZE, BY TYPE, 2021–2026 (USD MILLION)
             13.5.2 JAPAN
                        13.5.2.1 Changes in consumer behavior are projected to drive the market growth in the country
                                     TABLE 148 JAPAN: MARKET SIZE, BY TYPE, 2016–2020 (USD MILLION)
                                     TABLE 149 JAPAN: MARKET SIZE, BY TYPE, 2021–2026 (USD MILLION)
             13.5.3 INDIA
                        13.5.3.1 Rise in hospitalization cost drives consumer demand for ingredients such as vitamins and minerals
                                     TABLE 150 INDIA: MARKET SIZE, BY TYPE, 2016–2020 (USD MILLION))
                                     TABLE 151 INDIA: FUNCTIONAL FOOD INGREDIENTS MARKET SIZE, BY TYPE, 2021–2026 (USD MILLION)
             13.5.4 AUSTRALIA
                        13.5.4.1 Consumers prefer spending on nutritional food products such as low-calorie and health products
                                     TABLE 152 AUSTRALIA: MARKET SIZE, BY TYPE, 2016–2020 (USD MILLION)
                                     TABLE 153 AUSTRALIA: MARKET SIZE, BY TYPE, 2021–2026 (USD MILLION)
             13.5.5 REST OF ASIA PACIFIC
                        TABLE 154 REST OF ASIA PACIFIC: MARKET SIZE, BY TYPE, 2016–2020 (USD MILLION)
                        TABLE 155 REST OF ASIA PACIFIC: MARKET SIZE, BY TYPE, 2021–2026 (USD MILLION)
     13.6 SOUTH AMERICA
             FIGURE 55 SOUTH AMERICA: MARKET SNAPSHOT
             TABLE 156 SOUTH AMERICA: MARKET SIZE, BY COUNTRY, 2016–2020 (USD MILLION)
             TABLE 157 SOUTH AMERICA: MARKET SIZE, BY COUNTRY, 2021–2026 (USD MILLION)
             TABLE 158 SOUTH AMERICA: MARKET SIZE, BY TYPE, 2016–2020 (USD MILLION)
             TABLE 159 SOUTH AMERICA: MARKET SIZE, BY TYPE, 2021–2026 (USD MILLION)
             TABLE 160 SOUTH AMERICA: MARKET SIZE, BY TYPE, 2016–2020 (TONS)
             TABLE 161 SOUTH AMERICA: FUNCTIONAL FOOD INGREDIENTS MARKET SIZE, BY TYPE, 2021–2026 (TONS)
             TABLE 162 SOUTH AMERICA: MARKET SIZE, BY SOURCE, 2016–2020 (USD MILLION)
             TABLE 163 SOUTH AMERICA: MARKET SIZE, BY SOURCE, 2021–2026 (USD MILLION)
             TABLE 164 SOUTH AMERICA: MARKET SIZE, BY APPLICATION, 2016–2020 (USD MILLION)
             TABLE 165 SOUTH AMERICA: MARKET SIZE, BY APPLICATION, 2021–2026 (USD MILLION)
             13.6.1 BRAZIL
                        13.6.1.1 The availability of rich natural sources expected to drive the production of quality functional food ingredients
                                     TABLE 166 BRAZIL: MARKET SIZE, BY TYPE, 2016–2020 (USD MILLION)
                                     TABLE 167 BRAZIL: MARKET SIZE, BY TYPE, 2021–2026 (USD MILLION)
             13.6.2 ARGENTINA
                        13.6.2.1 Steady rise of undernourishment in the recent past estimated to drive the demand for functional foods
                                     FIGURE 56 PREVALENCE OF UNDERNOURISHMENT IN ARGENTINA, 2012–2019
                                     TABLE 168 ARGENTINA: MARKET SIZE, BY TYPE, 2016–2020 (USD MILLION)
                                     TABLE 169 ARGENTINA: MARKET SIZE, BY TYPE, 2021–2026 (USD MILLION)
             13.6.3 REST OF SOUTH AMERICA
                        TABLE 170 REST OF SOUTH AMERICA: MARKET SIZE, BY TYPE, 2016–2020 (USD MILLION)
                        TABLE 171 REST OF SOUTH AMERICA: MARKET SIZE, BY TYPE, 2021–2026 (USD MILLION)
     13.7 REST OF THE WORLD (ROW)
             FIGURE 57 ROW: RISING PER CAPITA FOOD EXPENDITURE, BY KEY COUNTRY, 2012–2018 (USD)
             TABLE 172 ROW: FUNCTIONAL FOOD INGREDIENTS MARKET SIZE, BY REGION, 2016–2020 (USD MILLION)
             TABLE 173 ROW: MARKET SIZE, BY REGION, 2021–2026 (USD MILLION)
             TABLE 174 ROW: MARKET SIZE, BY TYPE, 2016–2020 (USD MILLION)
             TABLE 175 ROW: MARKET SIZE, BY TYPE, 2021–2026 (USD MILLION)
             TABLE 176 ROW: MARKET SIZE, BY TYPE, 2016–2020 (TONS)
             TABLE 177 ROW: MARKET SIZE, BY TYPE, 2021–2026 (TONS)
             TABLE 178 ROW: MARKET SIZE, BY SOURCE, 2016–2020 (USD MILLION)
             TABLE 179 ROW: MARKET SIZE, BY SOURCE, 2021–2026 (USD MILLION)
             TABLE 180 ROW: MARKET SIZE, BY APPLICATION, 2016–2020 (USD MILLION)
             TABLE 181 ROW: MARKET SIZE, BY APPLICATION, 2021–2026 (USD MILLION)
             13.7.1 MIDDLE EAST
                        13.7.1.1 Increase in influence of Western culture and unhealthy lifestyles estimated to drive demand for functional foods
                                     TABLE 182 MIDDLE EAST: MARKET SIZE, BY TYPE, 2016–2020 (USD MILLION)
                                     TABLE 183 MIDDLE EAST: MARKET SIZE, BY TYPE, 2021–2026 (USD MILLION)
             13.7.2 AFRICA
                        13.7.2.1 Rise in disease burden due to micronutrient deficiencies is driving the significance of functional foods
                                     TABLE 184 AFRICA: MARKET SIZE, BY TYPE, 2016–2020 (USD MILLION)
                                     TABLE 185 AFRICA: MARKET SIZE, BY TYPE, 2021–2026 (USD MILLION)

14 COMPETITIVE LANDSCAPE (Page No. - 234)
     14.1 OVERVIEW
     14.2 MARKET SHARE ANALYSIS
             TABLE 186 FUNCTIONAL FOOD INGREDIENTS MARKET: DEGREE OF COMPETITION
     14.3 KEY PLAYER STRATEGIES
     14.4 HISTORICAL REVENUE ANALYSIS OF KEY PLAYERS
             FIGURE 58 FIVE-YEAR TOTAL REVENUE ANALYSIS OF KEY PLAYERS IN THE MARKET, 2015–2019 (USD BILLION)
     14.5 COVID-19-SPECIFIC COMPANY RESPONSE
             14.5.1 CARGILL, INCORPORATED
             14.5.2 BASF SE
             14.5.3 ARCHER DANIELS MIDLAND COMPANY
             14.5.4 DUPONT
             14.5.5 KERRY GROUP
             14.5.6 AJINOMOTO CO., INC.
             14.5.7 INGREDION INCORPORATED
             14.5.8 TATE & LYLE PLC
             14.5.9 KEMIN INDUSTRIES
             14.5.10 ROQUETTE FRÈRES
     14.6 COMPANY EVALUATION QUADRANT (KEY PLAYERS)
             14.6.1 STARS
             14.6.2 EMERGING LEADERS
             14.6.3 PERVASIVE PLAYERS
             14.6.4 PARTICIPANTS
                        FIGURE 59 FUNCTIONAL FOOD INGREDIENTS MARKET: COMPANY EVALUATION QUADRANT, 2020 (KEY PLAYERS)
     14.7 PRODUCT FOOTPRINT
           TABLE 187 COMPANY TYPE FOOTPRINT
           TABLE 188 COMPANY APPLICATION FOOTPRINT
           TABLE 189 COMPANY REGION FOOTPRINT
           TABLE 190 COMPANY PRODUCT FOOTPRINT
     14.8 COMPETITIVE EVALUATION QUADRANT (OTHER PLAYERS)
             14.8.1 PROGRESSIVE COMPANIES
             14.8.2 STARTING BLOCKS
             14.8.3 RESPONSIVE COMPANIES
             14.8.4 DYNAMIC COMPANIES
                        FIGURE 60 FUNCTIONAL FOOD INGREDIENTS MARKET: COMPANY EVALUATION QUADRANT, 2020 (OTHER PLAYERS)
     14.9 COMPETITIVE SCENARIO
             14.9.1 NEW PRODUCT LAUNCHES
                        TABLE 191 MARKET: NEW PRODUCT LAUNCHES, APRIL 2017–MAY 2021
             14.9.2 DEALS
                        TABLE 192 MARKET: DEALS, JANUARY 2017–APRIL 2021
             14.9.3 OTHERS
                        TABLE 193 MARKET: EXPANSIONS,APRIL 2017–MAY 2021

15 COMPANY PROFILES (Page No. - 253)
 (Business overview, Products offered, Recent developments & MnM View)* 
     15.1 KEY PLAYERS
             15.1.1 CARGILL, INCORPORATED
                        TABLE 194 CARGILL, INCORPORATED: BUSINESS OVERVIEW
                        FIGURE 61 CARGILL, INCORPORATED: COMPANY SNAPSHOT
                        TABLE 195 CARGILL, INCORPORATED: PRODUCTS OFFERED
                        TABLE 196 MARKET: PRODUCT LAUNCHES, MAY 2021
                        TABLE 197 MARKET: DEALS, JANUARY 2017–FEBRUARY 2021
                        TABLE 198 MARKET: OTHERS, NOVEMBER 2017–OCTOBER 2019
             15.1.2 BASF SE
                        TABLE 199 BASF SE: BUSINESS OVERVIEW
                        FIGURE 62 BASF SE: COMPANY SNAPSHOT
                        TABLE 200 BASF SE: PRODUCTS OFFERED
                        TABLE 201 FUNCTIONAL FOOD INGREDIENTS MARKET: PRODUCT LAUNCHES, AUGUST 2018
                        TABLE 202 MARKET: DEALS, APRIL 2021
             15.1.3 ARCHER DANIELS MIDLAND COMPANY
                        TABLE 203 ARCHER DANIELS MIDLAND COMPANY: BUSINESS OVERVIEW
                        FIGURE 63 ARCHER DANIELS MIDLAND COMPANY: COMPANY SNAPSHOT
                        TABLE 204 ARCHER DANIELS MIDLAND COMPANY: PRODUCTS OFFERED
                        TABLE 205 MARKET: PRODUCT LAUNCHES, APRIL 2017–SEPTEMBER 2020
                        TABLE 206 MARKET: DEALS, NOVEMBER 2020
                        TABLE 207 MARKET: OTHERS, JANUARY 2018–MAY 2021
             15.1.4 DUPONT
                        TABLE 208 DUPONT: BUSINESS OVERVIEW
                        FIGURE 64 DUPONT: COMPANY SNAPSHOT
                        TABLE 209 DUPONT: PRODUCTS OFFERED
                        TABLE 210 MARKET: PRODUCT LAUNCHES, MAY 2017
                        TABLE 211 MARKET: DEALS, DECEMBER 2019
             15.1.5 ARLA FOODS
                        TABLE 212 ARLA FOODS: BUSINESS OVERVIEW
                        FIGURE 65 ARLA FOODS: COMPANY SNAPSHOT
                        TABLE 213 ARLA FOODS: PRODUCTS OFFERED
                        TABLE 214 MARKET: DEALS, DECEMBER 2017–OCTOBER 2018
             15.1.6 KERRY GROUP
                        TABLE 215 KERRY GROUP: BUSINESS OVERVIEW
                        FIGURE 66 KERRY GROUP: COMPANY SNAPSHOT
                        TABLE 216 KERRY GROUP: PRODUCTS OFFERED
                        TABLE 217 MARKET: OTHERS, MAY 2021
             15.1.7 AJINOMOTO CO., INC.
                        TABLE 218 AJINOMOTO CO., INC.: BUSINESS OVERVIEW
                        FIGURE 67 AJINOMOTO CO., INC.: COMPANY SNAPSHOT
                        TABLE 219 AJINOMOTO CO., INC.: PRODUCTS OFFERED
                        TABLE 220 MARKET: DEALS, APRIL 2017
             15.1.8 KONINKLIJKE DSM N.V.
                        TABLE 221 KONINKLIJKE DSM N.V.: BUSINESS OVERVIEW
                        FIGURE 68 KONINKLIJKE DSM N.V.: COMPANY SNAPSHOT
                        TABLE 222 KONINKLIJKE DSM N.V.: PRODUCTS OFFERED
                        TABLE 223 MARKET: DEALS, DECEMBER 2017
                        TABLE 224 FUNCTIONAL FOOD INGREDIENTS MARKET: OTHERS, APRIL 2017
             15.1.9 INGREDION INCORPORATED
                        TABLE 225 INGREDION INCORPORATED: BUSINESS OVERVIEW
                        FIGURE 69 INGREDION INCORPORATED: COMPANY SNAPSHOT
                        TABLE 226 INGREDION INCORPORATED: PRODUCTS OFFERED
                        TABLE 227 MARKET: DEALS, FEBRUARY 2021
             15.1.10 TATE & LYLE PLC
                        TABLE 228 TATE & LYLE PLC: BUSINESS OVERVIEW
                        FIGURE 70 TATE & LYLE PLC: COMPANY SNAPSHOT
                        TABLE 229 TATE & LYLE PLC: PRODUCTS OFFERED
                        TABLE 230 MARKET: NEW PRODUCT LAUNCHES, MAY 2021
                        TABLE 231 MARKET: DEALS, JUNE 2020
     15.2 OTHER PLAYERS
             15.2.1 CHR. HANSEN HOLDING A/S
                        TABLE 232 CHR. HANSEN HOLDING A/S: BUSINESS OVERVIEW
                        FIGURE 71 CHR. HANSEN HOLDING A/S: COMPANY SNAPSHOT
                        TABLE 233 CHR. HANSEN HOLDING A/S: PRODUCTS OFFERED
                        TABLE 234 MARKET: PRODUCT LAUNCHES, NOVEMBER 2020
                        TABLE 235 MARKET: DEALS, APRIL 2020–JUNE 2020
             15.2.2 KEMIN INDUSTRIES, INC.
                        TABLE 236 KEMIN INDUSTRIES, INC.: BUSINESS OVERVIEW
                        TABLE 237 KEMIN INDUSTRIES, INC.: PRODUCTS OFFERED
                        TABLE 238 FUNCTIONAL FOOD INGREDIENTS MARKET: PRODUCT LAUNCHES, DECEMBER 2020–APRIL 2021
             15.2.3 BENEO
                        TABLE 239 BENEO: BUSINESS OVERVIEW
                        TABLE 240 BENEO: PRODUCTS OFFERED
                        TABLE 241 MARKET: OTHERS, MARCH 2020
             15.2.4 ROYAL COSUN
                        TABLE 242 ROYAL COSUN: BUSINESS OVERVIEW
                        FIGURE 72 ROYAL COSUN: COMPANY SNAPSHOT
                        TABLE 243 ROYAL COSUN: PRODUCTS OFFERED
             15.2.5 ROQUETTE FRÈRES
                        TABLE 244 ROQUETTE FRÈRES: BUSINESS OVERVIEW
                        TABLE 245 ROQUETTE FRÈRES: PRODUCTS OFFERED
                        TABLE 246 MARKET: PRODUCT LAUNCHES, MAY 2020–JANUARY 2021
                        TABLE 247 MARKET: OTHERS, SEPTEMBER 2017–JUNE 2020
             15.2.6 SOYLENT
             15.2.7 A&B INGREDIENTS
             15.2.8 GOLDEN GRAIN GROUP LIMITED
             15.2.9 SUGARLOGIX
             15.2.10 STRATUM NUTRITION
*Details on Business overview, Products offered, Recent developments & MnM View might not be captured in case of unlisted companies. 

16 ADJACENT & RELATED MARKETS OF FUNCTIONAL FOOD INGREDIENTS MARKET(Page No. - 310)

     16.1 INTRODUCTION
     16.2 LIMITATIONS
     16.3 SPECIALTY FOOD INGREDIENTS MARKET
             16.3.1 MARKET DEFINITION
             16.3.2 MARKET OVERVIEW
             16.3.3 SPECIALTY FOOD INGREDIENTS MARKET, BY DISTRIBUTION CHANNEL
                        16.3.3.1 Introduction
                                     TABLE 248 SPECIALTY FOOD INGREDIENTS MARKET SIZE, BY DISTRIBUTION CHANNEL, 2018–2025 (USD MILLION)
                        16.3.3.2 Distributors
                                     TABLE 249 SPECIALTY FOOD INGREDIENT DISTRIBUTORS MARKET SIZE, BY REGION, 2018–2025 (USD MILLION)
                        16.3.3.3 Manufacturers
                                     TABLE 250 SPECIALTY FOOD INGREDIENT MANUFACTURERS MARKET SIZE, BY REGION, 2018–2025 (USD MILLION)
     16.4 NUTRACEUTICAL INGREDIENTS MARKET
             16.4.1 LIMITATIONS
             16.4.2 MARKET DEFINITION
             16.4.3 MARKET OVERVIEW
             16.4.4 NUTRACEUTICAL INGREDIENTS MARKET, BY TYPE
                        TABLE 251 NUTRACEUTICAL INGREDIENTS MARKET SIZE, BY TYPE, 2020–2025 (USD MILLION)
             16.4.5 NUTRACEUTICAL INGREDIENTS MARKET, BY REGION
                        16.4.5.1 Introduction
                                     TABLE 252 NUTRACEUTICAL INGREDIENTS MARKET SIZE, BY REGION, 2020–2025 (USD MILLION)

17 APPENDIX (Page No. - 317)
     17.1 DISCUSSION GUIDE
     17.2 KNOWLEDGE STORE: MARKETSANDMARKETS’ SUBSCRIPTION PORTAL
     17.3 AVAILABLE CUSTOMIZATIONS
     17.4 RELATED REPORTS
     17.5 AUTHOR DETAILS

The study involved four major activities in estimating the size of functional food ingredients market. Exhaustive secondary research was conducted to collect information on the market, peer market, and parent market. The next step was to validate these findings, assumptions, and sizing with industry experts across the value chain through primary research. Both the top-down and bottom-up approaches were employed to estimate the complete market size. Thereafter, market breakdown and data triangulation were used to estimate the market size of segments and subsegments.

Secondary Research

In the secondary research process, various sources were referred to, to identify and collect information for this study. These sources included annual reports, press releases and investor presentations of companies, white papers, certified publications, articles from recognized authors, gold standard and silver standard websites, regulatory bodies, trade directories, and databases.

Secondary research was mainly used to obtain key information about the industry’s supply chain, the total pool of key players, market classification & segmentation according to industry trends to the bottom-most level, and geographical markets. It was also used to obtain information on the key developments from a market-oriented perspective.

Primary Research

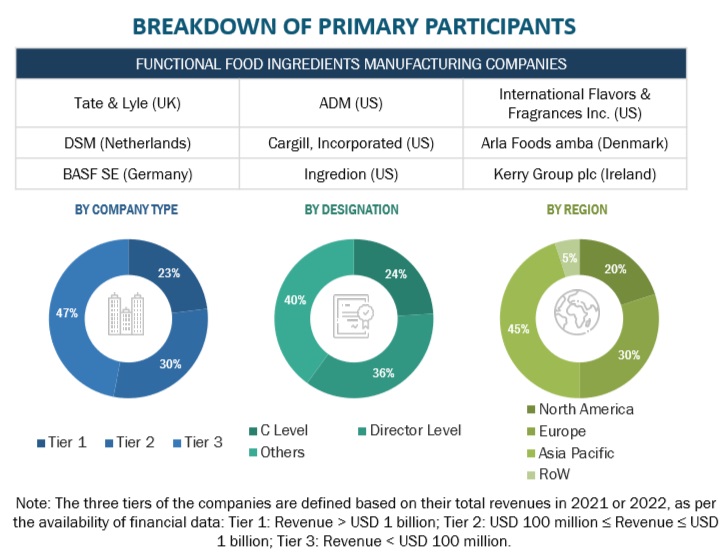
The functional food ingredients market comprises several stakeholders such as raw material suppliers, processors, end-product manufacturers, and regulatory organizations in the supply chain. The demand side of this market is characterized by the development of the functional food and food fortification industries and the rise in population. The supply side is characterized by advancements in technology and diverse application industries. Various primary sources from both, supply and demand sides of the market were interviewed to obtain qualitative and quantitative information.

The primary interviewees from the demand side include key opinion leaders, executives, vice presidents, and CEOs of the food & beverage industry. The primary sources from the supply side include research institutions involved in R&D to introduce new technologies, key opinion leaders, distributors, and functional food ingredient manufacturers.

Functional Food Ingredients Market Size, and Share

To know about the assumptions considered for the study, download the pdf brochure

Functional Food Ingredients Market Size Estimation

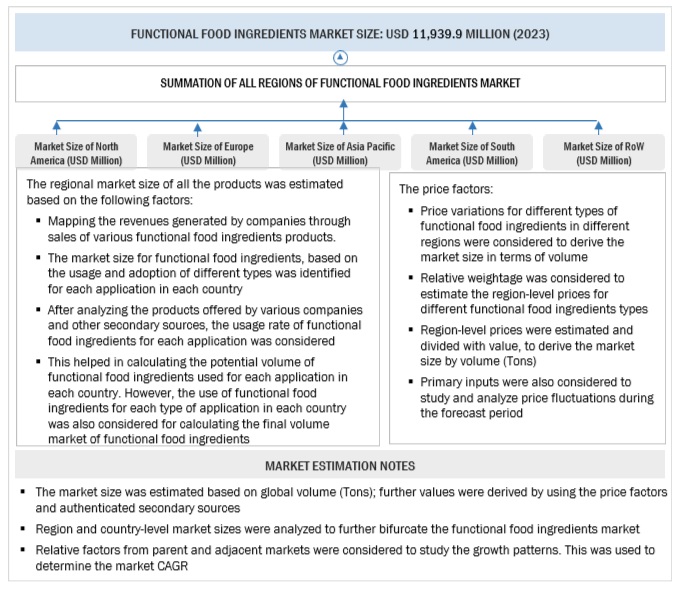
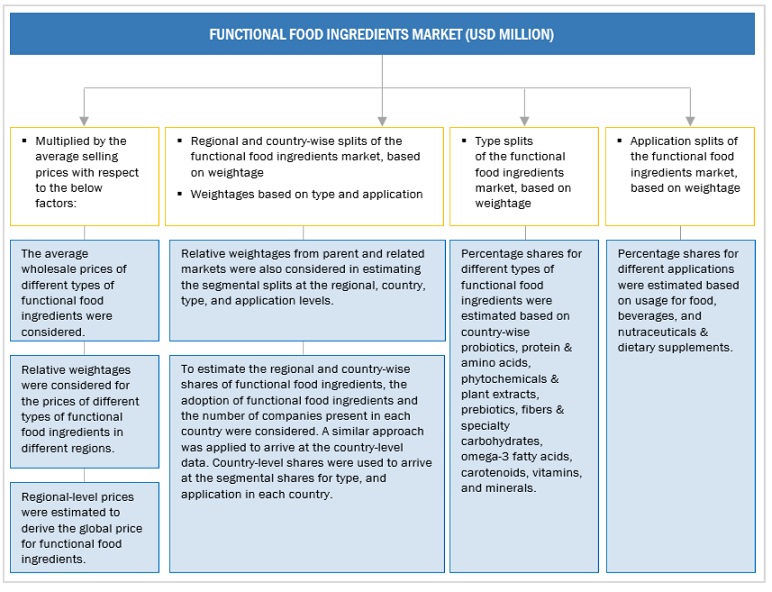
Both the top-down and bottom-up approaches have been used to estimate and validate the total size of the market. These approaches have also been used extensively to determine the size of the various sub-segments in the market. The research methodology used to estimate the market size includes the following details:

  • The key players in the industry and market have been identified through extensive secondary research.
  • The functional food ingredients value chain and market size in terms of both value and volume have been determined through primary and secondary research.
  • All percentage shares, splits, and breakdowns were determined using secondary sources and verified through primary sources.
  • All macroeconomic and microeconomic factors affecting the growth of the functional food ingredients market were considered while estimating the market size.
  • All the possible parameters that affect the market covered in this research study have been accounted for, viewed in extensive detail, verified through primary research, and analyzed to obtain the final quantitative and qualitative data.

Data Triangulation

After arriving at the overall market size from the estimation process explained above, the total market was split into several segments and subsegments. To complete the overall market engineering process and arrive at the most precise estimations for all segments and sub-segments, the data triangulation and market breakdown procedures were employed wherever applicable. The data was triangulated by studying various factors and trends from the demand and supply sides. Along with this, the market size was validated using the top-down and bottom-up approaches.

Report Objectives

  • To describe and forecast the functional food ingredients market based on types, sources, and applications
  • To describe and forecast the market, in terms of value, by regions—Asia Pacific, Europe, North America, South America, and the Rest of the World—along with their respective countries
  • To provide detailed information regarding the major factors influencing the market growth (drivers, restraints, opportunities, and challenges)
  • To strategically analyze micro markets, with respect to individual growth trends, prospects, and contributions to the overall market
  • To study the complete value chain of food ingredients
  • To analyze opportunities in the market for stakeholders by identifying the high-growth segments of the food ingredients ecosystem
  • To strategically profile key players and comprehensively analyze their market positions in terms of ranking and core competencies, along with detailing the competitive landscape for market leaders
  • To analyze strategic approaches such as acquisitions and divestments; expansions and investments; product launches and approvals; agreements; and collaborations and partnerships in the market

Available Customizations

With the given market data, MarketsandMarkets offers customizations according to company-specific scientific needs.

The following customization options are available for the report:

Product Analysis

  • Product Matrix, which gives a detailed comparison of the product portfolio of each company

Geographic Analysis

With the given market data, MarketsandMarkets offers customizations according to the company-specific scientific needs.

  • Further breakdown of the Rest of European functional food ingredients market into Poland, the Netherlands, Belgium, Finland, Norway, Greece, Denmark, Switzerland, and Ireland
  • Further breakdown of the Rest of Asia Pacific market into New Zealand, Vietnam, Indonesia, Malaysia, Taiwan, Indonesia, and South Korea.
  • Further breakdown of the Rest of South American market into Colombia, Peru, Chile, and Venezuela

Company Information

  • Detailed analyses and profiling of additional market players (up to five)
Custom Market Research Services

We will customize the research for you, in case the report listed above does not meet with your exact requirements. Our custom research will comprehensively cover the business information you require to help you arrive at strategic and profitable business decisions.

Request Customization

Instant Answers with GPT - Ask Now!

Ask real questions. Get complete answers !
Report Code
FB 3559
Published ON
Jun, 2021
Choose License Type
BUY NOW
  • SHARE
X
Request Customization
Speak to Analyst
Speak to Analyst
OR FACE-TO-FACE MEETING
PERSONALIZE THIS RESEARCH
  • Triangulate with your Own Data
  • Get Data as per your Format and Definition
  • Gain a Deeper Dive on a Specific Application, Geography, Customer or Competitor
  • Any level of Personalization
REQUEST A FREE CUSTOMIZATION
LET US HELP YOU!
  • What are the Known and Unknown Adjacencies Impacting the Functional Food Ingredients Market
  • What will your New Revenue Sources be?
  • Who will be your Top Customer; what will make them switch?
  • Defend your Market Share or Win Competitors
  • Get a Scorecard for Target Partners
CUSTOMIZED WORKSHOP REQUEST
+1-888-600-6441
  • Call Us
  • +1-888-600-6441 (Corporate office hours)
  • +1-888-600-6441 (US/Can toll free)
  • +44-800-368-9399 (UK office hours)
CONNECT WITH US
ABOUT TRUST ONLINE
©2023 MarketsandMarkets Research Private Ltd. All rights reserved
DMCA.com Protection Status Website Feedback