Probiotic Ingredients Market by Application (Functional Foods & Beverages, Pharmaceuticals, and Animal Nutrition), Source (Bacteria and Yeast), Form (Dry and Liquid), End User (Human and Animal), and Region - Global Forecast to 2023


[154 Pages Report] The global probiotic ingredients market was valued at USD 246.6 million in 2017 and is projected to reach USD 402.3 million by 2023, at a CAGR of 8.5% from 2018. The global demand for probiotic ingredients is increasing significantly due to growth in awareness among customers about their direct relation to digestive health benefits, rise in demand for high-nutrient foods, and increase in demand for quality feed products. Probiotics are also found in supplement form or as components of food & beverages. Their integration with inexpensive but good-for-health products, such as yogurt, fruit juices, and cultured dairy drinks, has contributed to their significant market size.

To know about the assumptions considered for the study, Request for Free Sample Report
The global probiotic ingredients market is currently driven by the rising popularity of probiotic functional foods & beverages among consumers. Factors such as age, stress, and poor diet are responsible for digestive ailments, bloating, and reduced resistance to infections; and the consumption of probiotic-enhanced products help to alleviate these widespread conditions. These products contain live microorganisms (probiotic strains) that confer positive health effects on the host. Companies such as Chr. Hansen has developed patented strains of microorganisms claiming to have specific health benefits; there has been a proliferation of probiotic suppliers who develop customized strains of microorganisms to integrate with a diverse set of products.
By source, the market is segmented into bacteria and yeast. The bacteria segment accounted for a larger share in the global probiotic ingredients market, by source, in 2017. The bacterial strains in probiotic foods provide health benefits, such as increased lactase production, prevention of diarrhea, prevention of irritable bowel syndrome (IBS), and enhanced immunity of Lactobacilli. The yeast segment is projected to record a higher CAGR during the forecast period, with the increasing demand for Saccharomyces boulardii, a unique, harmless, and tropical yeast having several beneficial effects on human intestinal health.

To know about the assumptions considered for the study, download the pdf brochure
By application, the market has been segmented into functional food & beverages, pharmaceuticals, animal nutrition, and others which include cosmetics & personal care products. The pharmaceuticals segment is growing at the highest rate owing to a spike in the number of diseases such as antibiotic-associated diarrhea, inflammatory bowel disease, lactose intolerance, irritable bowel syndrome, vaginal infections, rheumatoid arthritis, liver cirrhosis, and immune enhancement. The intake of dietary supplements for overall improvement in health among consumers would drive the growth of the segment during the forecast period.
By form, the market has been segmented into dry and liquid. The dry form is projected to dominate the market during the forecast period owing to lower costs in transportation when compared with liquid form. The dry form of probiotic ingredients has a higher shelf-life, due to which it is preferred by manufacturers and suppliers.
By end use, the probiotic ingredients market has been segmented into animal and human use. While human use accounts for a larger market share during the forecast period, the usage of probiotic strains in the animal nutrition industry is growing. Probiotic strains are used in feed to enhance the effectiveness of nutrients and show their effects on the gut by aiding in better digestion and reducing the impact of pathogenic bacteria, which causes various diseases in animals. The animals can grow better as the feed is altered in terms of quality and palatability due to its added probiotic content. The aim of probiotic strains is to take care of deficiencies of the natural microflora and provide animals with better resistance against diseases.
By region, the Asia Pacific market accounted for the largest share of the probiotic ingredients market in 2017, followed by Europe. Some factors that influence these market shares include the high demand for functional foods and dairy products, the presence of major players in these regions, and awareness about the benefits of using probiotics. Top probiotic manufacturers, such as DowDuPont (US), Kerry (Republic of Ireland), Lallemand (US), and Chr. Hansen (Denmark) together account for more than one-third of the total market share. These companies have a strong presence in Europe and the Asia Pacific and have manufacturing facilities across these regions along with strong distribution networks.
The competitive landscape for the probiotic ingredients is fragmented, with many big and small players concentrated in the European market. The focus is on the human use products due to which the competition is higher to provide for the functional food and pharmaceutical industries where the demand is high. Significant growth is being witnessed in new players trying to penetrate the probiotic ingredients market to cater to the animal feed industry.
Scope of the report
|
Report Metric |
Details |
|
Market size available for years |
2016-2023 |
|
Base year considered |
2017 |
|
Forecast period |
2018 – 2023 |
|
Forecast units |
Value (USD Million) |
|
Segments covered |
Application, Source, End-user, Form, and Region |
|
Geographies covered |
North America, Europe, Asia Pacific, and RoW |
|
Companies covered |
Kerry Group (Ireland), DowDuPont (US), CHR Hansen (Denmark), Biogaia (Sweden), Probi (Sweden), Glac Biotech (Taiwan), Bifodan (Denmark), Lallemand (Canada), UAS Laboratories (US), Biena (Canada) |
The report forecasts revenue growth at the global, regional, and country levels and analyzes the latest industry trends in each of the sub-segments between 2016 and 2023. For the purpose of the study, the following segmentation has been considered for the probiotic ingredients market.
By Application
-
Functional Foods & Beverages
-
Dairy Products
- Yogurt
- Cheese
- Other dairy products
-
Non-dairy Products
- Vegetable-based probiotic products
- Fruit-based probiotic products
- Meat-based probiotic products
-
Dairy Products
-
Pharmaceuticals
-
Dietary Supplements
- Tablets
- Probiotic Drinks
- Powders
- Capsules
-
Dietary Supplements
- Animal Nutrition
- Others (includes strains used in cosmetics and personal care)
By Source
-
Bacteria
- Lactobacillus
- Bifidobacterium
- Streptococcus and Enterococcus
-
Yeast
- Saccharomyces cerevisiae
- Saccharomyces boulardi
- E-Coli
By Form
- Dry
- Liquid
By End User
- Human
- Animal
By Region
-
North America
- US
- Canada
- Mexico
-
Europe
- Russia
- UK
- Italy
- Germany
- Spain
- Rest of Europe (includes Denmark, Belgium, Switzerland, Sweden, and the Netherlands)
-
Asia Pacific
- China
- India
- Japan
- Australia & New Zealand
- Rest of Asia Pacific (includes South Korea, Thailand, Vietnam, Malaysia, Singapore, and Indonesia)
-
RoW
- South America
- Middle East and Africa
Frequently Asked Questions (FAQ):
What is the market size of probiotic ingredients and their growth potential?
The global probiotic ingredients market was valued at USD 246.6 million in 2017 and is projected to reach USD 402.3 million by 2023, at a CAGR of 8.5% from 2018. The global demand for probiotic ingredients is increasing significantly due to growth in awareness among customers about their direct relation to digestive health benefits, rise in demand for high-nutrient foods, and increase in demand for quality feed products.
What are the key application areas which are being covered under the probiotic ingredients market?
The major application areas include functional food & beverages, animal nutrition, pharmaceuticals, and other applications, such as cosmetics & personal care. The largest application is in functional food & beverages owing to high demand from consumers for probiotic supplements in their food and beverages.
Who are the key players operating in the probiotic ingredients market?
The key players in the market include Lallemand (Canada), Kerry Group (Ireland), Biogaia (Sweden), Probi (Sweden), Glac Biotech (Taiwan), Bifodan (Denmark), etc., who hold the majority of the market share.
What are some of the potentially high-growth markets for probiotic ingredients?
Countries such as China, India, the US, Canada, Germany, etc., are some of the potential high-growth markets for probiotic ingredients.
Are there some new sources that are gaining popularity in the market for probiotic ingredients?
Yeast is being used along with bacterial strains. When yeast is applied as a probiotic, it helps improve nutrient absorption from food digestion in the host. According to the European Food Safety Authority (EFSA), Saccharomyces cerevisiae is the most commonly used yeast used in food fermenting. .
To speak to our analyst for a discussion on the above findings, click Speak to Analyst
 Exclusive indicates content/data unique to MarketsandMarkets and not available with any competitors.
Table of Contents
1 Introduction (Page No. - 16)
1.1 Objectives of the Study
1.2 Market Definition
1.3 Study Scope
1.4 Periodization Considered
1.5 Currency Considered
1.6 Stakeholders
2 Research Methodology (Page No. - 20)
2.1 Research Data
2.1.1 Secondary Data
2.1.2 Primary Data
2.1.2.1 Key Industry Insights
2.1.2.2 Breakdown of Primary Interviews
2.2 Market Size Estimation
2.3 Data Triangulation
2.4 Research Assumptions
2.5 Limitations
3 Executive Summary (Page No. - 27)
4 Premium Insights (Page No. - 32)
4.1 Opportunities in this Market
4.2 Probiotic Ingredients Market, By Source
4.3 Asia Pacific: Probiotic Ingredients Market, By Application
4.4 Probiotic Ingredients Market, By End User and Region
4.5 Probiotic Ingredients Market Growth, By Key Country
5 Market Overview (Page No. - 36)
5.1 Introduction
5.2 Market Dynamics
5.2.1 Drivers
5.2.1.1 Health Benefits Associated With Probiotic-Fortified Foods
5.2.1.2 Increasing Popularity of Probiotic Dietary Supplements
5.2.1.3 Participation of International Bodies in the R&D of Probiotics
5.2.1.4 Increasing Global Demand for Superior-Quality Feed Products
5.2.2 Restraints
5.2.2.1 International Quality Standards and Regulations for Probiotic Products
5.2.3 Opportunities
5.2.3.1 Eu Ban on Antibiotic Growth Promoters in Feed
5.2.3.2 Increasing Demand for Probiotics in Developed Economies
5.2.3.3 Promoting Probiotic Health Benefits Among Livestock Farmers
5.2.4 Challenges
5.2.4.1 Complexities in Integrating Probiotics in Functional Food
5.2.4.2 Significant Operating Cost
5.2.4.3 Proving the Efficacy of Probiotic Strains
6 Regulatory Framework and Patents (Page No. - 44)
6.1 Introduction
6.2 North America: Regulatory Environment Analysis
6.2.1 US
6.2.2 Canada
6.3 Europe: Regulatory Environment Analysis
6.4 Asia Pacific: Regulatory Environment Analysis
6.4.1 Japan
6.4.2 India
6.5 South America: Regulatory Environment Analysis
6.5.1 Brazil
6.6 Patent Analysis
7 Probiotic Ingredients Market, By Application (Page No. - 50)
7.1 Introduction
7.2 Functional Foods & Beverages
7.2.1 Dairy Products
7.2.1.1 Yogurt
7.2.1.2 Cheese
7.2.1.3 Other Dairy Products
7.2.2 Non-Dairy Products
7.2.2.1 Vegetable-Based Probiotic Products
7.2.2.2 Fruit-Based Probiotic Products
7.2.2.3 Meat-Based Probiotic Products
7.3 Pharmaceuticals
7.3.1 Dietary Supplements
7.3.1.1 Tablets
7.3.1.2 Probiotic Drinks
7.3.1.3 Powders
7.3.1.4 Capsules
7.4 Animal Nutrition
7.5 Others
8 Probiotic Ingredients Market, By Source (Page No. - 66)
8.1 Introduction
8.2 Bacteria
8.2.1 Lactobacillus
8.2.2 Bifidobacterium
8.2.3 Streptococcus and Enterococcus
8.3 Yeast
8.3.1 Saccharomyces Cerevisiae
8.3.2 Saccharomyces Boulardi
8.3.3 E. Coli
9 Probiotics Ingredients Market, By Form (Page No. - 72)
9.1 Introduction
9.2 Dry
9.2.1 Dry Form Holds the Largest Market Share Due to Its Stability and Longer Shelf-Life
9.3 Liquid
9.3.1 Liquid Form has A Faster Growing Market Due to Being Relatively Cheaper Than Dry Form.
10 Probiotics Ingredients Market, By End User (Page No. - 76)
10.1 Introduction
10.2 Human
10.2.1 Intestinal Disorders
10.2.2 Lactose Intolerance
10.2.3 Inflammatory Bowel Disorders
10.2.4 Cardiovascular Diseases
10.2.5 Respiratory Infections
10.2.6 Obesity
10.2.7 Urogenital Infections
10.2.8 Type-2 Diabetes
10.2.9 Cancer
10.3 Animal
11 Probiotic Ingredients Market, By Region (Page No. - 83)
11.1 Introduction
11.2 North America
11.2.1 US
11.2.1.1 US Accounted for the Largest Share in North American Market Due to Higher Adoption of Technologies
11.2.2 Canada
11.2.2.1 Canada has Huge Potential for Probiotic Ingredients Due to Increasing Investments By Big Players
11.2.3 Mexico
11.2.3.1 Increasing Demand From the Pharmaceuticals Industry is Expected to Drive the Market for Probiotic Strains in Mexico
11.3 Europe
11.3.1 UK
11.3.1.1 Higher Pace of Technological Advancements is Driving the Market for Probiotic Ingredients in the Country
11.3.2 Germany
11.3.2.1 Ban on Usage of Antibiotics By the Eu in the Poultry Industry is Proving to Be an Opportunity for Probiotics in the Country
11.3.3 Italy
11.3.3.1 Consumer Awareness About Health Benefits of Probiotics is Driving the Market in the Country
11.3.4 Spain
11.3.4.1 Increasing Investment in Probiotics By Big Players in the Country is Driving the Market
11.3.5 Russia
11.3.5.1 Increasing Demand for Fermented Dairy Products in the Country is Driving the Market for Probiotic Ingredients
11.3.6 Rest of Europe
11.3.6.1 Consumer Acceptance for Probiotic Products Driving the Market for Probiotic Ingredient
11.4 Asia Pacific
11.4.1 China
11.4.1.1 The Market in China is Growing Due to the Increasing Application of Probiotics in Infant Formula Business
11.4.2 Japan
11.4.2.1 Increase in Health Care Costs is One of the Driving Forces for the Probiotic Ingredients Market
11.4.3 Australia & New Zealand
11.4.3.1 Technological Advancements in Probiotics is Driving the Market in the Countries
11.4.4 India
11.4.4.1 India has Huge Potential Due to the Increase in Pharmaceutical Companies Investing in Development of Probiotic Drugs
11.4.5 Rest of Asia Pacific
11.4.5.1 Fermented Dairy Products Have Gained Popularity in These Countries
11.5 RoW
11.5.1 South America
11.5.1.1 The Increased Demand for Good Quality Meat From Consumers Presents an Immense Opportunity for Application of Probiotic Strains in Animal Feed
11.5.2 Middle East & Africa
11.5.2.1 Functional Foods & Beverages has the Largest Market Share in Middle East Due to the Application of Inexpensive Technology of Fermentation in the Manufacture of End Products
12 Competitive Landscape (Page No. - 114)
12.1 Overview
12.2 Expansions & Investments
12.3 Agreements, Collaborations, and Joint Ventures & Partnerships
12.4 Product Launches
12.5 Mergers & Acquisitions
13 Company Profiles (Page No. - 121)
(Business Overview, Products Offered, Recent Developments, SWOT Analysis, MnM View)*
13.1 Kerry
13.2 Dowdupont
13.3 Chr. Hansen
13.4 Biogaia
13.5 Probi
13.6 GLAC Biotech
13.7 Bifodan
13.8 Lallemand
13.9 Uas Laboratories
13.10 Biena
*Details on Business Overview, Products Offered, Recent Developments, SWOT Analysis, MnM View Might Not Be Captured in Case of Unlisted Companies.
14 Appendix (Page No. - 147)
14.1 Discussion Guide
14.2 Knowledge Store: Marketsandmarkets’ Subscription Portal
14.3 Available Customizations
14.4 Related Reports
14.5 Author Details
List of Tables (80 Tables)
Table 1 USD Exchange Rates, 2014–2017
Table 2 List of Probiotic Organizations Working on Probiotic Strains and Cultures
Table 3 National/International Bodies for Safety Standards and Regulations
Table 4 Patents Approved for Probiotic Strains, By Bacterial Genera
Table 5 Probiotic Ingredients Market Size, By Application, 2016–2023 (USD Million)
Table 6 List of Probiotic Strain Carriers in the Food Industry
Table 7 Probiotic Ingredient Market Size in Functional Foods & Beverages, By Region, 2016–2023 (USD Million)
Table 8 North America Functional Foods & Beverages Market, By Country, 2016-2023 (USD Million)
Table 9 Europe Functional Foods & Beverages Market, By Country, 2016-2023 (USD Million)
Table 10 Asia Pacific Functional Foods & Beverages Market, By Country, 2016-2023 (USD Million)
Table 11 RoW Functional Foods & Beverages Market, By Region, 2016-2023 (USD Million)
Table 12 Probiotic Ingredient Market Size in Pharmaceuticals, By Region, 2016–2023 (USD Million)
Table 13 North America Pharmaceuticals Market, By Country, 2016-2023 (USD Million)
Table 14 Europe Pharmaceuticals Market, By Country, 2016-2023 (USD Million)
Table 15 Asia Pacific Pharmaceuticals Market, By Country, 2016-2023 (USD Million)
Table 16 RoW Pharmaceuticals Market, By Region, 2016-2023 (USD Million)
Table 17 Probiotic Ingredient Market Size in Animal Nutrition, By Region, 2016-2023 (USD Million)
Table 18 North America Animal Nutrition Market, By Country, 2016-2023 (USD Million)
Table 19 Europe Animal Nutrition Market, By Country, 2016-2023 (USD Million)
Table 20 Asia Pacific Animal Nutrition Market, By Country, 2016-2023 (USD Million)
Table 21 RoW Animal Nutrition Market, By Region, 2016-2023 (USD Million)
Table 22 Probiotic Ingredients Market Size in Other Applications, By Region, 2016-2023 (USD Million)
Table 23 North America Others Market, By Country, 2016-2023 (USD Million)
Table 24 Europe Others Market, By Country, 2016-2023 (USD Million)
Table 25 Asia Pacific Others Market, By Country, 2016-2023 (USD Million)
Table 26 RoW Others Market, By Region, 2016-2023 (USD Million)
Table 27 Probiotic Ingredient Market Size, By Source, 2016–2023 (USD Million)
Table 28 List of Probiotic Strains Derived From Bacteria With Uses
Table 29 Probiotic Bacterial Ingredients Market Size, By Region, 2016–2023 (USD Million)
Table 30 List of Probiotic Strains Derived From Yeast With Uses
Table 31 Probiotic Yeast Ingredients Market Size, By Region, 2016–2023 (USD Million)
Table 32 Probiotic Ingredients Market, By Form, 2016–2023 (USD Million)
Table 33 Dry Probiotic Ingredient Market, By Region, 2016–2023 (USD Million)
Table 34 Liquid Probiotic Ingredients Market, By Region, 2016–2023 (USD Million)
Table 35 Probiotic Ingredient Market, By End User, 2016–2023 (USD Million)
Table 36 Human Probiotic Ingredients Market, By Region, 2016–2023 (USD Million)
Table 37 Probiotic Strains Used in Feed
Table 38 Benefits of Using Probiotic Strains on Animals
Table 39 Animal Probiotic Ingredient Market, By Region, 2016–2023 (USD Million)
Table 40 Probiotic Ingredients Market Size, By Region, 2016–2023 (USD Million)
Table 41 North America: Probiotic Ingredient Market Size, By Country, 2016–2023 (USD Million)
Table 42 North America: Market Size, By Application, 2016–2023 (USD Million)
Table 43 North America: Market Size, By Source, 2016–2023 (USD Million)
Table 44 North America: Market Size, By Form, 2016–2023 (USD Million)
Table 45 North America: Market Size, By End User, 2016–2023 (USD Million)
Table 46 US: Probiotic Ingredient Market Size, By Application, 2016–2023 (USD Million)
Table 47 Canada: Market Size, By Application, 2016–2023 (USD Million)
Table 48 Mexico: Market Size, By Application, 2016–2023 (USD Million)
Table 49 Europe: Market Size, By Country, 2016–2023 (USD Million)
Table 50 Europe: Market Size, By Application, 2016–2023 (USD Million)
Table 51 Europe: Probiotic Ingredients Market Size, By Source, 2016–2023 (USD Million)
Table 52 Europe: Market Size, By Form, 2016–2023 (USD Million)
Table 53 Europe: Market Size, By End User, 2016–2023 (USD Million)
Table 54 UK: Probiotic Ingredient Market Size, By Application, 2016–2023 (USD Million)
Table 55 Germany: Market Size, By Application, 2016–2023 (USD Million)
Table 56 Italy: Market Size, By Application, 2016–2023 (USD Million)
Table 57 Spain: Market Size, By Application, 2016–2023 (USD Million)
Table 58 Russia: Market Size, By Application, 2016–2023 (USD Million)
Table 59 Rest of Europe: Market Size, By Application, 2016–2023 (USD Million)
Table 60 Asia Pacific: Probiotic Ingredients Market Size, By Country, 2016–2023 (USD Million)
Table 61 Asia Pacific: Market Size, By Application, 2016–2023 (USD Million)
Table 62 Asia Pacific: Market Size, By Source, 2016–2023 (USD Million)
Table 63 Asia Pacific: Market Size, By Form, 2016–2023 (USD Million)
Table 64 Asia Pacific: Market Size, By End User, 2016–2023 (USD Million)
Table 65 China: Probiotic Ingredient Market Size, By Application, 2016–2023 (USD Million)
Table 66 Japan: Market Size, By Application, 2016–2023 (USD Million)
Table 67 Australia & New Zealand: Market Size, By Application, 2016–2023 (USD Million)
Table 68 India: Market Size, By Application, 2016–2023 (USD Million)
Table 69 Rest of Asia Pacific: Market Size, By Application, 2016–2023 (USD Million)
Table 70 RoW: Probiotic Ingredients Market Size, By Region, 2016–2023 (USD Million)
Table 71 RoW: Market Size, By Application, 2016–2023 (USD Million)
Table 72 RoW: Market Size, By Source, 2016–2023 (USD Million)
Table 73 RoW: Market Size, By Form, 2016–2023 (USD Million)
Table 74 RoW: Market Size, By End User, 2016–2023 (USD Million)
Table 75 South America: Probiotic Ingredients Market Size, By Application, 2016–2023 (USD Million)
Table 76 Middle East & Africa: Probiotic Ingredient Market Size, By Application, 2016–2023 (USD Million)
Table 77 Expansions & Investments 2013–2018
Table 78 Agreements, Collaborations, and Joint Ventures & Partnerships 2013–2018
Table 79 Product Launches 2013–2018
Table 80 Mergers & Acquisitions 2014–2018
List of Figures (37 Figures)
Figure 1 Market Segmentation
Figure 2 Probiotic Ingredients Market, By Region
Figure 3 Probiotic Ingredients: Research Design
Figure 4 Breakdown of Primary Interviews: By Company Type, Designation, and Region
Figure 5 Market Size Estimation Methodology: Bottom-Up Approach
Figure 6 Market Size Estimation Methodology: Top-Down Approach
Figure 7 Data Triangulation
Figure 8 Probiotic Ingredients Market Size, By Application, 2018 vs 2023 (USD Million)
Figure 9 Probiotic Ingredient Market Share (Value), By End User, 2018
Figure 10 Market Size, By Source, 2018 vs 2023 (USD Million)
Figure 11 Probiotic Ingredient Market: Regional Snapshot
Figure 12 Strong Growth of Pharmaceuticals Due to the Health Benefits of Probiotics in Human Health
Figure 13 Bacteria-Sourced Probiotic Ingredients Were the Most Preferred Among Manufacturers in 2017
Figure 14 Asia Pacific: Strong Demand Witnessed for Probiotic Ingredients in Functional Foods & Beverages in 2017
Figure 15 Human Segment Dominated the Market Across All Regions in 2017
Figure 16 US: Most Promising Market for Probiotic Ingredients in 2017
Figure 17 Probiotic Ingredients Market: Drivers, Restraints, Opportunities, and Challenges
Figure 18 Global Yogurt Market, 2013–2017
Figure 19 Global Dietary Supplements Demand, 2016–2021
Figure 20 Patents Approved for Probiotic Strains, By Bacterial Genera
Figure 21 Probiotic Ingredient Market Size, By Application, 2018 vs 2023 (USD Million)
Figure 22 Market Size, By Source, 2018 vs 2023 (USD Million)
Figure 23 Probiotic Ingredient Market, By Form, 2018 vs 2023 (USD Million)
Figure 24 Market, By End User, 2018 vs 2023 (USD Million)
Figure 25 Asia Pacific Dominated the Probiotic Ingredients Market in 2017, in Terms of Value
Figure 26 Asia Pacific to Lead Global Probiotic Ingredient Market, 2018–2023 (USD Million)
Figure 27 North America: Regional Snapshot
Figure 28 Asia Pacific: Regional Snapshot
Figure 29 Probiotic Ingredients Market Share, By Key Players, 2017
Figure 30 Agreements, Collaborations, and Joint Ventures & Partnerships, 2013–2018
Figure 31 Annual Developments in the Probiotic Ingredients Market, 2013–2018
Figure 32 Kerry: Company Snapshot
Figure 33 Dowdupont: Company Snapshot
Figure 34 Chr. Hansen: Company Snapshot
Figure 35 Biogaia: Company Snapshot
Figure 36 Probi: Company Snapshot
Figure 37 GLAC Biotech: Company Snapshot
The study involves four major activities to estimate the current market size for probiotic ingredients. Exhaustive secondary research was done to collect information on the market, the peer market, and parent market. The next step was to validate these findings, assumptions, and sizing with industry experts across the value chain through primary research. Both, top-down and bottom-up approaches were employed to estimate the complete market size. Thereafter, market breakdown and data triangulation were used to estimate the market size of segments and subsegments.
Secondary Research
In the secondary research process, various secondary sources such as Hoovers, Bloomberg BusinessWeek, and Dun & Bradstreet were referred to, so as to identify and collect information for this study. These secondary sources included annual reports, press releases & investor presentations of companies, white papers, certified publications, articles by recognized authors, gold standard & silver standard websites, food safety organizations, regulatory bodies, trade directories, and databases.
Primary Research
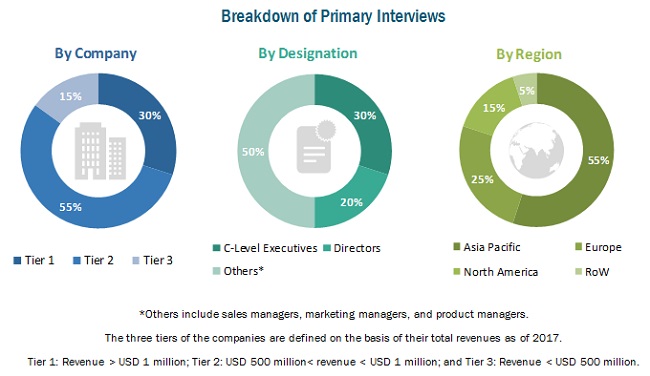
The probiotic ingredients market comprises several stakeholders such as probiotic ingredient manufacturers, regulatory bodies, intermediary suppliers, and end users in the supply chain. The demand side of this market is characterized by the development of the food & beverage, pharmaceutical, animal nutrition, and cosmetics & personal care industries. The supply side is characterized by advancements in technology and various application industries. Primary sources from both, the supply and demand sides of the market were interviewed to obtain qualitative and quantitative information. Following are the breakdown of primary respondents:
To know about the assumptions considered for the study, download the pdf brochure
Market Size Estimation
Both, top-down and bottom-up approaches were used to estimate and validate the total size of the probiotic ingredients market. These methods were also used extensively to estimate the size of various subsegments in the market. The research methodology used to estimate the market size includes the following:
- Key players in the industry and markets were identified through extensive secondary research.
- The industry’s supply chain and market size, in terms of value, were determined through primary and secondary research processes.
- All percentage shares, splits, and breakdowns were determined using secondary sources and verified through primary sources.
Data Triangulation
After arriving at the overall market size using the market size estimation processes as explained above—the market was split into several segments and subsegments. To complete the overall market engineering process and arrive at the exact statistics of each market segment and subsegment, the data triangulation and market breakdown procedures were employed wherever applicable. The data was triangulated by studying various factors and trends from both, the demand and supply sides, in the food, feed, pharmaceutical, cosmetics & personal care industries.
Report Objectives
- Determining and projecting the size of the probiotic ingredients market with respect to its application, source, form, end user, and regional markets, over a five-year period ranging from 2018 to 2023
- Identifying attractive opportunities in the market by determining the largest and fastest-growing segments across regions
- Analyzing the demand-side factors on the basis of the following:
- Impact of macro- and micro-economic factors on the market
- Shifts in demand patterns across different sub-segments and regions
- Identifying and profiling key players in the probiotic ingredients market
- Providing a comparative analysis of the market leaders on the basis of the following:
- Product offerings
- Business strategies
- Strengths, weaknesses, opportunities, and threats
- Key financials
- Understanding the competitive landscape and identifying major growth strategies adopted by players across the key regions
- Analyzing the supply chain and regulatory frameworks across regions and their impact on prominent market players
- Providing insights on key investments in product innovations and technology and patent registrations
Available Customizations
With the given market data, MarketsandMarkets offers customizations according to a company’s specific needs.
The following customization options are available for the report:
Segment Analysis
- Product matrix, which gives a detailed comparison of the product portfolio of each company
Regional Analysis
- Further breakdown of the Asia Pacific probiotic ingredients market, by country
- Further breakdown of the Europe probiotic ingredients market, by country
- Further breakdown of the RoW probiotic ingredients market, by country
Company Information
- Detailed analysis and profiling of additional market players (up to 5)


Growth opportunities and latent adjacency in Probiotic Ingredients Market