GPON Market by Component (OLT, and ONT), Technology (2.5G PON, XG-PON, XGS-PON, and NG-PON2), Application (FTTH, Mobile Backhaul), Vertical (Transportation, Telecom, Healthcare, Energy & Utilities, MTU), Region - Global Forecast To 2036


GPON Market Summary
The GPON (Gigabit Passive Optical Network) Market was valued at approximately USD 9 billion in 2025 and is projected to reach USD 26 billion by 2036, growing at a CAGR of 10% during the forecast period (2025–2036). The market is witnessing strong momentum as global demand for high-speed broadband connectivity continues to surge across residential, enterprise, and industrial sectors. This growth is primarily driven by the increasing adoption of fiber-to-the-home (FTTH) and fiber-to-the-premises (FTTP) networks, alongside the rapid expansion of digital infrastructure. Emerging technologies such as artificial intelligence (AI), Internet of Things (IoT), and automation are significantly influencing the GPON ecosystem by enabling smarter network management, predictive maintenance, and optimized bandwidth utilization. Governments and telecom operators are investing heavily in fiber-optic infrastructure to support data-intensive applications, including 5G backhaul, cloud computing, and smart city deployments, positioning GPON as a critical enabler of next-generation connectivity.
Key Market Trends & Insights
The GPON Market is evolving rapidly, supported by strong technological advancements and increasing global connectivity needs. North America leads the market due to advanced telecom infrastructure and early adoption of fiber networks, while Asia Pacific is the fastest-growing region driven by large-scale broadband expansion projects. The optical line terminal (OLT) segment dominates due to its central role in network architecture and data distribution. Emerging trends include the transition toward XG-PON and NG-PON2 technologies, which offer higher bandwidth and improved efficiency. AI-driven network optimization and automation are transforming GPON deployments by reducing operational costs and enhancing service quality. Additionally, the integration of GPON with IoT ecosystems is enabling seamless connectivity for smart homes, industrial automation, and smart city applications.
Market Size & Forecast
-
Base Year Market Size (2025): USD 9 Billion
-
Forecast Value (2036): USD 26 Billion
-
CAGR (2025–2036): 10%
-
Growth is driven by increasing fiber broadband adoption, rising demand for high-speed internet, and expansion of smart infrastructure and IoT ecosystems.
GPON Market Top 10 key takeaway
-
The GPON Market is projected to grow at a CAGR of 10% through 2036.
-
North America dominates due to advanced telecom infrastructure.
-
Asia Pacific is the fastest-growing region with large-scale fiber deployments.
-
OLT equipment is the leading product segment.
-
Transition to next-generation PON technologies is accelerating growth.
-
AI integration is improving network performance and efficiency.
-
Increasing demand for FTTH is a key growth driver.
-
IoT and smart city initiatives are boosting adoption.
-
Automation is reducing operational costs for telecom operators.
-
5G backhaul requirements are driving GPON infrastructure investments.
Product Insights
The optical line terminal (OLT) segment holds a dominant position in the GPON Market, as it serves as the backbone of the network, managing data transmission between service providers and end users. OLTs are critical for ensuring efficient bandwidth allocation and maintaining network performance, making them indispensable in large-scale fiber deployments. Their dominance is further reinforced by the increasing demand for high-capacity networks capable of supporting data-intensive applications such as streaming, gaming, and cloud services.
Optical network terminals (ONTs) and optical network units (ONUs) are also experiencing significant growth, particularly in residential and enterprise applications. These devices enable end-user connectivity and are becoming more advanced with integrated Wi-Fi capabilities and smart home features. Emerging product categories include next-generation GPON solutions such as XG-PON and NG-PON2, which offer higher data rates and improved scalability. The integration of AI into GPON hardware is enabling intelligent traffic management, predictive fault detection, and enhanced network optimization, further driving innovation in the market.
Technology / Component Insights
The GPON Market is driven by advancements in fiber-optic communication technologies, including XG-PON, XGS-PON, and NG-PON2, which provide higher bandwidth and improved network efficiency. These technologies are essential for supporting the growing demand for high-speed internet and data-intensive applications. The transition from traditional copper-based networks to fiber-optic infrastructure is a key factor driving market growth.
AI and machine learning are playing a transformative role in GPON networks by enabling automated network management, predictive maintenance, and real-time performance optimization. IoT integration is expanding the scope of GPON applications, as connected devices require reliable and high-speed connectivity. Cloud computing is facilitating centralized network management and data analysis, while automation is streamlining deployment and maintenance processes.
Future innovation trends include the development of software-defined networking (SDN) and network function virtualization (NFV) for GPON, which will enhance flexibility and scalability. The adoption of edge computing is also expected to improve latency and support real-time applications, further strengthening the role of GPON in next-generation networks.
Application Insights
The residential broadband segment is the leading application area in the GPON Market, driven by the increasing demand for high-speed internet for streaming, gaming, and remote work. The widespread adoption of FTTH networks is enabling faster and more reliable connectivity, making GPON a preferred solution for residential users.
Enterprise applications are also gaining traction, as businesses require high-speed and secure connectivity for cloud computing, data centers, and digital operations. Industrial applications, including smart manufacturing and automation, are further driving demand for GPON networks. The technology is also being used in smart cities, where it supports applications such as surveillance, traffic management, and public Wi-Fi.
Future opportunities lie in the integration of GPON with 5G networks, where it serves as a critical backhaul solution. The growing adoption of IoT devices and smart infrastructure is expected to further expand the application scope of GPON technology.
Regional Insights
North America leads the GPON Market, supported by advanced telecom infrastructure, high internet penetration, and significant investments in fiber-optic networks. The region’s focus on digital transformation and adoption of advanced technologies has driven the demand for GPON solutions.
Europe is experiencing steady growth, driven by government initiatives to expand broadband connectivity and improve digital infrastructure. The region is focusing on sustainable and efficient network solutions, further boosting the adoption of GPON.
Asia Pacific is the fastest-growing region, fueled by rapid urbanization, increasing internet penetration, and large-scale fiber deployment projects. Countries such as China, India, and Japan are investing heavily in broadband infrastructure, driving market growth.
-
North America leads due to advanced infrastructure and early adoption
-
Europe shows steady growth driven by government initiatives
-
Asia Pacific is the fastest-growing region
-
Increasing internet penetration is driving demand globally
-
Fiber deployment projects are accelerating market expansion
Country-Specific Market Trends
In Asia Pacific, China dominates the GPON Market with a projected CAGR of 11.5%, driven by extensive fiber network deployment and government support for digital infrastructure. Japan follows with a CAGR of 9.8%, focusing on advanced telecom technologies and high-speed connectivity.
In North America, the United States leads the market due to strong investments in fiber broadband and 5G infrastructure. Canada and Mexico are experiencing steady growth, with CAGRs ranging from 8.5% to 9.2%, supported by increasing demand for high-speed internet and digital services.
In Europe, Germany and France are key contributors to market growth, with CAGRs of approximately 9.0% and 8.7%, respectively. These countries are focusing on expanding broadband coverage and integrating advanced technologies into their telecom networks.
-
China leads APAC with large-scale fiber deployments
-
Japan focuses on advanced telecom technologies
-
United States dominates North America market
-
Canada and Mexico show steady growth trends
-
Germany and France lead Europe in broadband expansion
Key GPON Company Insights
The GPON Market is highly competitive, with leading companies focusing on innovation, AI integration, and strategic partnerships to strengthen their market position. Key players are investing in next-generation PON technologies and advanced network management solutions to meet the growing demand for high-speed connectivity.
Major companies include Huawei Technologies Co., Ltd., Nokia Corporation, ZTE Corporation, Calix Inc., FiberHome Telecommunication Technologies Co., Ltd., ADTRAN Holdings, Inc., Cisco Systems, Inc., DASAN Zhone Solutions, Inc., and Iskratel Group. These companies are leveraging AI and automation to enhance network performance, reduce operational costs, and deliver scalable solutions.
-
Companies are investing in next-generation PON technologies
-
AI-driven network management is a key focus area
-
Strategic partnerships are driving innovation
-
Cloud-based solutions are enhancing scalability
-
Expansion into emerging markets is a major growth strategy
Recent Developments
Recent developments in the GPON Market highlight the increasing focus on innovation and performance. In 2025, a leading telecom equipment provider launched an XGS-PON solution designed to support high-bandwidth applications and 5G backhaul. Another company introduced an AI-powered network management platform that enables real-time monitoring and optimization of GPON networks. Additionally, a strategic partnership between a telecom operator and a technology provider aims to expand fiber broadband coverage in rural and underserved areas.
Market Segmentation
The GPON Market is segmented based on product, technology/component, application, and region. By product, the market includes optical line terminals (OLT), optical network terminals (ONT), and optical network units (ONU), with OLT dominating due to its central role in network architecture. By technology, the market is segmented into GPON, XG-PON, XGS-PON, and NG-PON2. Application-wise, the market covers residential, enterprise, industrial, and smart city applications. Regionally, the market is divided into North America, Europe, Asia Pacific, and Rest of the World.
-
OLT dominates the product segment
-
Next-generation PON technologies are key drivers
-
Residential broadband is the leading application area
-
Asia Pacific offers the highest growth potential
-
Smart city applications are gaining traction
The GPON Market is poised for substantial growth through 2036, driven by the increasing demand for high-speed broadband, advancements in AI and automation, and the expansion of fiber-optic infrastructure. As digital transformation continues to reshape industries, GPON technology will play a critical role in enabling reliable and scalable connectivity. The integration of AI, IoT, and cloud technologies is expected to further enhance network performance and efficiency, making GPON a strategic investment for telecom operators and businesses worldwide. With strong growth potential across regions and applications, the GPON market is set to remain a cornerstone of next-generation communication networks.
FAQs
1. What is the current market size of the GPON Market?
The GPON Market was valued at approximately USD 9 billion in 2025.
2. What is the expected growth rate of the market?
The market is expected to grow at a CAGR of 10% from 2025 to 2036.
3. What are the key drivers of market growth?
Key drivers include increasing demand for high-speed internet, adoption of FTTH, AI integration, and expansion of IoT ecosystems.
4. Which region dominates the GPON Market?
North America currently holds the largest market share.
5. Who are the key players in the market?
Major companies include Huawei Technologies, Nokia Corporation, ZTE Corporation, and Cisco Systems.
To speak to our analyst for a discussion on the above findings, click Speak to Analyst
 Exclusive indicates content/data unique to MarketsandMarkets and not available with any competitors.
TABLE OF CONTENTS
1 INTRODUCTION (Page No. - 21)
1.1 STUDY OBJECTIVES
1.2 MARKET DEFINITION AND SCOPE
1.2.1 INCLUSIONS AND EXCLUSIONS
1.3 STUDY SCOPE
1.3.1 MARKETS COVERED
FIGURE 1 GPON MARKET SEGMENTATION
1.3.2 GEOGRAPHIC SCOPE
1.3.3 YEARS CONSIDERED
1.4 CURRENCY
1.5 PACKAGE SIZE
1.6 LIMITATIONS
1.7 STAKEHOLDERS
2 RESEARCH METHODOLOGY (Page No. - 26)
2.1 RESEARCH DATA
FIGURE 2 GPON MARKET: RESEARCH DESIGN
2.1.1 SECONDARY & PRIMARY RESEARCH
2.1.2 SECONDARY DATA
2.1.2.1 Major secondary sources
2.1.2.2 Secondary sources
2.1.3 PRIMARY DATA
2.1.3.1 Key data from primary sources
2.1.3.2 Key industry insights
2.1.3.3 Breakdown of primaries
2.2 MARKET SIZE ESTIMATION
2.3 BOTTOM-UP AND TOP-DOWN METHODOLOGY
2.3.1 BOTTOM-UP APPROACH
2.3.1.1 Approach for arriving at market size by bottom-up analysis (demand side)
FIGURE 3 GPON MARKET: BOTTOM-UP APPROACH
2.3.2 TOP-DOWN APPROACH
2.3.2.1 Approach for capturing market size by top-down analysis (supply side)
FIGURE 4 GPON MARKET: TOP-DOWN APPROACH
2.4 MARKET BREAKDOWN AND DATA TRIANGULATION
FIGURE 5 DATA TRIANGULATION
2.5 RESEARCH ASSUMPTIONS
3 EXECUTIVE SUMMARY (Page No. - 35)
FIGURE 6 TRANSPORTATION VERTICAL TO WITNESS HIGHEST CAGR IN MARKET DURING FORECAST PERIOD
FIGURE 7 OLT COMPONENT TO WITNESS HIGHER CAGR IN MARKET DURING FORECAST PERIOD
FIGURE 8 NG-PON2 TECHNOLOGY TO REGISTER HIGHEST CAGR IN MARKET DURING FORECAST PERIOD
FIGURE 9 ASIA PACIFIC TO REGISTER HIGHEST CAGR IN MARKET FROM 2020 TO 2025
4 PREMIUM INSIGHTS (Page No. - 39)
4.1 ATTRACTIVE GROWTH OPPORTUNITIES IN GPON MARKET
FIGURE 10 HIGH DEMAND FOR HIGH-SPEED BROADBAND SERVICES AND RAPID ADVANCEMENTS IN GPON TO BOOST MARKET GROWTH
4.2 GPON MARKET, BY COMPONENT
FIGURE 11 OPTICAL NETWORK TERMINAL TO HOLD MAJOR SHARE OF MARKET IN 2025
4.3 GPON MARKET, BY TECHNOLOGY
FIGURE 12 2.5G PON TO ACCOUNT FOR LARGEST SIZE OF MARKET IN 2020
4.4 GPON MARKET, BY APPLICATION
FIGURE 13 FIBER TO THE HOME APPLICATION TO HOLD LARGEST SIZE OF MARKET IN 2025
4.5 GPON MARKET, BY VERTICAL
FIGURE 14 RESIDENTIAL VERTICAL TO HOLD LARGEST SIZE OF MARKET IN 2020
4.6 GPON MARKET, BY REGION
FIGURE 15 ASIA PACIFIC TO CAPTURE LARGEST SIZE OF MARKET IN 2025
5 MARKET OVERVIEW (Page No. - 42)
5.1 INTRODUCTION
5.2 MARKET DYNAMICS
5.2.1 DRIVERS
5.2.1.1 Increased demand for triple- and quad-play services
5.2.1.2 High demand for high-speed broadband services
5.2.1.3 Rapid advancements in GPON technology
5.2.1.4 High penetration of FTTH services in APAC
5.2.2 RESTRAINTS
5.2.2.1 Availability of substitute technologies
5.2.2.2 High installation and operational costs, along with requirement for continuous power supply
5.2.3 OPPORTUNITIES
5.2.3.1 Trial and deployment of 5G networks
FIGURE 16 PERCENTAGE OF CONNECTIONS WORLDWIDE, BY TECHNOLOGY (2018 VS. 2025)
FIGURE 17 GLOBAL PROJECTION OF 5G ADOPTION
5.2.3.2 Rise in demand for video content
5.2.4 CHALLENGES
5.2.4.1 Interoperability issues and operational difficulties associated with fiber optics
5.3 VALUE CHAIN ANALYSIS
FIGURE 18 MAJOR VALUE IS ADDED BY MANUFACTURERS OF GPON OLT AND ONT
5.4 RECENT DEVELOPMENTS IN NG-PON2
6 GPON MARKET, BY TECHNOLOGY (Page No. - 52)
6.1 INTRODUCTION
FIGURE 19 GPON MARKET, BY TECHNOLOGY
FIGURE 20 NG-PON2 TECHNOLOGY TO REGISTER HIGHEST CAGR IN MARKET DURING FORECAST PERIOD
TABLE 1 MARKET, BY TECHNOLOGY, 2018–2025 (USD MILLION)
TABLE 2 MARKET, BY TECHNOLOGY, 2018–2025 (THOUSAND UNITS)
6.2 2.5G PON
6.2.1 HIGHER SPLIT RATIO OF 2.5G PON ENABLES SERVING MORE USERS WITH SINGLE NETWORK, THEREBY LEADING TO COST SAVINGS
TABLE 3 2.5G PON TECHNOLOGY MARKET, BY COMPONENT, 2018–2025 (USD MILLION)
TABLE 4 2.5G PON TECHNOLOGY MARKET, BY APPLICATION,2018–2025 (USD MILLION)
TABLE 5 2.5G PON TECHNOLOGY MARKET, BY REGION, 2018–2025 (USD MILLION)
6.3 XG-PON
6.3.1 XG-PON TECHNOLOGY HELD SECOND-LARGEST SIZE OF GPON MARKET IN 2019
TABLE 6 XG-PON TECHNOLOGY MARKET, BY COMPONENT, 2018–2025 (USD MILLION)
TABLE 7 XG-PON TECHNOLOGY MARKET, BY APPLICATION, 2018–2025 (USD MILLION)
TABLE 8 XG-PON TECHNOLOGY MARKET, BY REGION, 2018–2025 (USD MILLION)
6.4 XGS-PON
6.4.1 HIGHER BANDWIDTH AND SPEED OF XGS-PON MAKES IT MORE SUITABLE FOR 5G MOBILE NETWORKS
TABLE 9 XGS-PON TECHNOLOGY MARKET, BY COMPONENT, 2018–2025 (USD MILLION)
TABLE 10 XGS-PON TECHNOLOGY MARKET, BY APPLICATION, 2018–2025 (USD MILLION)
TABLE 11 XGS-PON TECHNOLOGY MARKET, BY REGION, 2018–2025 (USD MILLION)
6.5 NG-PON2
6.5.1 MARKET FOR NG-PON2 TO GROW AT HIGHEST RATE DURING 2020–2025
TABLE 12 NG-PON2 TECHNOLOGY MARKET, BY COMPONENT, 2018–2025 (USD MILLION)
TABLE 13 NG-PON2 TECHNOLOGY MARKET, BY APPLICATION, 2018–2025 (USD MILLION)
TABLE 14 NG-PON2 TECHNOLOGY MARKET, BY REGION, 2018–2025 (USD MILLION)
7 GPON MARKET, BY COMPONENT (Page No. - 60)
7.1 INTRODUCTION
FIGURE 21 GPON MARKET, BY COMPONENT
FIGURE 22 OPTICAL LINE TERMINALS TO WITNESS HIGHER CAGR IN MARKET DURING FORECAST PERIOD
TABLE 15 MARKET, BY COMPONENT, 2018–2025 (USD MILLION)
TABLE 16 MARKET, BY COMPONENT, 2018–2025 (MILLION UNITS)
7.2 OPTICAL LINE TERMINAL (OLT)
7.2.1 HIGH BANDWIDTH REQUIREMENT AND RAPID ADVANCEMENTS IN MOBILE NETWORK TECHNOLOGIES TO FUEL GROWTH OF OLT COMPONENT
TABLE 17 MARKET FOR OLT COMPONENT, BY TECHNOLOGY, 2018–2025 (USD MILLION)
TABLE 18 MARKET FOR OLT COMPONENT, BY APPLICATION, 2018–2025 (USD MILLION)
TABLE 19 MARKET FOR OLT COMPONENT, BY REGION, 2018–2025 (USD MILLION)
7.3 OPTICAL NETWORK TERMINAL (ONT)
7.3.1 INCREASE IN PENETRATION OF ONT IN FTTX NETWORKS TO BOOST ONT MARKET GROWTH
TABLE 20 MARKET FOR ONT COMPONENT, BY TECHNOLOGY, 2018–2025 (USD MILLION)
TABLE 21 MARKET FOR ONT COMPONENT, BY APPLICATION, 2018–2025 (USD MILLION)
TABLE 22 MARKET FOR ONT, BY REGION, 2018–2025 (USD MILLION)
8 GPON MARKET, BY APPLICATION (Page No. - 65)
8.1 INTRODUCTION
FIGURE 23 GPON MARKET, BY APPLICATION
FIGURE 24 MOBILE BACKHAUL APPLICATION TO EXHIBIT HIGHEST CAGR IN MARKET DURING FORECAST PERIOD
TABLE 23 MARKET, BY APPLICATION, 2018–2025 (USD MILLION)
TABLE 24 MARKET, BY APPLICATION, 2018–2025 (MILLION UNITS)
8.2 FTTH
8.2.1 INCREASING NUMBER OF FTTH SUBSCRIBERS
TABLE 25 MARKET FOR FTTH APPLICATION, BY TECHNOLOGY, 2018–2025 (USD MILLION)
TABLE 26 MARKET FOR FTTH APPLICATION, BY COMPONENT, 2018–2025 (USD MILLION)
TABLE 27 MARKET FOR FTTH APPLICATION, BY REGION, 2018–2025 (USD MILLION)
8.3 OTHER FTTX
8.3.1 RISING DEMAND OF TRIPLE-AND QUAD-PLAY SERVICES
TABLE 28 MARKET FOR OTHER FTTX APPLICATION, BY TECHNOLOGY, 2018–2025 (USD MILLION)
TABLE 29 MARKET FOR OTHER FTTX APPLICATION, BY COMPONENT, 2018–2025 (USD MILLION)
TABLE 30 MARKET FOR OTHER FTTX APPLICATION, BY REGION, 2018–2025 (USD MILLION)
8.4 MOBILE BACKHAUL
8.4.1 INCREASING BANDWIDTH CAPACITY AND REDUCING OPERATIONAL COSTS OF GPON
TABLE 31 MARKET FOR MOBILE BACKHAUL APPLICATION, BY TECHNOLOGY, 2018–2025 (USD MILLION)
TABLE 32 MARKET FOR MOBILE BACKHAUL APPLICATION, BY COMPONENT, 2018–2025 (USD MILLION)
TABLE 33 MARKET FOR MOBILE BACKHAUL APPLICATION, BY REGION, 2018–2025 (USD MILLION)
9 GPON MARKET, BY VERTICAL (Page No. - 72)
9.1 INTRODUCTION
FIGURE 25 GPON MARKET, BY VERTICAL
FIGURE 26 TRANSPORTATION VERTICAL TO WITNESS HIGHEST CAGR IN MARKET DURING FORECAST PERIOD
TABLE 34 MARKET, BY VERTICAL, 2018–2025 (USD MILLION)
9.2 RESIDENTIAL
9.2.1 USE OF GPON FOR HIGH-SPEED DATA, IPTV, VOICE, AND CATV SERVICES IN RESIDENTIAL VERTICAL
9.3 TELECOMMUNICATIONS
9.3.1 HIGH DEMAND FROM NETWORK SERVICE PROVIDERS TO EXPAND THEIR MOBILE BACKHAULING CAPACITY
9.4 TRANSPORTATION
9.4.1 GROWTH IN IOT APPLICATIONS IN PUBLIC AND PRIVATE TRANSPORTATION
9.5 ENERGY & UTILITIES
9.5.1 IMPLEMENTATION OF SMART GRIDS TO SURGE GPON DEMAND IN ENERGY & UTILITIES
9.6 HEALTHCARE
9.6.1 USE OF GPON TO IMPROVE OPERATIONAL EFFICIENCY OF ALL STAKEHOLDERS INVOLVED IN VALUE CHAIN OF HEALTHCARE VERTICAL
9.7 COMMERCIAL
9.7.1 MANUFACTURING INDUSTRIES AND BUSINESS SERVICES ARE MAJOR SEGMENTS OF COMMERCIAL VERTICALS USING GPON
10 GPON SERVICES (Page No. - 78)
10.1 INTRODUCTION
10.2 FIXED INTERNET AND VOICE
10.3 INTERNET PROTOCOL TV (IPTV)
10.4 MOBILE VOICE AND INTERNET
11 GEOGRAPHIC ANALYSIS (Page No. - 79)
11.1 INTRODUCTION
FIGURE 27 GEOGRAPHIC SNAPSHOT: BRAZIL TO REGISTER HIGHEST CAGR IN GLOBAL GPON MARKET DURING 2020–2025
FIGURE 28 MARKET IN ROW TO GROW AT HIGHEST CAGR DURING FORECAST PERIOD
TABLE 35 MARKET, BY REGION, 2018–2025 (USD MILLION)
TABLE 36 MARKET, BY REGION, 2018–2025 (MILLION UNITS)
11.2 NORTH AMERICA
FIGURE 29 SNAPSHOT: GPON MARKET IN NORTH AMERICA
FIGURE 30 MEXICO TO RECORD HIGHEST CAGR IN MARKET IN NORTH AMERICA DURING FORECAST PERIOD
TABLE 37 MARKET IN NORTH AMERICA, BY COUNTRY, 2018–2025 (USD MILLION)
TABLE 38 MARKET IN NORTH AMERICA, BY COMPONENT, 2018–2025 (USD MILLION)
11.2.1 US
11.2.1.1 US to continue to hold second-largest share of market globally during forecast period
TABLE 39 MARKET IN US, BY COMPONENT, 2018–2025 (USD MILLION)
11.2.2 CANADA
11.2.2.1 Canada to continue to account for second-largest share of North American market
TABLE 40 MARKET IN CANADA, BY COMPONENT, 2018–2025 (USD MILLION)
11.2.3 MEXICO
11.2.3.1 Mexico to be fastest-growing market in North America owing to for foreign investments in telecom sector
TABLE 41 MARKET IN MEXICO, BY COMPONENT, 2018–2025 (USD MILLION)
11.3 EUROPE
FIGURE 31 SNAPSHOT: GPON MARKET IN EUROPE
FIGURE 32 MARKET IN ITALY TO GROW AT HIGHEST CAGR DURING FORECAST PERIOD
TABLE 42 MARKET IN EUROPE, BY COUNTRY, 2018–2025 (USD MILLION)
TABLE 43 MARKET IN EUROPE, BY COMPONENT, 2018–2025 (USD MILLION)
11.3.1 RUSSIA
11.3.1.1 Russia to continue to account for largest share of European market
TABLE 44 MARKET IN RUSSIA, BY COMPONENT, 2018–2025 (USD MILLION)
11.3.2 SPAIN
11.3.2.1 Growth in FTTH connections is fostering demand for ONT installations
TABLE 45 MARKET IN SPAIN, BY COMPONENT, 2018–2025 (USD MILLION)
11.3.3 FRANCE
11.3.3.1 Large base of mobile users availing 4G network services propelling growth of GPON market in France
TABLE 46 MARKET IN FRANCE, BY COMPONENT, 2018–2025 (USD MILLION)
11.3.4 UKRAINE
11.3.4.1 Investments from telecom companies in building optical fiber network infrastructure surging demand for GPON technology
TABLE 47 MARKET IN UKRAINE, BY COMPONENT, 2018–2025 (USD MILLION)
11.3.5 ROMANIA
11.3.5.1 Increased use of GPON infrastructure to develop transportation, power & utilities, and healthcare industries in Romania
TABLE 48 MARKET IN ROMANIA, BY COMPONENT, 2018–2025 (USD MILLION)
11.3.6 PORTUGAL
11.3.6.1 Growing demand for broadband services and expanding FTTH subscriber base to foster market growth in Portugal
TABLE 49 MARKET IN PORTUGAL, BY COMPONENT, 2018–2025 (USD MILLION)
11.3.7 ITALY
11.3.7.1 Rapid expansion of GPON infrastructure in Italy
TABLE 50 MARKET IN ITALY, BY COMPONENT, 2018–2025 (USD MILLION)
11.3.8 REST OF EUROPE (ROE)
TABLE 51 MARKET IN REST OF EUROPE, BY COMPONENT, 2018–2025 (USD MILLION)
11.4 APAC
FIGURE 33 SNAPSHOT: GPON MARKET IN APAC
FIGURE 34 INDONESIA TO EXHIBIT HIGHEST CAGR IN MARKET IN APAC DURING FORECAST PERIOD
TABLE 52 MARKET IN APAC, BY COUNTRY, 2018–2025 (USD MILLION)
TABLE 53 MARKET IN APAC, BY COMPONENT, 2018–2025 (USD MILLION)
11.4.1 CHINA
11.4.1.1 China to hold largest share of global GPON market throughout forecast period
TABLE 54 MARKET IN CHINA, BY COMPONENT, 2018–2025 (USD MILLION)
11.4.2 JAPAN
11.4.2.1 High penetration of FTTH and increased adoption of 4K TV content
TABLE 55 MARKET IN JAPAN, BY COMPONENT, 2018–2025 (USD MILLION)
11.4.3 REPUBLIC OF KOREA
11.4.3.1 Increased government spending on network infrastructure and penetration of mobile network applications
TABLE 56 MARKET IN REPUBLIC OF KOREA, BY COMPONENT, 2018–2025 (USD MILLION)
11.4.4 INDONESIA
11.4.4.1 Rising government spending to expand optical fiber networks
TABLE 57 MARKET IN INDONESIA, BY COMPONENT, 2018–2025 (USD MILLION)
11.4.5 THAILAND
11.4.5.1 Auctioning of 5G spectrum by Thailand government
TABLE 58 MARKET IN THAILAND, BY COMPONENT, 2018–2025 (USD MILLION)
11.4.6 TAIWAN
11.4.6.1 Rise in penetration of FTTH in Taiwan
TABLE 59 MARKET IN TAIWAN, BY COMPONENT, 2018–2025 (USD MILLION)
11.4.7 REST OF APAC
TABLE 60 MARKET IN REST OF APAC, BY COMPONENT, 2018–2025 (USD MILLION)
11.5 ROW
FIGURE 35 BRAZIL TO REGISTER HIGHEST CAGR IN GPON MARKET IN ROW DURING FORECAST PERIOD
TABLE 61 MARKET IN ROW, BY GEOGRAPHY, 2018–2025 (USD MILLION)
TABLE 62 MARKET IN ROW, BY COMPONENT, 2018–2025 (USD MILLION)
11.5.1 TURKEY
11.5.1.1 Turkey accounted for larger share of GPON market in RoW
TABLE 63 MARKET IN TURKEY, BY COMPONENT, 2018–2025 (USD MILLION)
11.5.2 SAUDI ARABIA
11.5.2.1 Increasing adoption of internet connection on mobile devices
TABLE 64 MARKET IN SAUDI ARABIA, BY COMPONENT, 2018–2025 (USD MILLION)
11.5.3 AFRICA
11.5.3.1 Improved data connectivity and increased mobile penetration
TABLE 65 MARKET IN AFRICA, BY COMPONENT, 2018–2025 (USD MILLION)
11.5.4 BRAZIL
11.5.4.1 Brazil accounted for larger share of GPON market in South America
TABLE 66 MARKET IN BRAZIL, BY COMPONENT, 2018–2025 (USD MILLION)
11.5.5 REST OF SOUTH AMERICA
11.5.5.1 Uruguay, Chile, Columbia, Argentina, Chile, and Ecuador contribute to growth of market in Rest of South America
TABLE 67 MARKET IN REST OF SOUTH AMERICA, BY COMPONENT, 2018–2025 (USD MILLION)
11.5.6 REST OF MIDDLE EAST
11.5.6.1 Deployment of National Broadband Networks and development of smart cities
TABLE 68 MARKET IN REST OF MIDDLE EAST, BY COMPONENT, 2018–2025 (USD MILLION)
12 COMPETITIVE LANDSCAPE (Page No. - 102)
12.1 OVERVIEW
FIGURE 36 KEY DEVELOPMENTS IN MARKET (2017 TO 2019)
12.2 MARKET RANKING ANALYSIS: GPON MARKET
FIGURE 37 RANKING OF KEY PLAYERS IN MARKET, 2019
12.3 COMPETITIVE LEADERSHIP MAPPING, 2019
12.3.1 VISIONARIES
12.3.2 INNOVATORS
12.3.3 DYNAMIC DIFFERENTIATORS
12.3.4 EMERGING COMPANIES
FIGURE 38 COMPETITIVE LEADERSHIP MAPPING IN GPON MARKET, 2019
12.4 STRENGTH OF PRODUCT PORTFOLIO (FOR 26 COMPANIES)
12.5 BUSINESS STRATEGY EXCELLENCE (FOR 26 COMPANIES)
12.6 COMPETITIVE SITUATIONS AND TRENDS
12.6.1 CONTRACTS, COLLABORATIONS, AGREEMENTS, AND PARTNERSHIPS
TABLE 69 CONTRACTS, COLLABORATIONS, AGREEMENTS, AND PARTNERSHIPS, 2017–2020
12.6.2 PRODUCT LAUNCHES AND DEVELOPMENTS
TABLE 70 PRODUCT LAUNCHES AND DEVELOPMENTS, 2017–2020
12.6.3 ACQUISITIONS
TABLE 71 ACQUISITIONS, 2019
13 COMPANY PROFILES (Page No. - 111)
(Business Overview, Products Offered, Recent Developments, SWOT Analysis, and MnM View)*
13.1 KEY PLAYERS
13.1.1 HUAWEI
FIGURE 39 HUAWEI: COMPANY SNAPSHOT
13.1.2 NOKIA
FIGURE 40 NOKIA: COMPANY SNAPSHOT
13.1.3 ZTE
FIGURE 41 ZTE: COMPANY SNAPSHOT
13.1.4 FIBERHOME
13.1.5 DASAN ZHONE
FIGURE 42 DASAN ZHONE: COMPANY SNAPSHOT
13.1.6 CALIX
FIGURE 43 CALIX: COMPANY SNAPSHOT
13.1.7 ADTRAN
FIGURE 44 ADTRAN: COMPANY SNAPSHOT
13.1.8 CISCO
FIGURE 45 CISCO: COMPANY SNAPSHOT
13.1.9 NEC
FIGURE 46 NEC: COMPANY SNAPSHOT
13.1.10 ALLIED TELESIS
FIGURE 47 ALLIED TELESIS: COMPANY SNAPSHOT
13.1.11 ISKRATEL
13.1.12 UNIZYX
FIGURE 48 UNIZYX: COMPANY SNAPSHOT
13.1.13 ALPHION
13.1.14 TEJAS NETWORKS
FIGURE 49 TEJAS NETWORKS: COMPANY SNAPSHOT
13.2 RIGHT TO WIN
13.3 KEY INNOVATORS
13.3.1 ECONET
13.3.2 SHENZHEN GIGALIGHT
13.3.3 NCIS GROUP
13.3.4 GPONDOCTOR
13.3.5 SHENZHEN C-DATA
13.4 OTHER COMPANIES
13.4.1 TELLABS
13.4.2 FUJIKURA
13.4.3 UTSTARCOM
13.4.4 TP-LINK
13.4.5 GCOM TECHNOLOGIES
13.4.6 COMMVERGE
13.4.7 MULTICOM
*Details on Business Overview, Products Offered, Recent Developments, SWOT Analysis, and MnM View might not be captured in case of unlisted companies.
14 APPENDIX (Page No. - 147)
14.1 INSIGHTS OF INDUSTRY EXPERTS
14.2 DISCUSSION GUIDE - GPON MARKET
14.3 KNOWLEDGE STORE: MARKETSANDMARKETS’ SUBSCRIPTION PORTAL
14.4 AVAILABLE CUSTOMIZATIONS
14.5 RELATED REPORTS
14.6 AUTHOR DETAILS
The study involved four major activities for estimating the size of the global GPON market. Exhaustive secondary research has been conducted to collect information on the market. The next step involved has been validating these findings, assumptions, and sizing with industry experts across the value chain through primary research. Both top-down and bottom-up approaches have been employed to estimate the overall market size. After that, market breakdown and data triangulation techniques have been used to estimate the market size of segments and subsegments.
Secondary Research
In the secondary research process, various secondary sources have been referred to for identifying and collecting information important for this study. Secondary sources such as corporate filings (such as annual reports, investor presentations, and financial statements); trade, business, and professional associations; white papers and GPON-related journals and certified publications; articles of recognized authors; gold- and silver-standard websites; directories; and databases have been used to identify and collect information for an extensive technical and commercial study of the GPON market.
Primary Research
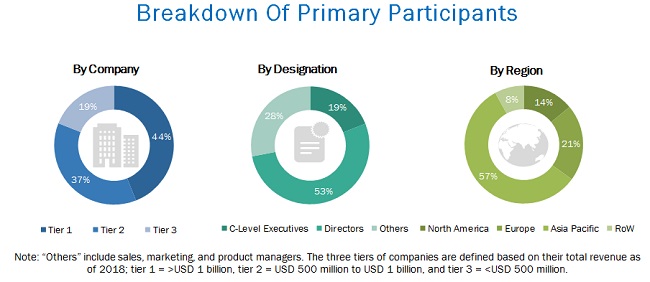
In the primary research process, primary sources from both supply and demand sides have been interviewed to obtain qualitative and quantitative information important for this report. Primary sources, such as experts from related industries and suppliers, have been interviewed to obtain and verify critical information, as well as assess prospects. Key players in the GPON market have been identified through secondary research, and their respective market rankings have been determined through primary and secondary research. This research included studying annual reports of top market players and interviewing key opinion leaders such as CEOs, directors, and marketing personnel.
To know about the assumptions considered for the study, download the pdf brochure
Market Size Estimation
In the complete market engineering process, both top-down and bottom-up approaches have been implemented, along with several data triangulation methods, to estimate and validate the size of the GPON market and other dependent submarkets listed in this report.
- Key players in the industry and markets have been identified through extensive secondary research.
- The industry’s supply chain and market size, in terms of value, have been determined through primary and secondary research.
- All percentage shares, splits, and breakdowns have been determined using secondary sources and verified through primary sources.
Data Triangulation
After arriving at the overall market size, the total market has been split into several segments. To complete the overall market engineering process and arrive at exact statistics for all segments, market breakdown, and data triangulation procedures have been employed, wherever applicable. The data has been triangulated by studying various factors and trends from both the demand and supply sides. The market has also been validated using both top-down and bottom-up approaches.
Study Objectives:
- To describe and forecast the GPON market, by component, technology, application, vertical, and geography
- To describe and forecast the market size for various segments with regard to four main regions-North America, Europe, Asia Pacific (APAC), and Rest of the World (RoW)
- To provide detailed information regarding drivers, restraints, opportunities, and challenges influencing the growth of the GPON market
- To strategically analyze micromarkets1 with respect to growth trends, prospects, and contributions to the total market
- To analyze opportunities for stakeholders by identifying high-growth segments within the GPON market
- To study the complete value chain and allied industry segments and perform a value chain analysis of the GPON ecosystem
- To analyze competitive developments such as partnerships, mergers and acquisitions, product launches, and research and development (R&D) in the GPON market
Available Customizations:
With the given market data, MarketsandMarkets offers customizations according to a company’s specific needs. The following customization options are available for the GPON market report.
Company information:
- Detailed analysis and profiling of additional market players (up to 5)


Growth opportunities and latent adjacency in GPON Market
To understand what is the market trends and products platform. Is COB products gaining more in this PON markets replacing GTMS packages?
We are manufacturer of semiconductor lasers, and like to better understand the market for such lasers to the GPON market for FTTx and 5G NR LTE.
We are start-up company for Gpon market, we will like to be the leading Gpon CPE supplier in the world.