Graphene Battery Market by Type (Lithium-Ion Graphene Battery, Lithium-Sulfur Graphene Battery, Graphene Supercapacitor), End-Use Industry (Consumer Electronics, Automotive, Industrial, Power), Region - Global Forecast to 2030


Updated on : March 31, 2023
Graphene Battery Market
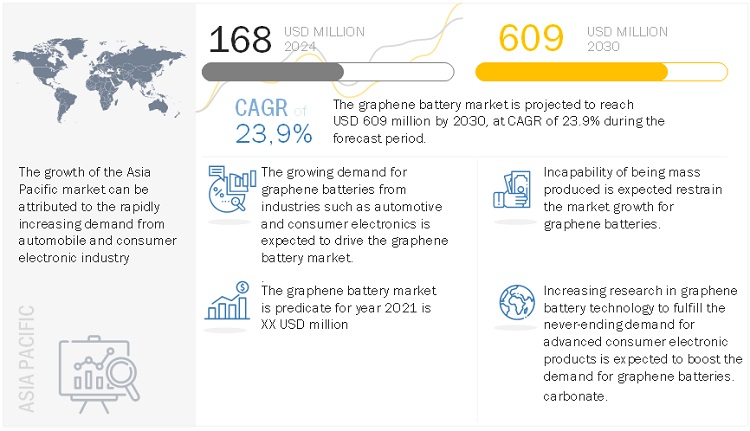
The global graphene battery market is projected to grow from USD 168 million in 2024 to USD 609 million by 2030, at a cagr 23.9% from 2024 to 2030. The market growth is driven by the growth of automotive sector, especially electric vehicles and increasing demand for this battery in consumer electronics.
Global Graphene Battery Market Trends
To know about the assumptions considered for the study, Request for Free Sample Report
Graphene Battery Market Dynamics
Driver: Increasing focus on R&D activities
Continuous R&D activities are adopted across the globe to make graphene more flexible and efficient for use in applications such as batteries, wearables, inks, construction, among others. Various universities and research institutions are working on graphene-based derivatives, including graphene oxides, graphene nanoplates, and graphene anodes. To improve the for usage of graphene in energy storage systems such as batteries and supercapacitors, many leading consumer electronics and automobile companies are investing in R&D activities.
Restraint: Incapability of mass production
There are various reasons obstructing the mass production of graphene batteries such as cost-intensive and time-consuming manufacturing process, maintaining the quality of large quantities of graphene, and up-scaling the graphene production. The electrical conductivity, transparency, thermal conductivity, and impermeability properties of graphene is affected due to any production damage.
Opportunity: Increase in patent activities
The leaders in graphene battery patent applications are companies from end-use industries such as Samsung SDI (South Korea), LG Chem (South Korea), and IBM (US), with LG Chem having filed approximately 19 patents. Patenting activities related to graphene for battery applications have been increasing at a high rate every year. These increase in patent filings create immense opportunity for the market growth of graphene batteries in various end-use industries.
Challenge: High production cost
The cost of graphene battery is directly related to its raw material graphene. The high cost of graphene battery is attributed to the high production cost of graphene and its derivatives. The single-layer high-quality graphene sheets are very expensive, with limited production volume. Thus, increasing the production cost of graphene batteries.
Based on end-use industry, the automotive segment is estimated to account for the largest market share in 2021
Based on the end-use industry, the automotive segment is expected to account for the largest share of the graphene battery industry in 2021. The need for high power and energy density has created a demand for reliable and safe batteries for sectors such as automotive and consumer electronics, ultimately driving the growth of the graphene battery market. The automotive segment is forecasted to have the highest growth rate owing to the rise in the demand for electric vehicles due to environmental concerns and awareness about clean and sustainable fuel.
Based on type, the lithium-ion graphene battery segment is estimated to account for the largest market share in 2021
Based on type, the lithium-ion graphene battery segment is expected to account for the largest share of the graphene battery market in 2021. Graphene lithium-ion batteries are light, durable, and suitable for high-capacity energy storage, as well as shorter charging times which makes it ideal for end-use industries such as consumer electronics, automotive, industrial, and power. The lithium-ion graphene battery segment is forecasted to have the highest growth rate owing to the increasing demand for lithium-ion batteries compared to other batteries due to its various applications in the consumer electronics and automotive industries.
Asia Pacific is estimated to account for the largest share of the graphene battery market in 2021
Based on the region, Asia Pacific region is expected to account for the largest share of the graphene battery industry in 2021. China, Japan, and South Korea are key countries contributing to the increased demand for graphene batteries in this region. In China, Japan and South Korea along with electric vehicles, graphene battery is used in consumer electronics. Europe is estimated to have the second-largest share of the global graphene battery market in 2021.
Graphene Battery Market Players
Samsung SDI (South Korea), Huawei Technologies Co., Ltd. (China), Log 9 Materials Scientific Private Limited (India), Cabot Corporation (US), Grabat Graphenano Energy (Spain), Nanotech Energy (US), Nanotek Instruments, Inc. (US), XG Sciences, Inc. (US), ZEN Graphene Solutions Ltd. (Canada), Graphene NanoChem (Malaysia), Global Graphene Group (US), Vorbeck Materials Corp. (US), Graphenea Group (Spain), Hybrid Kinetic Group Ltd. (Hong Kong) and Targray Group (Canada) are some of the leading players operating in the graphene battery market.
Read More: Graphene Battery Companies
To know about the assumptions considered for the study, download the pdf brochure
Graphene Battery Market Report Scope
|
Report Metric |
Details |
|
Market Size Available for Years |
2021-2030 |
|
Base Year Considered |
2021 |
|
Forecast Period |
2024–2030 |
|
Forecast Units |
Value (USD Million) |
|
Segments Covered |
Type, and end-use industry |
|
Geographies Covered |
North America, Asia Pacific, Europe, the Middle East & Africa, and South America |
|
Companies Covered |
Samsung SDI (South Korea), Huawei Technologies Co., Ltd. (China), Log 9 Materials Scientific Private Limited (India), Cabot Corporation (US), Grabat Graphenano Energy (Spain), Nanotech Energy (US), Nanotek Instruments, Inc. (US), XG Sciences, Inc. (US), ZEN Graphene Solutions Ltd. (Canada), Graphene NanoChem (Malaysia), Global Graphene Group (US), Vorbeck Materials Corp. (US), Graphenea Group (Spain), Hybrid Kinetic Group Ltd. (Hong Kong) and Targray Group (Canada), among others |
This research report categorizes the graphene battery market based on type, end-use industry and region and forecasts revenues as well as analyzes trends in each of these submarkets.
Based on the Type
- Lithium-ion Graphene Battery
- Graphene Supercapacitor
- Lithium-Sulfur Graphene Battery
- Others
Based on the End-Use Industry
- Automotive
- Consumer Electronics
- Power
- Industrial
- Others
Based on the Region
- Asia Pacific
- North America
- Europe
- Middle East & Africa
- South America
Recent Developments
- In December 2018, Log 9 Materials Scientific Private Limited (India) announced that they are working on graphene-based metal-air battery. The metal-air battery uses metal as the anode, oxygen as the cathode and water as an electrolyte. A graphene rod is used as the cathode of the battery. Since oxygen has to be used as the cathode, the cathode material has to be porous to let the air pass, a property in which graphene excels. According to Log 9 Materials, the graphene used in the electrode can increase the battery efficiency by five times at one-third the cost
- In November 2017, Samsung SDI (South Korea), in collaboration with Samsung Advanced Institute of Technology (SAIT), developed a unique "graphene ball" that could make lithium-ion batteries last longer and charge faster. Samsung Advanced Institute of Technology (SAIT) said that using the new graphene ball material to make batteries will increase their capacity by 45% and make their charging speed five times faster. It was also said that this battery would be able to maintain a temperature of 60 degrees Celsius that is required for use in electric cars.
Frequently Asked Questions (FAQ):
What are the major types of graphene batteries?
Lithium-ion graphene battery, graphene supercapacitor, lithium-sulfur graphene battery are the major types of graphene batteries
Which is the major end-use industry of graphene batteries?
Automotive is the major end-use industry of graphene batteries.
What is the major challenge in graphene battery market?
High production cost of graphene batteries.
What is the estimated size of the graphene battery industry in 2021?
The market size of graphene battery is 89 USD million in 2021
Who are the key players in the graphene battery market?
The key players are Samsung SDI (South Korea), Huawei Technologies Co., Ltd. (China), Log 9 Materials Scientific Private Limited (India), Cabot Corporation (US), Grabat Graphenano Energy (Spain), Nanotech Energy (US), Nanotek Instruments, Inc. (US), XG Sciences, Inc. (US), ZEN Graphene Solutions Ltd. (Canada), Graphene NanoChem (Malaysia), Global Graphene Group (US), Vorbeck Materials Corp. (US), Graphenea Group (Spain), Hybrid Kinetic Group Ltd. (Hong Kong) and Targray Group (Canada). .
To speak to our analyst for a discussion on the above findings, click Speak to Analyst
 Exclusive indicates content/data unique to MarketsandMarkets and not available with any competitors.
Table of Contents
1 Introduction (Page No. - 13)
1.1 Objectives of the Study
1.2 Market Definition
1.3 Market Scope
1.3.1 Markets Covered
1.3.2 Years Considered for the Study
1.4 Currency
1.5 Limitations
1.6 Stakeholders
2 Research Methodology (Page No. - 16)
2.1 Research Data
2.1.1 Key Data From Secondary Sources
2.1.2 Key Data From Primary Sources
2.1.2.1 Key Industry Insights
2.2 Market Size Estimation
2.3 Data Triangulation
2.4 Assumptions
3 Executive Summary (Page No. - 23)
4 Premium Insights (Page No. - 28)
4.1 Attractive Opportunities in Graphene Battery Market
4.2 Graphene Battery Market, By Region
4.3 Asia Pacific Graphene Battery Market, By Type & Country
4.4 Graphene Battery Market, By Major Countries
5 Market Overview (Page No. - 31)
5.1 Introduction
5.2 Market Dynamics
5.2.1 Drivers
5.2.1.1 Advantages Over Other Battery Materials
5.2.1.2 Increasing Focus on R&D Activities
5.2.2 Restraints
5.2.2.1 Incapability of Mass Production
5.2.3 Opportunities
5.2.3.1 Increasing Patents
5.2.4 Challenges
5.2.4.1 High Production Cost
5.3 Economic Indicators
5.3.1 Industry Outlook
5.3.1.1 Electric Vehicles
5.4 Graphene Battery Patent Analysis
5.4.1 Publication Trends – 2015–2019
5.4.2 Insight
5.4.3 Trend Analysis and Geographical Representation
5.4.4 Top Assignees
6 Graphene Battery Market, By Type (Page No. - 38)
6.1 Introduction
6.2 Lithium-Ion Graphene Battery
6.3 Graphene Supercapacitor
6.4 Lithium-Sulfur Graphene Battery
6.5 Others
7 Graphene Battery Market, By End-Use Industry (Page No. - 43)
7.1 Introduction
7.2 Automotive
7.2.1 Battery Electric Vehicles
7.2.1.1 Graphene Batteries Provide High Thermal Stability and are Safe for Use in Electric Vehicles
7.2.2 Plug-In Hybrid Electric Vehicles
7.2.2.1 Low Self-Discharge Rate, High Output, and High Energy Density are Driving the Adoption of Graphene Batteries in Hybrid Electric Vehicles
7.3 Consumer Electronics
7.3.1 Smartphones
7.3.2 UPS
7.3.3 Laptops
7.4 Industrial
7.4.1 Mining Equipment
7.4.2 Construction Equipment
7.5 Power
7.6 Others
8 Regional Analysis (Page No. - 50)
8.1 Introduction
8.2 Asia Pacific
8.3 North America
8.4 Europe
8.5 Rest of the World (RoW)
9 Competitive Landscape (Page No. - 61)
9.1 Introduction
9.2 Overview
9.3 Competitive Situations & Trends
9.3.1 Product Launches
9.3.2 Partnerships
9.3.3 Contracts
9.3.4 Agreements
9.3.5 Expansions
9.3.6 Collaborations
9.3.7 Product Developments
9.3.8 Investments
10 Company Profiles (Page No. - 67)
(Business Overview, Products Offered, Recent Developments, SWOT Analysis, MnM View)*
10.1 Graphenano Nanotechnologies
10.2 Nanograf Technologies
10.3 Global Graphene Group
10.4 XG Sciences
10.5 Graphene 3D Lab, Inc.
10.6 Samsung SDI
10.7 Huawei
10.8 Hybrid Kinetic Group Ltd.
10.9 Vorbeck Materials
10.10 Elcora Advanced Materials Corp.
10.11 Nanotek Instruments, Inc.
10.12 Graphene Batteries AS
10.13 Nanotech Energy, Inc.
10.14 ZEN Graphene Solutions Ltd.
*Details on Business Overview, Products Offered, Recent Developments, SWOT Analysis, MnM View Might Not Be Captured in Case of Unlisted Companies.
11 Appendix (Page No. - 88)
11.1 Discussion Guide
11.2 Knowledge Store: Marketsandmarkets Subscription Portal
11.3 Available Customizations
11.4 Related Reports
11.5 Author Details
List of Tables (36 Tables)
Table 1 Graphene Battery Market Snapshot
Table 2 List of Patents
Table 3 Graphene Battery Market, By Type, 2021–2030 (USD Million)
Table 4 Lithium-Ion Graphene Battery Market, By Region, 2021–2030 (USD Million)
Table 5 Graphene Supercapacitor Market, By Region, 2021–2030 (USD Million)
Table 6 Lithium-Sulfur Graphene Battery Market, By Region, 2021–2030 (USD Million)
Table 7 Other Graphene Battery Types Market, By Region, 2017–2024 (USD Million)
Table 8 Graphene Battery Market, By End-Use Industry, 2021–2039 (USD Million)
Table 9 Graphene Battery Market in Automotive, By Region, 2021–2030 (USD Million)
Table 10 Graphene Battery Market in Consumer Electronics, By Region, 2021–2030 (USD Million)
Table 11 Graphene Battery Market in Industrial, By Region, 2021–2030 (USD Million)
Table 12 Graphene Battery Market in Power, By Region, 2021–2030 (USD Million)
Table 13 Graphene Battery Market in Other End-Use Industries, By Region, 2021–2030 (USD Million)
Table 14 Graphene Battery Market Size, By Region, 2021–2030 (USD Million)
Table 15 Graphene Battery Market Size, By Type, 2021–2030 (USD Million)
Table 16 Graphene Battery Market Size, By End-Use Industry, 2021–2030 (USD Million)
Table 17 Asia Pacific: Graphene Battery Market Size, By Country, 2021–2030 (USD Million)
Table 18 Asia Pacific: Graphene Battery Market Size, By Type, 2021–2030 (USD Million)
Table 19 Asia Pacific: Graphene Battery Market Size, By End-Use Industry, 2021–2030 (USD Million)
Table 20 North America: Graphene Battery Market Size, By Country, 2021–2030 (USD Million)
Table 21 North America: Graphene Battery Market Size, By Type, 2021–2030 (USD Million)
Table 22 North America: Graphene Battery Market Size, By End-Use Industry, 2021–2030 (USD Million)
Table 23 Europe: Graphene Battery Market Size, By Country, 2021–2030 (USD Million)
Table 24 Europe: Graphene Battery Market Size, By Type, 2021–2030 (USD Million)
Table 25 Europe: Graphene Battery Market Size, By End-Use Industry, 2021–2030 (USD Million)
Table 26 RoW: Graphene Battery Market Size, By Region, 2021–2030 (USD Million)
Table 27 RoW: Graphene Battery Market Size, By Type, 2021–2030 (USD Million)
Table 28 RoW: Graphene Battery Market Size, By End-Use Industry, 2021–2030 (USD Million)
Table 29 Product Launches, 2014–2019
Table 30 Partnerships, 2014–2019
Table 31 Contracts, 2014–2019
Table 32 Agreements, 2014–2019
Table 33 Expansions, 2014–2019
Table 34 Collaborations, 2014–2019
Table 35 Product Developments, 2014–2019
Table 36 Investments, 2014–2019
List of Figures (34 Figures)
Figure 1 Graphene Battery Market Segmentation
Figure 2 Graphene Battery Market: Research Design
Figure 3 Breakdown of Primary Interviews
Figure 4 Bottom-Up Approach
Figure 5 Top-Down Approach
Figure 6 Graphene Battery Market: Data Triangulation
Figure 7 Asia Pacific Estimated to Account for Largest Share of Graphene Market in 2021
Figure 8 Automotive End-Use Industry Segment Estimated to Account for Largest Share of Graphene Battery Market in 2021
Figure 9 Lithium-Ion Graphene Battery Segment Estimated to Account for Largest Share of Graphene Battery Market in 2021
Figure 10 Growing Demand for Electric Vehicles Expected to Drive Graphene Battery Market From 2024 to 2030
Figure 11 Graphene Battery Market in Asia Pacific Projected to Grow at Highest Rate During Forecast Period
Figure 12 Lithium-Ion Graphene Battery Type and China are Estimated to Account for Largest Share of Asia Pacific Graphene Battery Market in 2021
Figure 13 Graphene Battery Market in China Projected to Grow at Highest Cagr From 2024 to 2030
Figure 14 Graphene Battery Market: Drivers, Restraints, Opportunities & Challenges
Figure 15 Electric Vehicle Sales, 2010–2018
Figure 16 Country-Wise Electric Vehicle Sales, 2018
Figure 17 Increase in Patent Filings Related to Batteries With Graphene From 2015 to 2019.
Figure 18 Filings By Jurisdiction
Figure 19 Graphene Battery Patent Top Assignees
Figure 20 Graphene Battery Market, By Type, 2024 & 2030 (USD Million)
Figure 21 Graphene Battery Market, By End-Use Industry, 2024 & 2030 (USD Million)
Figure 22 Regional Snapshot: Asian Countries Such as India, China, and Japan to Offer Lucrative Growth Opportunities in Graphene Battery Market During Forecast Period
Figure 23 Asia Pacific Graphene Battery Market Snapshot
Figure 24 North America Graphene Battery Market Snapshot
Figure 25 Europe Graphene Battery Market Snapshot
Figure 26 Key Growth Strategies Adopted By Companies in the Graphene Battery Market Between 2014 and 2019
Figure 27 Graphenano Nanotechnologies: SWOT Analysis
Figure 28 Global Graphene Group: SWOT Analysis
Figure 29 XG Sciences: Company Snapshot
Figure 30 XG Sciences: SWOT Analysis
Figure 31 Graphene 3D Lab, Inc.: Company Snapshot
Figure 32 Samsung SDI: Company Snapshot
Figure 33 Samsung SDI: SWOT Analysis
Figure 34 Huawei: Company Snapshot
This study involved four major activities in estimating the current size of the graphene battery market. Exhaustive secondary research was undertaken to collect information on the graphene battery industry, its peer markets, and its parent market. The next step was to validate these findings, assumptions, and sizing with the industry experts across the graphene battery value chain through primary research. Both the top-down and bottom-up approaches were employed to estimate the overall size of the market. After that, the market breakdown and data triangulation procedures were used to estimate the sizes of different segments and subsegments of the graphene battery market.
Secondary Research
As a part of the secondary research process, various secondary sources such as Hoovers, Bloomberg, BusinessWeek, Reuters, and Factiva were referred for identifying and collecting information for this study on the graphene battery market. Secondary sources included annual reports, press releases & investor presentations of companies, white papers, and certified publications, articles by recognized authors, authenticated directories, and databases.
Secondary research was conducted mainly to obtain key information about the supply chain of the industry, the monetary chain of the market, the total pool of players, and market classification and segmentation according to industry trends to the bottom-most level, regional markets, and key developments undertaken from both, market- and technology oriented perspectives.
Primary Research
As a part of the primary research process, various primary sources from both the supply and demand sides were interviewed to obtain qualitative and quantitative information for this report on the graphene battery market. Primary sources from the supply side included industry experts such as chief executive officers (CEOs), vice presidents, marketing directors, technology and innovation directors, and related key executives from various key companies and organizations operating in the graphene battery market. Primary sources from the demand side included directors, marketing heads, and purchase managers from various end-use industries. Following is the breakdown of the primary respondents.
To know about the assumptions considered for the study, download the pdf brochure
Market Size Estimation
Both top-down and bottom-up approaches were used to estimate and validate the total size of the graphene battery market. These methods were also used extensively to estimate the size of various segments and subsegments of the market. The research methodology used to estimate the market size included the following:
- The key players in the industry and markets were identified through extensive secondary research.
- The supply chain of the industry and the market size, in terms of value, were determined through primary and secondary research processes.
- All percentage shares, splits, and breakdowns were determined using secondary sources and verified through primary sources.
Data Triangulation
After arriving at the overall graphene battery market size from the market size estimation process explained above, the total market was split into several segments and subsegments. Data triangulation and market breakdown procedures were used, wherever applicable, to complete the overall market engineering process and arrive at the exact statistics for all segments and subsegments of the market. The data was triangulated by studying various factors and trends from both the demand and supply sides. In addition to this, the market size was validated using both top-down and bottom-up approaches.
Objectives of the Report
- To define, describe, and forecast the graphene battery market based on type, end-use industry, and region
- To forecast the size of the graphene battery market and its segments with respect to three main regions, namely, North America, Europe, and Asia Pacific
- To provide detailed information regarding the major factors, such as drivers, restraints, opportunities, and challenges, influencing the growth of the market
- To strategically analyze micro markets with respect to individual growth trends, future prospects, and contribution to the total market
- To analyze the opportunities in the market for stakeholders and provide a detailed competitive landscape for market leaders
- To strategically profile key players and comprehensively analyze their market share and core competencies
- To track and analyze competitive developments, such as expansions, new product developments, agreement, investments, and merger & acquisitions, in the graphene battery market
The following customization options are available for the report:
- Further breakdown of the Asia Pacific and Europe graphene battery markets
- Product matrix, which gives a detailed comparison of the product portfolio of each company
- Detailed analysis and profiles of additional market players (up to 3)


Growth opportunities and latent adjacency in Graphene Battery Market