Hernia Repair Market

Hernia Repair Market by Product (Mesh (Synthetic, Biologic), Suture (Absorbable, Non-Absorbable), Tack, Glue Applicator), Indication (Inguinal, Incisional, Umbilical, Epigastric, Femoral, Hiatal), Surgery, End User & Region - Global Forecast to 2029

Report Code: MD 4104 Feb, 2024, by marketsandmarkets.com

The global hernia repair market in terms of revenue was estimated to be worth $4.1 Billion in 2024 and is poised to reach $5.1 Billion by 2029, growing at a CAGR of 4.2% from 2024 to 2029. The new research study consists of an industry trend analysis of the market. The new research study consists of industry trends, pricing analysis, patent analysis, conference and webinar materials, key stakeholders, and buying behaviour in the market. During the forecast years, growth of the market is attributed to the increasing number of hernia repair procedures, increasing adoption of mesh in hernia repair surgeries, new product development, effectiveness of mesh repair, rising geriatric population, availability of reimbursement and technological advancement in the coming years.

Global Hernia Repair Market Trends

Hernia Repair Market

To know about the assumptions considered for the study, Request for Free Sample Report

Hernia Repair Market

Hernia Repair: Market Dynamics

Driver: Increasing hernia prevalence

The main driving force for the growth of the hernia mesh repair market is the growing prevalence of hernia. This is mainly attributed to the improvements in healthcare systems that have enabled the early detection and treatment of hernia, overall increase in population and specifically geriatric and obese population.

One factor contributing significantly to the risk of hernia is age, by retarding the body’s capabilities and natural healing abilities over time. According to a registered study in the UK, the prevalence of hernia was found to increase with age:


Age Group

Prevalence of Hernia

25–34

5%

35–44

10%

45-54

18%

55-64

24%

65-74

31%

In addition, the incidence of hernia was found to be 45% among men aged 75 years. Consequently, the growth in aging population can be expected to boost overall hernia incidence in the coming years.

Restraint: High costs of mesh repair and availability of less-expensive approaches

The material used in the development of hernia meshes significantly contribute to the cost of the meshes. Generally first generation meshes are used for the herniar repair procedures. For instance, the price of the mesh is USD 100–3,000 (and above), thus hernia mesh with advanced and specialized materials are too expensive to be used on a regular basis in developing markets. Though in developed countries mesh repair is relatively common, meshes are still unaffordable in countries with a per capita government healthcare expenditure below USD 50.  Further, fulfilling regulatory compliance and getting approvals for the mesh repair involves substantial costs. Hence, in Africa, mainly due to the higher cost of mesh repair, only 10% hernias cases are repaired with the usage of mesh.

Opportunity: Growth potential offered by emerging markets

Significant growth opportunities are offered by emerging markets such as China, India, Brazil, and Mexico, for players operating in the hernia mesh repair market due to their huge and increasing patient population, growing hernia prevalence, and developing healthcare infrastructure. For instance, in China and India, the number of hernia repair incident cases of inguinal, abdominal, and femoral hernias were around 1.95 million and 2.45 million respectively in 2019.

The availability of high-quality surgical treatment at comparatively lower costs has also led to an influx of medical tourists to these countries, which by itself has driven the adoption of advanced products and techniques in countries seeking to expand their medical tourism sector.

Additionally, Asia Pacific is more adaptive and business friendly due to its comparatively less stringent regulations and data requirements. Increasing competition in mature markets will further compel manufacturers of hernia meshes and mesh fixators to focus on emerging markets.

Challenge: Dearth of expertise in laparoscopic surgery

Compared to open hernia repair, laparoscopic surgeries lead to less postoperative pain, slimmer chances of wound infection, and early recovery. However, despite these advantages, the adoption of laparoscopic hernia repair is very low in many developing and developed countries. According to OECD, only 3–4% of hernia repair procedures performed in Spain and Italy are done laparoscopically. This is mainly caused due to a lack of sufficient experience in dealing with the technical issues governing laparoscopic procedures—such as difficulties in handling meshes laparoscopically and anatomic considerations (a smaller workspace, for example)—which result in a steep learning curve. Personnel may require as many as 20 cases to familiarize themselves with the differences in visualization and point of view required.

Hernia Repair Industry Ecosystem

Hernia Repair Market Ecosystem

By product, the mesh fixator segment of hernia repair industry is expected to grow at the highest rate during the forecast period.

Based on the product, the hernia repair market is segmented into mesh, sutures, mesh fixator, and other products. The hernia mesh segment is further categorized on the basis of type into synthetic and biologic mesh. The suture segment comprises of absorbable and non- absorbable suture. The hernia mesh fixator market is segmented into tack applicators and glue applicators. In 2023, the mesh fixator segment is expected to grow at the highest CAGR during the forecast period. The rising adoption of surgical glue as mesh fixators has led to the growth of the segment.

By clinical indication, the inguinal hernia segment accounted for the largest share of hernia repair industry during the forecast period.

Based on the clinical indication, the hernia repair market is segmented into ventral hernia, inguinal hernia, femoral hernia, hiatal hernia and other clinical indications. Ventral hernia is further sub-segmented into incisional, epigastric and umbilical hernia. The inguinal hernia segment accounts for the largest share of the market. Every year worldwide, a high number of inguinal hernia repair surgeries performed are expected to propel the growth of this segment during the forecast period.

By surgery type, the open surgery segment of hernia repair industry is expected to witness significant growth during the forecast period.

Based on the surgery type, the hernia repair market is segmented into laparoscopic surgery, open surgery and robotic surgery. The open surgery segment is expected to witness significant growth during the forecast period. The lower recurrence rate compared to other hernia repair surgery types has led to the significant growth and dominance of the segment in the industry in the upcoming years.

North America is expected to be the largest market of hernia repair industry during the forecast period.

Hernia Repair Market by Region

To know about the assumptions considered for the study, download the pdf brochure

The hernia repair market has been segmented into five major regions, namely, North America, Europe, the Asia Pacific, Latin America, and the Middle East & Africa. North America, comprising the US and Canada, held the largest share of the global market in 2023. On the other hand, the Asia Pacific market is estimated to register the highest growth rate during the forecast period. North America accounted for a share of 40% of the market, followed by Europe with a share of 27%. This region is witnessing growth due to presence of a large pool of hernia products and adoption of hernia mesh, particularly biologic mesh.

As of 2023, prominent players in the Hernia repair market are Ethicon Inc. (US), AbbVie Inc. (US), Medtronic plc (Ireland), Becton Dickinson and Company (US), Baxter International Inc. (US), B. Braun SE (Germany), W. L. Gore & Associates (US), Cook Group Inc (US) and Integra Lifesciences Holdings Corporation (US), among others.

Scope of the Hernia Repair Industry

Report Metric

Details

Market Revenue in 2023

$4.1 Billion

Projected Revenue by 2029

$5.1 Billion

Revenue Rate

Poised to Grow at a CAGR of 4.2%

Market Driver

Increasing hernia prevalence

Market Opportunity

Growth potential offered by emerging markets

This report has segmented the global hernia repair market to forecast revenue and analyze trends in each of the following submarkets:

By Product

  • Mesh
    • Synthetic Mesh
    • Biologic Mesh
  • Suture
    • Absorbable Suture
    • Non-Absorbable Suture
  • Mesh Fixator
    • Tach Applicators
    • Glue Applicators
  • Other Products

By Clinical Indication

  • Inguinal Hernia
  • Ventral Hernia
    • Incisional Hernia
    • Epigastric Hernia
    • Umbilical Hernia
  • Femoral Hernia
  • Hiatial Hernia
  • Other Clinical Indications

By Surgery Type

  • Laparoscopic Surgery
  • Open Surgery
  • Robotic Surgery

By End User

  • Hospitals & Clinics
  • Ambulatory Surgical Centers
  • Other End Users

By Region

  • North America
    • US
    • Canada
  • Europe
    • Germany
    • France
    • UK
    • Italy
    • Spain
    • Rest of Europe
  • Asia Pacific
    • Japan
    • China
    • India
    • Australia
    • South Korea
    • Rest of Asia Pacific
  • Latin America
    • Brazil
    • Mexico
    • Rest of Latin America
  • Middle East & Africa
    • GCC Countries
    • Rest of the Middle East & Africa

Recent Developments of Hernia Repair Industry:

  • In October 2022, W. L. Gore & Associates launched GORE SYNECOR Intraperitoneal Biomaterial in Europe, The Middle East and South Africa.
  • In May 2020, Cook Group Inc. partnered with the European Hernia Society for improving patient hernia outcomes through continuing research and education.
  • In May 2020, AbbVie Inc. acquired Allergan and diversified their hernia repair business.

Frequently Asked Questions (FAQ):

To speak to our analyst for a discussion on the above findings, click Speak to Analyst

TABLE OF CONTENTS
 
1 INTRODUCTION (Page No. - 31)
    1.1 STUDY OBJECTIVES 
    1.2 MARKET DEFINITION 
    1.3 INCLUSIONS & EXCLUSIONS 
    1.4 STUDY SCOPE 
           1.4.1 MARKETS COVERED
           1.4.2 REGIONS COVERED
           1.4.3 YEARS CONSIDERED
           1.4.4 CURRENCY CONSIDERED
    1.5 KEY STAKEHOLDERS 
    1.6 SUMMARY OF CHANGES 
           1.6.1 RECESSION IMPACT: HERNIA REPAIR MARKET
 
2 RESEARCH METHODOLOGY (Page No. - 36)
    2.1 RESEARCH DATA 
          FIGURE 1 RESEARCH DESIGN
           2.1.1 SECONDARY DATA
                    2.1.1.1 Indicative list of secondary sources
           2.1.2 PRIMARY DATA
                    FIGURE 2 BREAKDOWN OF PRIMARY INTERVIEWS: BY COMPANY TYPE, DESIGNATION, AND REGION
    2.2 MARKET SIZE ESTIMATION 
          FIGURE 3 RESEARCH METHODOLOGY: HYPOTHESIS BUILDING
           2.2.1 REVENUE MAPPING-BASED MARKET ESTIMATION
                    FIGURE 4 MARKET SIZE ESTIMATION: REVENUE SHARE ANALYSIS (2023)
           2.2.2 END USER-BASED MARKET ESTIMATION
                    FIGURE 5 MARKET SIZE ESTIMATION FOR HERNIA REPAIR MARKET
                    FIGURE 6 EPIDEMIOLOGY-BASED APPROACH: HERNIA MESH MARKET ESTIMATION, BY SURGERY
                    FIGURE 7 EPIDEMIOLOGY-BASED APPROACH: HERNIA MESH FIXATOR MARKET ESTIMATION
           2.2.3 PRIMARY RESEARCH VALIDATION
    2.3 DATA TRIANGULATION 
          FIGURE 8 DATA TRIANGULATION METHODOLOGY
    2.4 STUDY ASSUMPTIONS 
    2.5 RESEARCH LIMITATIONS 
    2.6 RISK ASSESSMENT 
    2.7 IMPACT OF RECESSION ON HERNIA REPAIR MARKET 
 
3 EXECUTIVE SUMMARY (Page No. - 50)
    FIGURE 9 HERNIA REPAIR MARKET, BY PRODUCT, 2024 VS. 2029 (USD MILLION)
    FIGURE 10 HERNIA REPAIR MARKET, BY CLINICAL INDICATION, 2024 VS. 2029 (USD MILLION)
    FIGURE 11 HERNIA REPAIR MARKET SHARE, BY SURGERY TYPE, 2024 VS. 2029 (USD MILLION)
    FIGURE 12 HERNIA REPAIR MARKET SHARE, BY END USER, 2024 VS. 2029
    FIGURE 13 GEOGRAPHICAL SNAPSHOT OF HERNIA REPAIR MARKET
 
4 PREMIUM INSIGHTS (Page No. - 54)
    4.1 HERNIA REPAIR MARKET OVERVIEW 
          FIGURE 14 INCREASING NUMBER OF HERNIA REPAIR PROCEDURES TO DRIVE MARKET
    4.2 ASIA PACIFIC: HERNIA REPAIR MARKET, BY PRODUCT AND COUNTRY (2023) 
          FIGURE 15 MESHES SEGMENT ACCOUNTED FOR LARGEST SHARE OF ASIA PACIFIC MARKET IN 2023
    4.3 HERNIA REPAIR MARKET: GEOGRAPHIC GROWTH OPPORTUNITIES 
          FIGURE 16 CHINA TO REGISTER HIGHEST GROWTH DURING FORECAST PERIOD
    4.4 HERNIA REPAIR MARKET: REGIONAL MIX, 2022–2029 (USD MILLION) 
          FIGURE 17 NORTH AMERICA WILL CONTINUE TO DOMINATE HERNIA REPAIR MARKET DURING FORECAST PERIOD
 
5 MARKET OVERVIEW (Page No. - 57)
    5.1 INTRODUCTION 
    5.2 MARKET DYNAMICS 
          FIGURE 18 DRIVERS, RESTRAINTS, OPPORTUNITIES, AND CHALLENGES: HERNIA REPAIR MARKET
           5.2.1 DRIVERS
                    5.2.1.1 Increasing prevalence of hernia in geriatric population
                    5.2.1.2 Superiority and effectiveness of mesh repair over conventional repair approaches
                    5.2.1.3 Availability of government and private reimbursement schemes in developed economies
                                TABLE 1 REIMBURSEMENT FOR HERNIA REPAIR PROCEDURES IN US
                    5.2.1.4 Technological advancements and availability of advanced meshes
           5.2.2 RESTRAINTS
                    5.2.2.1 Market withdrawals of hernia meshes
                                TABLE 2 MARKET RECALLS OF HERNIA MESHES, 2006–2021
                    5.2.2.2 High costs of mesh repair and availability of less-expensive approaches
                    5.2.2.3 Long waiting times for hernia mesh repair in developed countries
           5.2.3 OPPORTUNITIES
                    5.2.3.1 Increased growth potential in emerging economies
           5.2.4 CHALLENGES
                    5.2.4.1 Increasing pricing pressure in developed economies
                    5.2.4.2 Dearth of expertise in laparoscopic surgery
    5.3 REGULATORY SCENARIO 
           5.3.1 REGULATORY ANALYSIS
                    5.3.1.1 North America
                               5.3.1.1.1 US
                               5.3.1.1.2 Canada
                                              TABLE 3 CANADA: RISK LEVELS OF INVASIVE MEDICAL DEVICES
                    5.3.1.2 Europe
                    5.3.1.3 Asia Pacific
                               5.3.1.3.1 China
           5.3.2 REGULATORY BODIES, GOVERNMENT AGENCIES, AND OTHER ORGANIZATIONS
                    TABLE 4 NORTH AMERICA: REGULATORY BODIES, GOVERNMENT AGENCIES, AND OTHER ORGANIZATIONS
                    TABLE 5 EUROPE: REGULATORY BODIES, GOVERNMENT AGENCIES, AND OTHER ORGANIZATIONS
                    TABLE 6 ASIA PACIFIC: REGULATORY BODIES, GOVERNMENT AGENCIES, AND OTHER ORGANIZATIONS
                    TABLE 7 LATIN AMERICA: REGULATORY BODIES, GOVERNMENT AGENCIES, AND OTHER ORGANIZATIONS
                    TABLE 8 MIDDLE EAST & AFRICA: REGULATORY BODIES, GOVERNMENT AGENCIES, AND OTHER ORGANIZATIONS
    5.4 REIMBURSEMENT SCENARIO 
          TABLE 9 REIMBURSEMENT CODES FOR HERNIA REPAIR PROCEDURES, 2023
           5.4.1 REIMBURSEMENT RATES FOR HERNIA REPAIR PROCEDURES IN US
                    5.4.1.1 Reimbursement rates for physicians, hospital outpatient departments, and ambulatory surgery centers
                                TABLE 10 REIMBURSEMENT RATES FOR HERNIA REPAIR PROCEDURES FOR PHYSICIANS
                                TABLE 11 REIMBURSEMENT RATES FOR HERNIA REPAIR PROCEDURES FOR HOSPITAL OUTPATIENT DEPARTMENTS
                                TABLE 12 REIMBURSEMENT RATES FOR HERNIA REPAIR PROCEDURES FOR AMBULATORY SURGERY CENTERS
                    5.4.1.2 Hospital inpatient reimbursement rates
                                TABLE 13 REIMBURSEMENT RATES FOR HERNIA REPAIR PROCEDURES FOR HOSPITAL INPATIENT DEPARTMENTS
    5.5 VALUE CHAIN ANALYSIS 
           5.5.1 TECHNOLOGY INNOVATION
           5.5.2 PROCUREMENT AND PRODUCT DEVELOPMENT
           5.5.3 MARKETING, SALES, AND DISTRIBUTION AND POST-SALES SERVICES
                    FIGURE 19 VALUE CHAIN ANALYSIS: HERNIA REPAIR MARKET
    5.6 SUPPLY CHAIN ANALYSIS 
           5.6.1 PROMINENT COMPANIES
           5.6.2 SMALL & MEDIUM-SIZED ENTERPRISES
           5.6.3 END USERS
                    FIGURE 20 SUPPLY CHAIN ANALYSIS: HERNIA REPAIR MARKET
    5.7 ECOSYSTEM MARKET/MAP 
          FIGURE 21 HERNIA REPAIR MARKET ECOSYSTEM
          FIGURE 22 HERNIA REPAIR MARKET MAP
    5.8 PORTER’S FIVE FORCES ANALYSIS 
          TABLE 14 PORTER’S FIVE FORCES ANALYSIS: HERNIA REPAIR MARKET
           5.8.1 INTENSITY OF COMPETITIVE RIVALRY
           5.8.2 BARGAINING POWER OF BUYERS
           5.8.3 BARGAINING POWER OF SUPPLIERS
           5.8.4 THREAT OF NEW ENTRANTS
           5.8.5 THREAT OF SUBSTITUTES
    5.9 TRADE DATA ANALYSIS 
          TABLE 15 IMPORT DATA FOR HERNIA MESHES (HS CODE 902190), BY COUNTRY, 2018–2022 (USD)
          TABLE 16 EXPORT DATA FOR HERNIA MESHES (HS CODE 902190), BY COUNTRY, 2018–2022 (USD)
    5.10 PATENT ANALYSIS 
           5.10.1 TOP PATENT APPLICANTS (COMPANIES) FOR HERNIA REPAIR PRODUCTS
                     FIGURE 23 TOP PATENT APPLICANTS FOR HERNIA REPAIR PRODUCTS, 2011–2023
    5.11 PRICING ANALYSIS 
           5.11.1 AVERAGE SELLING PRICE TREND, BY REGION
                     TABLE 17 HERNIA REPAIR PRICING ANALYSIS, BY REGION, 2023 (USD)
           5.11.2 AVERAGE SELLING PRICE TREND, BY KEY PLAYER
                     TABLE 18 HERNIA REPAIR PRICING ANALYSIS, BY KEY PLAYER, 2023 (USD)
    5.12 TECHNOLOGY ANALYSIS 
    5.13 KEY CONFERENCES & EVENTS, 2023–2024 
           TABLE 19 LIST OF MAJOR CONFERENCES & EVENTS IN HERNIA REPAIR MARKET, 2023–2024
    5.14 TRENDS/DISRUPTIONS IMPACTING CUSTOMERS’ BUSINESSES 
           FIGURE 24 EMERGING TRENDS AND OPPORTUNITIES AFFECTING FUTURE REVENUE MIX
    5.15 KEY STAKEHOLDERS & BUYING CRITERIA 
           5.15.1 KEY STAKEHOLDERS
                     FIGURE 25 INFLUENCE OF KEY STAKEHOLDERS ON BUYING PROCESS
                     TABLE 20 INFLUENCE OF KEY STAKEHOLDERS ON BUYING PROCESS (%)
           5.15.2 KEY BUYING CRITERIA
                     FIGURE 26 KEY BUYING CRITERIA FOR HERNIA REPAIR PRODUCTS
                     TABLE 21 KEY BUYING CRITERIA FOR HERNIA REPAIR PRODUCTS
    5.16 UNMET NEEDS AND KEY PAIN POINTS 
           TABLE 22 HERNIA REPAIR MARKET: UNMET CUSTOMER NEEDS AND KEY PAIN POINTS
 
6 HERNIA REPAIR MARKET, BY PRODUCT (Page No. - 82)
    6.1 INTRODUCTION 
          TABLE 23 HERNIA REPAIR MARKET, BY PRODUCT, 2022–2029 (USD MILLION)
    6.2 MESHES 
          TABLE 24 HERNIA REPAIR MESHES MARKET, BY TYPE, 2022–2029 (USD MILLION)
          TABLE 25 HERNIA REPAIR MESHES MARKET, BY CLINICAL INDICATION, 2022–2029 (USD MILLION)
          TABLE 26 HERNIA REPAIR MESHES MARKET, BY SURGERY TYPE, 2022–2029 (USD MILLION)
          TABLE 27 HERNIA REPAIR MESHES MARKET, BY END USER, 2022–2029 (USD MILLION)
          TABLE 28 HERNIA REPAIR MESHES MARKET, BY REGION, 2022–2029 (USD MILLION)
           6.2.1 SYNTHETIC MESHES
                    6.2.1.1 Low cost to drive adoption
                                TABLE 29 TYPES OF SYNTHETIC MESHES
                                TABLE 30 FACTORS AFFECTING RESULTS OF MESH FIXATION
                                TABLE 31 SYNTHETIC MESHES MARKET, BY REGION, 2022–2029 (USD MILLION)
           6.2.2 BIOLOGIC MESHES
                    6.2.2.1 Higher chance of hernia recurrence to hamper market growth
                                TABLE 32 EXAMPLES OF BIOLOGIC MESHES
                                TABLE 33 BIOLOGIC MESHES MARKET, BY REGION, 2022–2029 (USD MILLION)
    6.3 SUTURES 
          TABLE 34 HERNIA REPAIR SUTURES MARKET, BY TYPE, 2022–2029 (USD MILLION)
          TABLE 35 HERNIA REPAIR SUTURES MARKET, BY CLINICAL INDICATION, 2022–2029 (USD MILLION)
          TABLE 36 HERNIA REPAIR SUTURES MARKET, BY SURGERY TYPE, 2022–2029 (USD MILLION)
          TABLE 37 HERNIA REPAIR SUTURES MARKET, BY END USER, 2022–2029 (USD MILLION)
          TABLE 38 HERNIA REPAIR SUTURES MARKET, BY REGION, 2022–2029 (USD MILLION)
           6.3.1 ABSORBABLE SUTURES
                    6.3.1.1 High absorbability to boost demand
                                TABLE 39 ABSORBABLE SUTURES MARKET, BY REGION, 2022–2029 (USD MILLION)
           6.3.2 NON-ABSORBABLE SUTURES
                    6.3.2.1 Ability of non-absorbable sutures to retain strength indefinitely in body to support adoption
                                TABLE 40 NON-ABSORBABLE SUTURES MARKET, BY REGION, 2022–2029 (USD MILLION)
    6.4 MESH FIXATORS 
          TABLE 41 HERNIA REPAIR MESH FIXATORS MARKET, BY TYPE, 2022–2029 (USD MILLION)
          TABLE 42 HERNIA REPAIR MESH FIXATORS MARKET, BY CLINICAL INDICATION, 2022–2029 (USD MILLION)
          TABLE 43 HERNIA REPAIR MESH FIXATORS MARKET, BY SURGERY TYPE, 2022–2029 (USD MILLION)
          TABLE 44 HERNIA REPAIR MESH FIXATORS MARKET, BY END USER, 2022–2029 (USD MILLION)
          TABLE 45 HERNIA REPAIR MESH FIXATORS MARKET, BY REGION, 2022–2029 (USD MILLION)
           6.4.1 TACK APPLICATORS
                    6.4.1.1 Easier and faster application of tacks to drive adoption
                                TABLE 46 EXAMPLES OF TACK APPLICATORS
                                TABLE 47 TACK APPLICATORS MARKET, BY REGION, 2022–2029 (USD MILLION)
           6.4.2 GLUE APPLICATORS
                    6.4.2.1 Significantly lower pain associated with glue fixation to drive market
                                TABLE 48 GLUE APPLICATORS MARKET, BY REGION, 2022–2029 (USD MILLION)
    6.5 OTHER PRODUCTS 
          TABLE 49 HERNIA REPAIR MARKET FOR OTHER PRODUCTS, BY CLINICAL INDICATION, 2022–2029 (USD MILLION)
          TABLE 50 HERNIA REPAIR MARKET FOR OTHER PRODUCTS, BY SURGERY TYPE, 2022–2029 (USD MILLION)
          TABLE 51 HERNIA REPAIR MARKET FOR OTHER PRODUCTS, BY END USER, 2022–2029 (USD MILLION)
          TABLE 52 HERNIA REPAIR MARKET FOR OTHER PRODUCTS, BY REGION, 2022–2029 (USD MILLION)
 
7 HERNIA REPAIR MARKET, BY CLINICAL INDICATION (Page No. - 98)
    7.1 INTRODUCTION 
          TABLE 53 HERNIA REPAIR MARKET, BY CLINICAL INDICATION, 2022–2029 (USD MILLION)
    7.2 INGUINAL HERNIA 
           7.2.1 HIGH NUMBER OF INGUINAL HERNIA REPAIR SURGERIES PERFORMED WORLDWIDE TO DRIVE MARKET
                    TABLE 54 INGUINAL HERNIA REPAIR MARKET, BY REGION, 2022–2029 (USD MILLION)
    7.3 VENTRAL HERNIA 
          TABLE 55 VENTRAL HERNIA REPAIR MARKET, BY REGION, 2022–2029 (USD MILLION)
          TABLE 56 VENTRAL HERNIA REPAIR MARKET, BY TYPE, 2022–2029 (USD MILLION)
           7.3.1 INCISIONAL HERNIA
                    7.3.1.1 Ability to treat incisional hernias through surgery using sutures or meshes to drive growth
                                TABLE 57 INCISIONAL HERNIA REPAIR MARKET, BY REGION, 2022–2029 (USD MILLION)
           7.3.2 UMBILICAL HERNIA
                    7.3.2.1 Lifting heavy weights and pressure inside abdomen—major contributors to occurrence of umbilical hernia
                                TABLE 58 UMBILICAL HERNIA REPAIR MARKET, BY REGION, 2022–2029 (USD MILLION)
           7.3.3 EPIGASTRIC HERNIA
                    7.3.3.1 High prevalence among women to drive market
                                TABLE 59 EPIGASTRIC HERNIA REPAIR MARKET, BY REGION, 2022–2029 (USD MILLION)
    7.4 HIATAL HERNIA 
           7.4.1 HIGH RECURRENCE RATE TO SUPPORT MARKET GROWTH
                    TABLE 60 HIATAL HERNIA REPAIR MARKET, BY REGION, 2022–2029 (USD MILLION)
    7.5 FEMORAL HERNIA 
           7.5.1 FREQUENT OCCURRENCE IN WOMEN TO DRIVE DEMAND
                    TABLE 61 FEMORAL HERNIA REPAIR MARKET, BY REGION, 2022–2029 (USD MILLION)
    7.6 OTHER CLINICAL INDICATIONS 
          TABLE 62 HERNIA REPAIR MARKET FOR OTHER CLINICAL INDICATIONS, BY REGION, 2022–2029 (USD MILLION)
 
8 HERNIA REPAIR MARKET, BY SURGERY TYPE (Page No. - 106)
    8.1 INTRODUCTION 
          TABLE 63 HERNIA REPAIR MARKET, BY SURGERY TYPE, 2022–2029 (USD MILLION)
    8.2 OPEN SURGERY 
           8.2.1 PREFERRED TECHNIQUE FOR PRIMARY INGUINAL HERNIA REPAIR
                    TABLE 64 OPEN HERNIA REPAIR SURGERY MARKET, BY REGION, 2022–2029 (USD MILLION)
    8.3 LAPAROSCOPIC SURGERY 
           8.3.1 LESS POSTOPERATIVE PAIN AND EARLY RECOVERY TO DRIVE ADOPTION
                    TABLE 65 LAPAROSCOPIC HERNIA REPAIR SURGERY MARKET, BY REGION, 2022–2029 (USD MILLION)
    8.4 ROBOTIC SURGERY 
           8.4.1 INCREASED PRECISION AND VISIBILITY TO SUPPORT MARKET GROWTH
                    TABLE 66 ROBOTIC HERNIA REPAIR SURGERY MARKET, BY REGION, 2022–2029 (USD MILLION)
 
9 HERNIA REPAIR MARKET, BY END USER (Page No. - 110)
    9.1 INTRODUCTION 
          TABLE 67 HERNIA REPAIR MARKET, BY END USER, 2022–2029 (USD MILLION)
    9.2 HOSPITALS & CLINICS 
           9.2.1 LARGEST END-USER SEGMENT DUE TO HIGH PATIENT INFLOW
                    TABLE 68 HERNIA REPAIR MARKET FOR HOSPITALS & CLINICS, BY REGION, 2022–2029 (USD MILLION)
    9.3 AMBULATORY SURGERY CENTERS 
           9.3.1 FASTER PATIENT FLOW, REDUCED PATIENT STRESS, AND LOWER OVERALL COST—KEY FACTORS DRIVING MARKET GROWTH
                    TABLE 69 HERNIA REPAIR MARKET FOR AMBULATORY SURGERY CENTERS, BY REGION, 2022–2029 (USD MILLION)
    9.4 OTHER END USERS 
          TABLE 70 HERNIA REPAIR MARKET FOR OTHER END USERS, BY REGION, 2022–2029 (USD MILLION)
 
10 HERNIA REPAIR MARKET, BY REGION (Page No. - 114)
     10.1 INTRODUCTION 
             TABLE 71 HERNIA REPAIR MARKET, BY REGION, 2022–2029 (USD MILLION)
     10.2 NORTH AMERICA 
             10.2.1 NORTH AMERICA: RECESSION IMPACT
                        FIGURE 27 NORTH AMERICA: HERNIA REPAIR MARKET SNAPSHOT
                        TABLE 72 NORTH AMERICA: HERNIA REPAIR MARKET, BY COUNTRY, 2022–2029 (USD MILLION)
                        TABLE 73 NORTH AMERICA: HERNIA REPAIR MARKET, BY PRODUCT, 2022–2029 (USD MILLION)
                        TABLE 74 NORTH AMERICA: HERNIA REPAIR MESHES MARKET, BY TYPE, 2022–2029 (USD MILLION)
                        TABLE 75 NORTH AMERICA: HERNIA REPAIR SUTURES MARKET, BY TYPE, 2022–2029 (USD MILLION)
                        TABLE 76 NORTH AMERICA: HERNIA REPAIR MESH FIXATORS MARKET, BY TYPE, 2022–2029 (USD MILLION)
                        TABLE 77 NORTH AMERICA: HERNIA REPAIR MARKET, BY CLINICAL INDICATION, 2022–2029 (USD MILLION)
                        TABLE 78 NORTH AMERICA: HERNIA REPAIR MARKET, BY SURGERY TYPE, 2022–2029 (USD MILLION)
                        TABLE 79 NORTH AMERICA: HERNIA REPAIR MARKET, BY END USER, 2022–2029 (USD MILLION)
             10.2.2 US
                        10.2.2.1 Government initiatives and investment plans for environmental protection to drive market
                                      TABLE 80 US: HERNIA REPAIR MARKET, BY PRODUCT, 2022–2029 (USD MILLION)
                                      TABLE 81 US: HERNIA REPAIR MESHES MARKET, BY TYPE, 2022–2029 (USD MILLION)
                                      TABLE 82 US: HERNIA REPAIR SUTURES MARKET, BY TYPE, 2022–2029 (USD MILLION)
                                      TABLE 83 US: HERNIA REPAIR MESH FIXATORS MARKET, BY TYPE, 2022–2029 (USD MILLION)
             10.2.3 CANADA
                        10.2.3.1 Rising geriatric population to drive market
                                      TABLE 84 CANADA: HERNIA REPAIR MARKET, BY PRODUCT, 2022–2029 (USD MILLION)
                                      TABLE 85 CANADA: HERNIA REPAIR MESHES MARKET, BY TYPE, 2022–2029 (USD MILLION)
                                      TABLE 86 CANADA: HERNIA REPAIR SUTURES MARKET, BY TYPE, 2022–2029 (USD MILLION)
                                      TABLE 87 CANADA: HERNIA REPAIR MESH FIXATORS MARKET, BY TYPE, 2022–2029 (USD MILLION)
     10.3 EUROPE 
             10.3.1 EUROPE: RECESSION IMPACT
                        TABLE 88 EUROPE: HERNIA REPAIR MARKET, BY COUNTRY, 2022–2029 (USD MILLION)
                        TABLE 89 EUROPE: HERNIA REPAIR MARKET, BY PRODUCT, 2022–2029 (USD MILLION)
                        TABLE 90 EUROPE: HERNIA REPAIR MESHES MARKET, BY TYPE, 2022–2029 (USD MILLION)
                        TABLE 91 EUROPE: HERNIA REPAIR SUTURES MARKET, BY TYPE, 2022–2029 (USD MILLION)
                        TABLE 92 EUROPE: HERNIA REPAIR MESH FIXATORS MARKET, BY TYPE, 2022–2029 (USD MILLION)
                        TABLE 93 EUROPE: HERNIA REPAIR MARKET, BY CLINICAL INDICATION, 2022–2029 (USD MILLION)
                        TABLE 94 EUROPE: HERNIA REPAIR MARKET, BY SURGERY TYPE, 2022–2029 (USD MILLION)
                        TABLE 95 EUROPE: HERNIA REPAIR MARKET, BY END USER, 2022–2029 (USD MILLION)
             10.3.2 GERMANY
                        10.3.2.1 Water pollution management and depleting air quality to drive demand for hernia repair products
                                      TABLE 96 GERMANY: HERNIA REPAIR MARKET, BY PRODUCT, 2022–2029 (USD MILLION)
                                      TABLE 97 GERMANY: HERNIA REPAIR MESHES MARKET, BY TYPE, 2022–2029 (USD MILLION)
                                      TABLE 98 GERMANY: HERNIA REPAIR SUTURES MARKET, BY TYPE, 2022–2029 (USD MILLION)
                                      TABLE 99 GERMANY: HERNIA REPAIR MESH FIXATORS MARKET, BY TYPE, 2022–2029 (USD MILLION)
             10.3.3 UK
                        10.3.3.1 High use of analytical techniques in food testing and stringent government regulations to drive market
                                      TABLE 100 UK: HERNIA REPAIR MARKET, BY PRODUCT, 2022–2029 (USD MILLION)
                                      TABLE 101 UK: HERNIA REPAIR MESHES MARKET, BY TYPE, 2022–2029 (USD MILLION)
                                      TABLE 102 UK: HERNIA REPAIR SUTURES MARKET, BY TYPE, 2022–2029 (USD MILLION)
                                      TABLE 103 UK: HERNIA REPAIR MESH FIXATORS MARKET, BY TYPE, 2022–2029 (USD MILLION)
             10.3.4 FRANCE
                        10.3.4.1 Rising industrial contaminant levels and pollution in drinking water bodies to drive market
                                      TABLE 104 FRANCE: HERNIA REPAIR MARKET, BY PRODUCT, 2022–2029 (USD MILLION)
                                      TABLE 105 FRANCE: HERNIA REPAIR MESHES MARKET, BY TYPE, 2022–2029 (USD MILLION)
                                      TABLE 106 FRANCE: HERNIA REPAIR SUTURES MARKET, BY TYPE, 2022–2029 (USD MILLION)
                                      TABLE 107 FRANCE: HERNIA REPAIR MESH FIXATORS MARKET, BY TYPE, 2022–2029 (USD MILLION)
             10.3.5 ITALY
                        10.3.5.1 Favorable healthcare system and insurance to support growth
                                      TABLE 108 ITALY: HERNIA REPAIR MARKET, BY PRODUCT, 2022–2029 (USD MILLION)
                                      TABLE 109 ITALY: HERNIA REPAIR MESHES MARKET, BY TYPE, 2022–2029 (USD MILLION)
                                      TABLE 110 ITALY: HERNIA REPAIR SUTURES MARKET, BY TYPE, 2022–2029 (USD MILLION)
                                      TABLE 111 ITALY: HERNIA REPAIR MESH FIXATORS MARKET, BY TYPE, 2022–2029 (USD MILLION)
             10.3.6 SPAIN
                        10.3.6.1 Growing geriatric population & increasing life expectancies to aid market growth
                                      TABLE 112 SPAIN: HERNIA REPAIR MARKET, BY PRODUCT, 2022–2029 (USD MILLION)
                                      TABLE 113 SPAIN: HERNIA REPAIR MESHES MARKET, BY TYPE, 2022–2029 (USD MILLION)
                                      TABLE 114 SPAIN: HERNIA REPAIR SUTURES MARKET, BY TYPE, 2022–2029 (USD MILLION)
                                      TABLE 115 SPAIN: HERNIA REPAIR MESH FIXATORS MARKET, BY TYPE, 2022–2029 (USD MILLION)
             10.3.7 REST OF EUROPE
                        TABLE 116 REST OF EUROPE: HERNIA REPAIR MARKET, BY PRODUCT, 2022–2029 (USD MILLION)
                        TABLE 117 REST OF EUROPE: HERNIA REPAIR MESHES MARKET, BY TYPE, 2022–2029 (USD MILLION)
                        TABLE 118 REST OF EUROPE: HERNIA REPAIR SUTURES MARKET, BY TYPE, 2022–2029 (USD MILLION)
                        TABLE 119 REST OF EUROPE: HERNIA REPAIR MESH FIXATORS MARKET, BY TYPE, 2022–2029 (USD MILLION)
     10.4 ASIA PACIFIC 
             10.4.1 ASIA PACIFIC: RECESSION IMPACT
                        FIGURE 28 ASIA PACIFIC: HERNIA REPAIR MARKET SNAPSHOT
                        TABLE 120 ASIA PACIFIC: HERNIA REPAIR MARKET, BY COUNTRY, 2022–2029 (USD MILLION)
                        TABLE 121 ASIA PACIFIC: HERNIA REPAIR MARKET, BY PRODUCT, 2022–2029 (USD MILLION)
                        TABLE 122 ASIA PACIFIC: HERNIA REPAIR MESHES MARKET, BY TYPE, 2022–2029 (USD MILLION)
                        TABLE 123 ASIA PACIFIC: HERNIA REPAIR SUTURES MARKET, BY TYPE, 2022–2029 (USD MILLION)
                        TABLE 124 ASIA PACIFIC: HERNIA REPAIR MESH FIXATORS MARKET, BY TYPE, 2022–2029 (USD MILLION)
                        TABLE 125 ASIA PACIFIC: HERNIA REPAIR MARKET, BY CLINICAL INDICATION, 2022–2029 (USD MILLION)
                        TABLE 126 ASIA PACIFIC: HERNIA REPAIR MARKET, BY SURGERY TYPE, 2022–2029 (USD MILLION)
                        TABLE 127 ASIA PACIFIC: HERNIA REPAIR MARKET, BY END USER, 2022–2029 (USD MILLION)
             10.4.2 JAPAN
                        10.4.2.1 Japan to hold largest share of APAC market
                                      TABLE 128 JAPAN: HERNIA REPAIR MARKET, BY PRODUCT, 2022–2029 (USD MILLION)
                                      TABLE 129 JAPAN: HERNIA REPAIR MESHES MARKET, BY TYPE, 2022–2029 (USD MILLION)
                                      TABLE 130 JAPAN: HERNIA REPAIR SUTURES MARKET, BY TYPE, 2022–2029 (USD MILLION)
                                      TABLE 131 JAPAN: HERNIA REPAIR MESH FIXATORS MARKET, BY TYPE, 2022–2029 (USD MILLION)
             10.4.3 CHINA
                        10.4.3.1 High procedural volume and rising disposable income to favor market growth
                                      TABLE 132 CHINA: HERNIA REPAIR MARKET, BY PRODUCT, 2022–2029 (USD MILLION)
                                      TABLE 133 CHINA: HERNIA REPAIR MESHES MARKET, BY TYPE, 2022–2029 (USD MILLION)
                                      TABLE 134 CHINA: HERNIA REPAIR SUTURES MARKET, BY TYPE, 2022–2029 (USD MILLION)
                                      TABLE 135 CHINA: HERNIA REPAIR MESH FIXATORS MARKET, BY TYPE, 2022–2029 (USD MILLION)
             10.4.4 INDIA
                        10.4.4.1 Rising geriatric population and infrastructural improvements to drive market
                                      TABLE 136 INDIA: HERNIA REPAIR MARKET, BY PRODUCT, 2022–2029 (USD MILLION)
                                      TABLE 137 INDIA: HERNIA REPAIR MESHES MARKET, BY TYPE, 2022–2029 (USD MILLION)
                                      TABLE 138 INDIA: HERNIA REPAIR SUTURES MARKET, BY TYPE, 2022–2029 (USD MILLION)
                                      TABLE 139 INDIA: HERNIA REPAIR MESH FIXATORS MARKET, BY TYPE, 2022–2029 (USD MILLION)
             10.4.5 AUSTRALIA
                        10.4.5.1 Growing awareness of hernia management to support adoption and development of hernia repair procedures
                                      TABLE 140 AUSTRALIA: HERNIA REPAIR MARKET, BY PRODUCT, 2022–2029 (USD MILLION)
                                      TABLE 141 AUSTRALIA: HERNIA REPAIR MESHES MARKET, BY TYPE, 2022–2029 (USD MILLION)
                                      TABLE 142 AUSTRALIA: HERNIA REPAIR SUTURES MARKET, BY TYPE, 2022–2029 (USD MILLION)
                                      TABLE 143 AUSTRALIA: HERNIA REPAIR MESH FIXATORS MARKET, BY TYPE, 2022–2029 (USD MILLION)
             10.4.6 SOUTH KOREA
                        10.4.6.1 Growing awareness to drive market growth
                                      TABLE 144 SOUTH KOREA: HERNIA REPAIR MARKET, BY PRODUCT, 2022–2029 (USD MILLION)
                                      TABLE 145 SOUTH KOREA: HERNIA REPAIR MESHES MARKET, BY TYPE, 2022–2029 (USD MILLION)
                                      TABLE 146 SOUTH KOREA: HERNIA REPAIR SUTURES MARKET, BY TYPE, 2022–2029 (USD MILLION)
                                      TABLE 147 SOUTH KOREA: HERNIA REPAIR MESH FIXATORS MARKET, BY TYPE, 2022–2029 (USD MILLION)
             10.4.7 REST OF ASIA PACIFIC
                        TABLE 148 REST OF ASIA PACIFIC: HERNIA REPAIR MARKET, BY PRODUCT, 2022–2029 (USD MILLION)
                        TABLE 149 REST OF ASIA PACIFIC: HERNIA REPAIR MESHES MARKET, BY TYPE, 2022–2029 (USD MILLION)
                        TABLE 150 REST OF ASIA PACIFIC: HERNIA REPAIR SUTURES MARKET, BY TYPE, 2022–2029 (USD MILLION)
                        TABLE 151 REST OF ASIA PACIFIC: HERNIA REPAIR MESH FIXATORS MARKET, BY TYPE, 2022–2029 (USD MILLION)
     10.5 LATIN AMERICA 
             10.5.1 LATIN AMERICA: RECESSION IMPACT
                        TABLE 152 LATIN AMERICA: HERNIA REPAIR MARKET, BY COUNTRY, 2022–2029 (USD MILLION)
                        TABLE 153 LATIN AMERICA: HERNIA REPAIR MARKET, BY PRODUCT, 2022–2029 (USD MILLION)
                        TABLE 154 LATIN AMERICA: HERNIA REPAIR MESHES MARKET, BY TYPE, 2022–2029 (USD MILLION)
                        TABLE 155 LATIN AMERICA: HERNIA REPAIR SUTURES MARKET, BY TYPE, 2022–2029 (USD MILLION)
                        TABLE 156 LATIN AMERICA: HERNIA REPAIR MESH FIXATORS MARKET, BY TYPE, 2022–2029 (USD MILLION)
                        TABLE 157 LATIN AMERICA: HERNIA REPAIR MARKET, BY CLINICAL INDICATION, 2022–2029 (USD MILLION)
                        TABLE 158 LATIN AMERICA: HERNIA REPAIR MARKET, BY SURGERY TYPE, 2022–2029 (USD MILLION)
                        TABLE 159 LATIN AMERICA: HERNIA REPAIR MARKET, BY END USER, 2022–2029 (USD MILLION)
             10.5.2 BRAZIL
                        10.5.2.1 Growing medical tourism to support demand growth
                                      TABLE 160 BRAZIL: HERNIA REPAIR MARKET, BY PRODUCT, 2022–2029 (USD MILLION)
                                      TABLE 161 BRAZIL: HERNIA REPAIR MESHES MARKET, BY TYPE, 2022–2029 (USD MILLION)
                                      TABLE 162 BRAZIL: HERNIA REPAIR SUTURES MARKET, BY TYPE, 2022–2029 (USD MILLION)
                                      TABLE 163 BRAZIL: HERNIA REPAIR MESH FIXATORS MARKET, BY TYPE, 2022–2029 (USD MILLION)
             10.5.3 MEXICO
                        10.5.3.1 Slow adoption of advanced technologies to hinder growth
                                      TABLE 164 MEXICO: HERNIA REPAIR MARKET, BY PRODUCT, 2022–2029 (USD MILLION)
                                      TABLE 165 MEXICO: HERNIA REPAIR MESHES MARKET, BY TYPE, 2022–2029 (USD MILLION)
                                      TABLE 166 MEXICO: HERNIA REPAIR SUTURES MARKET, BY TYPE, 2022–2029 (USD MILLION)
                                      TABLE 167 MEXICO: HERNIA REPAIR MESH FIXATORS MARKET, BY TYPE, 2022–2029 (USD MILLION)
             10.5.4 REST OF LATIN AMERICA
                        TABLE 168 REST OF LATIN AMERICA: HERNIA REPAIR MARKET, BY PRODUCT, 2022–2029 (USD MILLION)
                        TABLE 169 REST OF LATIN AMERICA: HERNIA REPAIR MESHES MARKET, BY TYPE, 2022–2029 (USD MILLION)
                        TABLE 170 REST OF LATIN AMERICA: HERNIA REPAIR SUTURES MARKET, BY TYPE, 2022–2029 (USD MILLION)
                        TABLE 171 REST OF LATIN AMERICA: HERNIA REPAIR MESH FIXATORS MARKET, BY TYPE, 2022–2029 (USD MILLION)
     10.6 MIDDLE EAST & AFRICA 
             10.6.1 MIDDLE EAST & AFRICA: RECESSION IMPACT
                        TABLE 172 MIDDLE EAST & AFRICA: HERNIA REPAIR MARKET, BY REGION, 2022–2029 (USD MILLION)
                        TABLE 173 MIDDLE EAST & AFRICA: HERNIA REPAIR MARKET, BY PRODUCT, 2022–2029 (USD MILLION)
                        TABLE 174 MIDDLE EAST & AFRICA: HERNIA REPAIR MESHES MARKET, BY TYPE, 2022–2029 (USD MILLION)
                        TABLE 175 MIDDLE EAST & AFRICA: HERNIA REPAIR SUTURES MARKET, BY TYPE, 2022–2029 (USD MILLION)
                        TABLE 176 MIDDLE EAST & AFRICA: HERNIA REPAIR MESH FIXATORS MARKET, BY TYPE, 2022–2029 (USD MILLION)
                        TABLE 177 MIDDLE EAST & AFRICA: HERNIA REPAIR MARKET, BY CLINICAL INDICATION, 2022–2029 (USD MILLION)
                        TABLE 178 MIDDLE EAST & AFRICA: HERNIA REPAIR MARKET, BY SURGERY TYPE, 2022–2029 (USD MILLION)
                        TABLE 179 MIDDLE EAST & AFRICA: HERNIA REPAIR MARKET, BY END USER, 2022–2029 (USD MILLION)
             10.6.2 GCC COUNTRIES
                        10.6.2.1 Lack of regulations for PFAS substances to restrict growth
                                      TABLE 180 GCC COUNTRIES: HERNIA REPAIR MARKET, BY PRODUCT, 2022–2029 (USD MILLION)
                                      TABLE 181 GCC COUNTRIES: HERNIA REPAIR MESHES MARKET, BY TYPE, 2022–2029 (USD MILLION)
                                      TABLE 182 GCC COUNTRIES: HERNIA REPAIR SUTURES MARKET, BY TYPE, 2022–2029 (USD MILLION)
                                      TABLE 183 GCC COUNTRIES: HERNIA REPAIR MESH FIXATORS MARKET, BY TYPE, 2022–2029 (USD MILLION)
             10.6.3 REST OF MIDDLE EAST & AFRICA
                        TABLE 184 REST OF MIDDLE EAST & AFRICA: HERNIA REPAIR MARKET, BY PRODUCT, 2022–2029 (USD MILLION)
                        TABLE 185 REST OF MIDDLE EAST & AFRICA: HERNIA REPAIR MESHES MARKET, BY TYPE, 2022–2029 (USD MILLION)
                        TABLE 186 REST OF MIDDLE EAST & AFRICA: HERNIA REPAIR SUTURES MARKET, BY TYPE, 2022–2029 (USD MILLION)
                        TABLE 187 REST OF MIDDLE EAST & AFRICA: HERNIA REPAIR MESH FIXATORS MARKET, BY TYPE, 2022–2029 (USD MILLION)
 
11 COMPETITIVE LANDSCAPE (Page No. - 168)
     11.1 INTRODUCTION 
     11.2 KEY PLAYER STRATEGIES/RIGHT TO WIN 
             FIGURE 29 KEY DEVELOPMENTS BY MAJOR PLAYERS IN HERNIA REPAIR MARKET, 2017–2024
     11.3 REVENUE SHARE ANALYSIS 
             FIGURE 30 REVENUE SHARE ANALYSIS OF KEY PLAYERS (2020–2023)
     11.4 MARKET SHARE ANALYSIS 
             FIGURE 31 HERNIA REPAIR MARKET SHARE, BY KEY PLAYER, 2023
             TABLE 188 DEGREE OF COMPETITION: HERNIA REPAIR MARKET
     11.5 COMPANY EVALUATION MATRIX 
             11.5.1 STARS
             11.5.2 EMERGING LEADERS
             11.5.3 PERVASIVE PLAYERS
             11.5.4 PARTICIPANTS
                        FIGURE 32 HERNIA REPAIR MARKET: COMPANY EVALUATION MATRIX, 2023
             11.5.5 COMPANY FOOTPRINT
                        TABLE 189 PRODUCT FOOTPRINT
                        TABLE 190 CLINICAL INDICATION FOOTPRINT
     11.6 START-UP/SME EVALUATION MATRIX 
             11.6.1 PROGRESSIVE COMPANIES
             11.6.2 RESPONSIVE COMPANIES
             11.6.3 DYNAMIC COMPANIES
             11.6.4 STARTING BLOCKS
                        FIGURE 33 HERNIA REPAIR MARKET: START-UP/SME EVALUATION MATRIX, 2023
             11.6.5 COMPETITIVE BENCHMARKING
                        TABLE 191 HERNIA REPAIR MARKET: DETAILED LIST OF KEY START-UPS/SMES
     11.7 COMPETITIVE SCENARIO 
             11.7.1 PRODUCT LAUNCHES & APPROVALS
                        TABLE 192 HERNIA REPAIR MARKET: PRODUCT LAUNCHES & APPROVALS, JUNE 2020–DECEMBER 2023
             11.7.2 DEALS
                        TABLE 193 HERNIA REPAIR MARKET: DEALS, JUNE 2020–DECEMBER 2023
             11.7.3 OTHER DEVELOPMENTS
                        TABLE 194 HERNIA REPAIR MARKET: OTHER DEVELOPMENTS, JUNE 2020–DECEMBER 2023
 
12 COMPANY PROFILES (Page No. - 180)
     12.1 KEY PLAYERS 
(Business Overview, Products/Services/Solutions Offered, MnM View, Key Strengths and Right to Win, Strategic Choices Made, Weaknesses and Competitive Threats, Recent Developments)*
             12.1.1 ETHICON INC. (PART OF JOHNSON & JOHNSON)
                        TABLE 195 ETHICON INC.: COMPANY OVERVIEW
                        FIGURE 34 JOHNSON & JOHNSON: COMPANY SNAPSHOT (2022)
             12.1.2 ABBVIE INC.
                        TABLE 196 ABBVIE INC.: COMPANY OVERVIEW
                        FIGURE 35 ABBVIE INC.: COMPANY SNAPSHOT (2022)
             12.1.3 MEDTRONIC PLC
                        TABLE 197 MEDTRONIC PLC: COMPANY OVERVIEW
                        FIGURE 36 MEDTRONIC PLC: COMPANY SNAPSHOT (2022)
             12.1.4 BECTON, DICKINSON AND COMPANY
                        TABLE 198 BECTON, DICKINSON AND COMPANY: COMPANY OVERVIEW
                        FIGURE 37 BECTON, DICKINSON AND COMPANY: COMPANY SNAPSHOT (2023)
             12.1.5 BAXTER INTERNATIONAL INC.
                        TABLE 199 BAXTER INTERNATIONAL INC.: COMPANY OVERVIEW
                        FIGURE 38 BAXTER INTERNATIONAL INC.: COMPANY SNAPSHOT (2022)
             12.1.6 B. BRAUN SE
                        TABLE 200 B. BRAUN SE: COMPANY OVERVIEW
                        FIGURE 39 B. BRAUN SE: COMPANY SNAPSHOT (2022)
             12.1.7 W. L. GORE & ASSOCIATES
                        TABLE 201 W. L. GORE & ASSOCIATES: COMPANY OVERVIEW
             12.1.8 COOK GROUP INC.
                        TABLE 202 COOK GROUP INC.: COMPANY OVERVIEW
             12.1.9 INTEGRA LIFESCIENCES HOLDINGS CORPORATION
                        TABLE 203 INTEGRA LIFESCIENCES HOLDINGS CORPORATION: COMPANY OVERVIEW
                        FIGURE 40 INTEGRA LIFESCIENCES HOLDINGS CORPORATION: COMPANY SNAPSHOT (2022)
             12.1.10 THE COOPER COMPANIES, INC.
                        TABLE 204 THE COOPER COMPANIES, INC.: COMPANY OVERVIEW
                        FIGURE 41 THE COOPER COMPANIES, INC.: COMPANY SNAPSHOT (2022)
*Business Overview, Products/Services/Solutions Offered, MnM View, Key Strengths and Right to Win, Strategic Choices Made, Weaknesses and Competitive Threats, Recent Developments might not be captured in case of unlisted companies.
     12.2 OTHER PLAYERS 
             12.2.1 H.B. FULLER COMPANY
             12.2.2 ADVANCED MEDICAL SOLUTIONS GROUP PLC
             12.2.3 TELEFLEX MEDICAL OEM
             12.2.4 TRANSEASY MEDICAL TECH
             12.2.5 FEG TEXTILTECHNIK MBH
             12.2.6 DIPROMED SRL
             12.2.7 HERNIAMESH S.R.L
             12.2.8 GEM SRL
             12.2.9 MERIL LIFE SCIENCES PVT. LTD.
             12.2.10 TELA BIO, INC.
             12.2.11 ASSUT EUROPE S.P.A.
             12.2.12 ARAN BIOMEDICAL
             12.2.13 DOLPHIN SUTURES
             12.2.14 BG MEDICAL LLC
             12.2.15 COUSIN SURGERY
             12.2.16 TI MEDICAL PRIVATE LIMITED
             12.2.17 VITREX MEDICAL A/S
             12.2.18 DEMETECH CORPORATION
 
13 APPENDIX (Page No. - 222)
     13.1 DISCUSSION GUIDE 
     13.2 KNOWLEDGESTORE: MARKETSANDMARKETS’ SUBSCRIPTION PORTAL 
     13.3 CUSTOMIZATION OPTIONS 
     13.4 RELATED REPORTS 
     13.5 AUTHOR DETAILS

This study involved the extensive use of both primary and secondary sources. The research process involved the study of various factors affecting the industry to identify the segmentation types, industry trends, key players, competitive landscape, key market dynamics, and key player strategies.

Secondary Research

The secondary research process involves the widespread use of secondary sources, directories, databases (such as Bloomberg Businessweek, Factiva, and D&B Hoovers), white papers, annual reports, company house documents, investor presentations, and SEC filings of companies. Secondary research was used to identify and collect information useful for the extensive, technical, market-oriented, and commercial study of the hernia repair market. It was also used to obtain important information about the key players and market classification & segmentation according to industry trends to the bottom-most level and key developments related to market and technology perspectives. A database of the key industry leaders was also prepared using secondary research.

Primary Research

In the primary research process, various sources from both the supply and demand sides were interviewed to obtain qualitative and quantitative information for this report. The primary sources from the supply side include industry experts such as CEOs, vice presidents, marketing and sales directors, technology & innovation directors, and related key executives from various key companies and organizations in the hernia repair market. The primary sources from the demand side include OEMs, private and contract testing organizations and service providers, among others. Primary research was conducted to validate the market segmentation, identify key players in the market, and gather insights on key industry trends & key market dynamics.

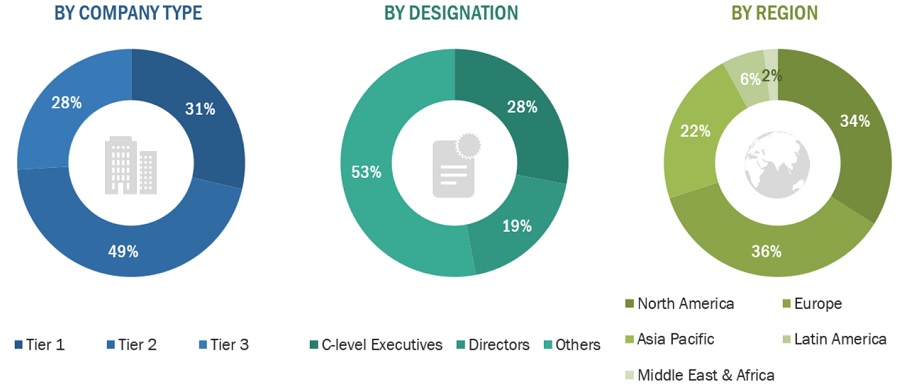
A breakdown of the primary respondents is provided below:
Hernia Repair Market Size, and Share

*Others include sales managers, marketing managers, business development managers, product managers, distributors, and suppliers.

Note: Companies are classified into tiers based on their total revenue. As of 2022, Tier 1 = >USD 2 billion, Tier 2 = USD 50 million to USD 2 billion, and Tier 3 = <USD 50 million.

To know about the assumptions considered for the study, download the pdf brochure

Market Estimation Methodology

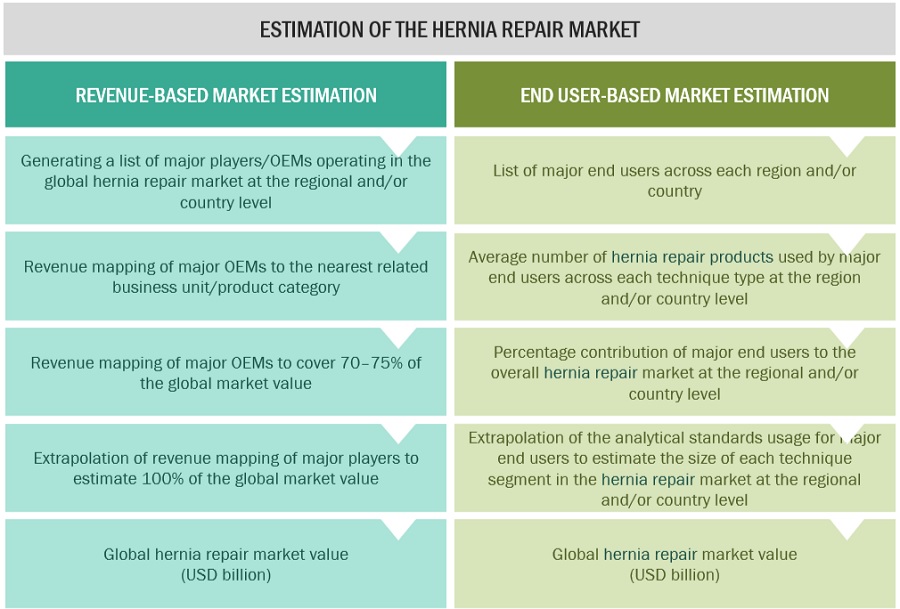
In this report, the global hernia repair market size was arrived at by using the revenue share analysis of leading players. For this purpose, key players in the market were identified, and their revenues from the hernia repair products business were determined through various insights gathered during the primary and secondary research phases. Secondary research included the study of the annual and financial reports of the top market players. In contrast, primary research included extensive interviews with key opinion leaders, such as CEOs, directors, and key marketing executives.

Company revenue estimation approach

To calculate the global market value, segmental revenues were calculated based on the revenue mapping of major solution/service providers. This process involved the following steps:

  • Generating a list of major global players operating in the hernia repair market
  • Mapping annual revenues generated by major global players from the hernia repair segment (or nearest reported business unit category)
  • Revenue mapping of key players to cover a major share of the global market as of 2022
  • Extrapolating the global value of the hernia repair industry

Hernia Repair Market Size, and Share

To know about the assumptions considered for the study, Request for Free Sample Report

End user-based market estimation

During preliminary secondary research, the total sales revenue of hernia repair was estimated and validated at the regional and country level, triangulated, and validated to estimate the global market value. This process involved the following steps:

  • Generating a list of major customer facilities across each region and country
  • Identifying the average number of hernia repair product supplies used by major customer facilities across each product type at the regional/country level, annually
  • Identifying the percentage contribution of major customer facilities to the overall hernia repair expenditure and usage at the regional/country level, annually
  • Extrapolating the annual usage patterns for various products across major customer facilities to estimate the size of each product segment at the regional/country level, annually
Hernia Repair Market Size, and Share

Data Triangulation

After arriving at the overall market size from the market size estimation process explained above, the global hernia repair market was split into segments and subsegments. Data triangulation and market breakdown procedures were employed to complete the overall market engineering process and arrive at the exact statistics for all segments and subsegments. The data was triangulated by studying various factors and trends from both the demand and supply sides. Additionally, the Hernia repair market was validated using both top-down and bottom-up approaches.

Market Definition

Hernia is the protrusion of an internal organ or tissue through a weak portion of a muscle or connective tissue. A hernia mesh is used for sealing this weak portion. This mesh is then kept in place by mesh fixators to avoid displacement and reduce the chances of recurrence.

Key Market Stakeholders

  • Hernia mesh and mesh fixator manufacturers
  • Third-party hernia mesh product suppliers
  • Raw material suppliers
  • Market research and consulting firms
  • Regulatory bodies
  • Venture capitalists
  • Hospitals

Objectives of the Study

  • To define, describe, and forecast the hernia repair market on the basis of on product, clinical indication, surgery type, end user, and region.
  • To provide detailed information regarding the major factors influencing the growth potential of the global hernia repair market (drivers, restraints, opportunities, challenges, and trends).
  • To analyze the micro markets with respect to individual growth trends, future prospects, and contributions to the global hernia repair market.
  • To analyze key growth opportunities in the global hernia repair market for key stakeholders and provide details of the competitive landscape for market leaders.
  • To forecast the size of market segments and/or subsegments with respect to five major regions, namely, North America (the US and Canada), Europe (Germany, the UK, France, Italy, Spain, and Rest of Europe), Asia Pacific (Japan, China, India, Australia, South Korea, and Rest of Asia Pacific), Latin America (Brazil, Mexico, and Rest of Latin America), and the Middle East and Africa (GCC Countries and Rest of MEA).
  • To profile the key players in the global hernia repair market and comprehensively analyze their market shares and core competencies.
  • To track and analyze the competitive developments undertaken in the global hernia repair market, such as agreements, expansions, and & acquisitions.

Available Customizations

With the given market data, MarketsandMarkets offers customizations as per the company’s specific needs. The following customization options are available for the present global hernia repair market report:

Product Analysis

  • Product matrix, which gives a detailed comparison of the product portfolios of the top fifteen companies

Company Information

  • Detailed analysis and profiling of additional market players (up to 10)

Geographic Analysis

  • Further breakdown of the Rest of Europe's hernia repair market into Russia, Belgium, the Netherlands, Switzerland, Austria, Finland, Sweden, Poland, and Portugal among other
  • Further breakdown of the Rest of Asia Pacific hernia repair market into Singapore, Taiwan, New Zealand, Philippines, Malaysia, and other APAC countries
  • Further breakdown of the Rest of the Latin America hernia repair market into Argentina, Chile, Peru, and Colombia, among other
Custom Market Research Services

We will customize the research for you, in case the report listed above does not meet with your exact requirements. Our custom research will comprehensively cover the business information you require to help you arrive at strategic and profitable business decisions.

Request Customization

Instant Answers with GPT - Ask Now!

Ask real questions. Get complete answers !
Report Code
MD 4104
Published ON
Feb, 2024
Choose License Type
BUY NOW
  • SHARE
X
Request Customization
Speak to Analyst
Speak to Analyst
OR FACE-TO-FACE MEETING
PERSONALIZE THIS RESEARCH
  • Triangulate with your Own Data
  • Get Data as per your Format and Definition
  • Gain a Deeper Dive on a Specific Application, Geography, Customer or Competitor
  • Any level of Personalization
REQUEST A FREE CUSTOMIZATION
LET US HELP YOU!
  • What are the Known and Unknown Adjacencies Impacting the Hernia Repair Market
  • What will your New Revenue Sources be?
  • Who will be your Top Customer; what will make them switch?
  • Defend your Market Share or Win Competitors
  • Get a Scorecard for Target Partners
CUSTOMIZED WORKSHOP REQUEST
+1-888-600-6441
  • Call Us
  • +1-888-600-6441 (Corporate office hours)
  • +1-888-600-6441 (US/Can toll free)
  • +44-800-368-9399 (UK office hours)
CONNECT WITH US
ABOUT TRUST ONLINE
©2024 MarketsandMarkets Research Private Ltd. All rights reserved
DMCA.com Protection Status Website Feedback