In-Vehicle Networking Market by Vehicle Type (Passenger Car, LCV, HCV, and AGV), Connectivity Standards (CAN, LIN, FlexRay, RF, Ethernet, and MOST), Application, and Geography - Global Forecast to 2022


The in-vehicle networking market is expected to grow from USD 838.6 Million in 2015 to USD 1,366.0 Million by 2022, at a CAGR of 7.32% between 2016 and 2022. The market size, in terms of volume, is expected to reach 1.38 billion units by 2022, at a CAGR of 7.14% between 2016 and 2022. This report provides the market size and future growth potential of the market across different segments such as vehicle type, connectivity standards, application, and geography. The study identifies and analyzes the market dynamics such as drivers, restraints, opportunities, and industry-specific challenges for the market. It also profiles the key players operating in the market. The demand for in-vehicle networking in automobiles is expected to increase owing to the increasing vehicle production and rising trend of vehicle electrification. The base year considered for the study is 2015, and forecast period is from 2016 to 2022.
According to the MarketsandMarkets forecast, the in-vehicle networking market size, in terms of value, is expected to grow from USD 838.6 Million in 2015 to USD 1,366.0 Million by 2022, at a CAGR of 7.32% between 2016 and 2022. The market size, in terms of volume, is expected to reach 1.38 billion units by 2022, at a CAGR of 7.14% between 2016 and 2022. The major growth drivers for the market include the increasing vehicle production, increase in the use of electronics in vehicles, demand for advanced safety, convenience, and comfort systems, and increasing focus on CO2 emission reduction from the vehicles.
The scope of this report covers the in-vehicle networking market on the basis of vehicle types, connectivity standards, applications, and geography. The in-vehicle networking for passenger car segment is expected to hold the largest market share during the forecast period. The market for AGV segment is expected to grow at the highest rate during the forecast period.
The in-vehicle networking market for passenger car held the largest size in terms of vehicle type in 2015. Passenger cars comprise sedans, hatchbacks, station wagons, sport utility vehicle (SUVs), multi-utility vehicles (MUVs), and vans. This is the most promising market for in-vehicle networking owing to the fact that this is the largest segment in the automotive industry.
The market for the infotainment application is also expected to gain momentum during the forecast period. Automotive infotainment applications are becoming increasingly complex as the demand for these systems extend to higher interaction between systems and the vehicle.
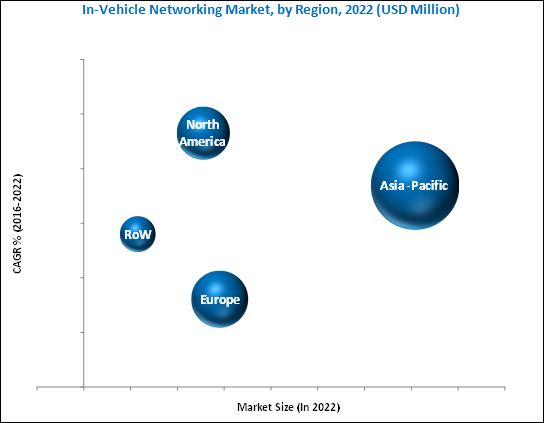
The APAC held a major share of the in-vehicle networking market mainly because the region has emerged as a major automotive hub with a maximum market share in terms of vehicle production as well as sales. The APAC region held the largest share of the global market in 2015; however, North America is the most promising region for the market and is expected to grow at the highest rate as the region is one of the most technologically advanced automotive sectors. The demand for premium cars with high semiconductor content is more in the region.
The major challenge for the companies in the market is maintaining balance between cost and quality of the product and continuous optimization of component size. The major vendors in the in-vehicle networking market include NXP Semiconductor NV (Netherlands), Infineon Technologies AG (Germany), Texas Instruments, Inc. (U.S.), Robert Bosch GmbH (Germany), and Xilinx, Inc. (U.S.). These players adopted various strategies such as new product developments, mergers, partnerships, collaborations, and business expansion to cater to the needs of the market.
To speak to our analyst for a discussion on the above findings, click Speak to Analyst
 Exclusive indicates content/data unique to MarketsandMarkets and not available with any competitors.
Table of Contents
1 Introduction (Page No. - 15)
1.1 Objectives of the Study
1.2 Market Definition
1.3 Scope of the Study
1.3.1 Markets Covered
1.3.2 Years Considered for the Study
1.4 Currency
1.5 Limitations
1.6 Stakeholders
2 Research Methodology (Page No. - 18)
2.1 Research Data
2.1.1 Secondary Data
2.1.1.1 List of Major Secondary Sources
2.1.1.2 Key Data From Secondary Sources
2.1.2 Primary Data
2.1.2.1 Primary Interviews With Experts
2.1.2.2 Breakdown of Primaries
2.1.2.3 Key Data From Primary Sources
2.2 Secondary and Primary Research
2.2.1 Key Industry Insights
2.3 Market Size Estimation
2.3.1 Bottom-Up Approach
2.3.1.1 Approach to Capture Market Shares of Applications Through Bottom-Up Analysis (Demand Side)
2.3.1.2 Approach to Capture Market Shares of Applications With the Help of Various Players in the Market Value Chain
2.3.2 Top-Down Approach
2.3.2.1 Approach to Capture Market Shares of Applications Through Top-Down Analysis (Supply Side)
2.4 Market Breakdown and Data Triangulation
2.5 Research Assumptions
2.5.1 Assumptions
3 Executive Summary (Page No. - 29)
4 Premium Insights (Page No. - 33)
4.1 Attractive Opportunities in the In-Vehicle Networking Market
4.2 Market, By Connectivity Standard
4.3 Market, By Application
4.4 Market, By Vehicle Type
4.5 Market, By Region
5 Market Overview (Page No. - 36)
5.1 Introduction
5.2 Segmentation of the In-Vehicle Network Market
5.2.1 Market, By Connectivity Standard
5.2.2 Market, By Vehicle Type
5.2.3 Market, By Application
5.2.4 Market, By Geography
5.3 Market Evolution of Automotive Electronics
5.3.1 Wiring
5.3.2 Hubs
5.3.3 Switches
5.3.4 Bridges
5.3.5 Routers
5.3.6 Gateways
5.3.7 Sensors
5.3.8 Wireless Access Points (Waps)
5.3.9 Transceivers
5.3.10 Terminal Adapters
5.4 Market Dynamics
5.4.1 Drivers
5.4.1.1 Rising Vehicle Production Across the Globe
5.4.1.2 Increase in the Use of Electronics in Vehicles
5.4.1.3 Growing Demand for Advanced Safety, Convenience, and Comfort Systems
5.4.1.4 Increasing Focus on Reducing Co2 Emission in Vehicles
5.4.2 Restraints
5.4.2.1 Intense Pricing Pressure From Low-End Cars and Emerging Markets
5.4.3 Opportunities
5.4.3.1 Growing Demand for Hybrid and Electric Vehicles
5.4.4 Challenges
5.4.4.1 Miniaturization of Networking Components
5.4.5 Burning Issues
5.4.5.1 Volatility of Oil Prices
5.4.6 Winning Imperatives
5.4.6.1 Emergence of Autonomous and Connected Cars
6 Industry Trends (Page No. - 51)
6.1 Introduction
6.2 Value Chain Analysis
6.3 Porter’s Five Forces Analysis
6.3.1 Intensity of Competitive Rivalry
6.3.2 Threat of Substitutes
6.3.3 Bargaining Power of Buyers
6.3.4 Bargaining Power of Suppliers
6.3.5 Threat of New Entrants
7 In Vehicle Networking Market, By Connectivity Standard (Page No. - 59)
7.1 Introduction
7.2 Controller Area Network (CAN)
7.3 Local Interconnect Network (LIN)
7.4 Flexray
7.5 Radio-Frequency (RF)
7.6 Ethernet
7.7 Media Oriented Systems Transport (MOST)
8 In Vehicle Networking Market, By Vehicle Type (Page No. - 63)
8.1 Introduction
8.2 Passenger Cars
8.3 Light Commercial Vehicles (LCVS)
8.4 Heavy Commercial Vehicles (HCVS)
8.5 Automated Guided Vehicles (AGV)
9 In Vehicle Networking Market, By Application (Page No. - 82)
9.1 Introduction
9.2 Powertrain
9.3 Safety
9.4 Body Electronics
9.5 Chassis
9.6 Infotainment
10 Regional Analysis (Page No. - 97)
10.1 Introduction
10.2 North America
10.2.1 Increased Production of Suvs and Light Trucks is Expected to Drive the Market
10.2.2 U.S.
10.2.3 Mexico
10.2.4 Canada
10.3 Europe
10.3.1 Presence of Various Luxury Car Manufacturers is the Major Driver of the Market
10.3.2 Germany
10.3.3 France
10.3.4 U.K.
10.3.5 Spain
10.3.6 Rest of Europe
10.4 Asia-Pacific
10.4.1 APAC Holds the Largest Market Share in Terms of Vehicle Production
10.4.2 China
10.4.3 Japan
10.4.4 South Korea
10.4.5 India
10.4.6 Rest of APAC
10.5 Rest of the World
10.5.1 South America is the Largest Market for In-Vehicle Networking in the RoW Region
10.5.2 South America
10.5.3 Russia
10.5.4 Middle-East and Africa
11 Competitive Landscape (Page No. - 114)
11.1 Introduction
11.2 Ranking of Market Players, 2015
11.3 Competitive Scenario and Trends
11.3.1 New Product Launches, Product Developments and Patents
11.3.2 Alliances, Business Expansions and Contracts
11.3.3 Mergers & Acquisitions
12 Company Profiles (Page No. - 120)
12.1 Introduction
(Business Overview, Products & Services, Key Insights, Recent Developments, SWOT Analysis, Ratio Analysis, MnM View)*
12.2 NXP Semiconductors N.V.
12.3 Infineon Technologies AG
12.4 Texas Instruments Incorporated
12.5 Robert Bosch GmbH
12.6 Xilinx, Inc.
12.7 Stmicroelectronics N.V.
12.8 On Semiconductor Corp.
12.9 Atmel Corporation
12.10 Microchip Technology Inc.
12.11 Melexis NV
12.12 Elmos Semicondustor AG
*Details on Business Overview, Products & Services, Key Insights, Recent Developments, SWOT Analysis, MnM View Might Not Be Captured in Case of Unlisted Companies.
13 Appendix (Page No. - 152)
13.1 Insights of Industry Experts
13.2 Discussion Guide
13.3 Knowledge Store: Marketsandmarkets’ Subscription Portal
13.4 Introducing RT: Real-Time Market Intelligence
13.5 Available Customizations
13.6 Related Reports
13.7 Author Details
List of Tables (76 Tables)
Table 1 Key Safety and Driver Assistant System Regulations
Table 2 Rising Vehicle Production Across the Globe and Increase in the Use of Electronics in Vehicles Propel the Growth of the In-Vehicle Networking Market
Table 3 Price Pressure From Low-End Cars Restrains the Growth of the In-Vehicle Networking Market
Table 4 Government Incentives for the Use of Electric Vehicles in Countries Across the Globe
Table 5 Growing Demand for Hybrid and Electric Vehicles Offers Growth Opportunities for the In-Vehicle Networking Market
Table 6 Maintaining Balance Between Cost and Quality of the Product is A Major Challenge for the In-Vehicle Networking Market
Table 7 Autonomous Driving Attempts Among Automakers
Table 8 Porter’s Five Forces Analysis: Intensity of Competitive Rivalry Had the Maximum Impact on the Overall Market in 2015
Table 9 Market, By Connectivity Standard, 2013–2022 (USD Million)
Table 10 Market, By Vehicle Type, 2013-2022 (USD Million)
Table 11 Market, By Vehicle Type, 2013-2022 (Million Units)
Table 12 Passenger Cars: Market, By Application, 2013-2022 (USD Million)
Table 13 Passenger Cars: Market, By Application, 2013-2022 (Million Units)
Table 14 Passenger Cars: Market, By Region, 2013-2022 (USD Million)
Table 15 Passenger Cars: Market, By Region, 2013-2022 (Million Units)
Table 16 Passenger Cars: North America Market, By Country, 2013-2022 (USD Million)
Table 17 Passenger Cars: Europe Market, By Country, 2013-2022 (USD Million)
Table 18 Passenger Cars: Asia-Pacific Market, By Country, 2013-2022 (USD Million)
Table 19 LCV: Market, By Application, 2013-2022 (USD Million)
Table 20 LCV: Market, By Application, 2013-2022 (Million Units)
Table 21 LCV: Market, By Region, 2013-2022 (USD Million)
Table 22 LCV: Market, By Region, 2013-2022 (Million Units)
Table 23 LCV: North America Market, By Country, 2013-2022 (USD Million)
Table 24 LCV: Europe Market, By Country, 2013-2022 (USD Million)
Table 25 LCV: Asia-Pacific Market, By Country, 2013-2022 (USD Million)
Table 26 HCV: Market, By Application, 2013-2022 (USD Million)
Table 27 HCV: Market, By Application, 2013-2022 (Million Units)
Table 28 HCV: Market, By Region, 2013-2022 (USD Million)
Table 29 HCV: Market, By Region, 2013-2022 (Million Units)
Table 30 HCV: North America Market, By Country, 2013-2022 (USD Million)
Table 31 HCV: Europe Market, By Country, 2013-2022 (USD Million)
Table 32 HCV: Asia-Pacific Market, By Country, 2013-2022 (USD Million)
Table 33 AGV: Market, By Application, 2013-2022 (USD Million)
Table 34 AGV: Market, By Application, 2013-2022 (Million Units)
Table 35 AGV: Market, By Region, 2013-2022 (USD Million)
Table 36 AGV: Market, By Region, 2013-2022 (Million Units)
Table 37 Market, By Application, 2013-2022 (USD Million)
Table 38 Market, By Application, 2013-2022 (Million Units)
Table 39 Powertrain: Market, By System, 2013-2022 (USD Million)
Table 40 Powertrain: Market, By System, 2013-2022 (Million Units)
Table 41 Powertrain: Market, By Vehicle Type, 2013-2022 (USD Million)
Table 42 Powertrain: Market, By Vehicle Type, 2013-2022 (Million Units)
Table 43 Safety: Market, By System, 2013-2022 (USD Million)
Table 44 Safety: Market, By System, 2013-2022 (Million Units)
Table 45 Safety: Market, By Vehicle Type, 2013-2022 (USD Million)
Table 46 Safety: Market, By Vehicle Type, 2013-2022 (Million Units)
Table 47 Body Electronics: Market, By System, 2013-2022 (USD Million)
Table 48 Body Electronics: Market, By System, 2013-2022 (Million Units)
Table 49 Body Electronics: Market, By Vehicle Type, 2013-2022 (USD Million)
Table 50 Body Electronics: Market, By Vehicle Type, 2013-2022 (Million Units)
Table 51 Chassis: Market, By System, 2013-2022 (USD Million)
Table 52 Chassis: Market, By System, 2013-2022 (Million Units)
Table 53 Chassis: Market, By Vehicle Type, 2013-2022 (USD Million)
Table 54 Chassis: Market, By Vehicle Type, 2013-2022 (Million Units)
Table 55 Infotainment: Market, By System, 2013-2022 (USD Million)
Table 56 Infotainment: Market, By System, 2013-2022 (Million Units)
Table 57 Infotainment: Market, By Vehicle Type, 2013-2022 (USD Million)
Table 58 Infotainment: Market, By Vehicle Type, 2013-2022 (Million Units)
Table 59 Market, By Region, 2013–2022 (USD Million)
Table 60 Market, By Region, 2013–2022 (Million Units)
Table 61 North America Market, By Vehicle Type, 2013–2022 (USD Million)
Table 62 North America Market, By Vehicle Type, 2013–2022 (Million Units)
Table 63 North America Market, By Country, 2013–2022 (USD Million)
Table 64 Europe Market, By Vehicle Type, 2013–2022 (USD Million)
Table 65 Europe Market, By Vehicle Type, 2013–2022 (Million Units)
Table 66 Europe Market, By Country, 2013–2022 (USD Million)
Table 67 Asia-Pacific Market, By Vehicle Type, 2013–2022 (USD Million)
Table 68 Asia-Pacific Market, By Vehicle Type, 2013–2022 (Million Units)
Table 69 Asia-Pacific Market, By Country, 2013–2022 (USD Million)
Table 70 RoW Market, By Vehicle Type, 2013–2022 (USD Million)
Table 71 RoW Market, By Vehicle Type, 2013–2022 (Million Units)
Table 72 RoW Market, By Region, 2013–2022 (USD Million)
Table 73 Ranking of Players in Market, 2015
Table 74 New Product Launches, Product Developments and Patents, 2014-2016
Table 75 Alliances, Business Expansions and Contracts, 2013-2015
Table 76 Mergers & Acquisitions, 2015–2016
List of Figures (69 Figures)
Figure 1 In-Vehicle Networking Market Segmentation
Figure 2 In-Vehicle Networking Market: Research Design
Figure 3 Market Size Estimation Methodology: Bottom-Up Approach
Figure 4 Market Size Estimation Methodology: Top-Down Approach
Figure 5 Data Triangulation
Figure 6 Global In-Vehicle Networking Market, 2016–2022
Figure 7 The Infotainment Application Segment is Expected to Be the Largest Segment of the Market By 2022
Figure 8 The Passenger Cars Segment is Estimated to Dominate the Market in 2016
Figure 9 The Flexray Segment is Estimated to Lead the Market in 2016
Figure 10 Asia-Pacific Accounted for the Largest Share of the Market in 2015
Figure 11 Increasing Use of Electronics in Automobiles is Expected to Fuel the Growth of the Market
Figure 12 Flexray is Expected to Be the Largest Segment of the Market in 2016
Figure 13 The Infotainment Application Segment is Estimated to Lead the Market Throughout the Forecast Period
Figure 14 The Passenger Cars Segment is Estimated to Dominate the Market During the Forecast Period
Figure 15 Europe is Expected to Be the Largest Market for In-Vehicle Networking By 2022
Figure 16 In-Vehicle Networking Market: By Geography
Figure 17 Technology Road Map for Automotive Electronics
Figure 18 In-Vehicle Networking Market, By Components
Figure 19 Increase in Vehicle Production Worldwide is Expected to Drive the Market for In-Vehicle Networking During the Forecast Period
Figure 20 Global Vehicle Production During 2013–2020 (Million Units)
Figure 21 Vehicle Electrification Market, By Key Technology, 2014 (Million Units)
Figure 22 Global Electric Vehicles Production, 2013–2020 (Units)
Figure 23 Global Crude Oil Prices, 2005–2015 (USD/Barrel)
Figure 24 Value Chain Analysis: In-Vehicle Networking Market
Figure 25 The Porter’s Five Forces Analysis, 2015
Figure 26 In-Vehicle Networking Market: Porter’s Five Forces Analysis, 2015
Figure 27 High Impact of Intensity of Competitive Rivalry on the In-Vehicle Networking Market
Figure 28 Low Impact of Threat of Substitutes on the In-Vehicle Networking Market
Figure 29 Medium Impact of Bargaining Power of Buyers on the In-Vehicle Networking Market
Figure 30 Low Impact of Bargaining Power of Suppliers on the In-Vehicle Networking Market
Figure 31 Medium Impact of Threat of New Entrants on the In-Vehicle Networking Market
Figure 32 In-Vehicle Networking Market, By Connectivity Standard
Figure 33 Network Diagram of In-Vehicle Communications
Figure 34 In-Vehicle Networking Market, By Vehicle Type
Figure 35 Passenger Cars Segment Expected to Hold the Largest Market Share in 2022
Figure 36 Body Electronics Segment Expected to Hold the Largest Market Share By 2022
Figure 37 Infotainment Segment Expected to Hold the Largest Market Share By 2022
Figure 38 LCV: In-Vehicle Networking in Europe, By Country
Figure 39 AGV: In-Vehicle Networking, By Application
Figure 40 In-Vehicle Networking, By Application
Figure 41 Infotainment Segment Estimated to Hold the Largest Market Share in 2016
Figure 42 Electronic Stability Control Segment Estimated to Hold the Largest Market Share in 2016
Figure 43 Passenger Cars Segment Estimated to Hold the Largest Market Share in 2016
Figure 44 Audio/Video System Segment Estimated to Hold the Largest Market Share in 2016
Figure 45 Regional Snapshot: Market in India Estimated to Grow at the Highest CAGR During the Forecast Period
Figure 46 North America: In-Vehicle Networking Snapshot
Figure 47 Europe: In-Vehicle Networking Snapshot
Figure 48 Asia-Pacific: In-Vehicle Networking Snapshot
Figure 49 Companies Adopted Product Innovation as the Key Growth Strategy
Figure 50 Market Evaluation Framework: New Product Launches, Contracts and Alliances are the Most Adopted Strategies Between 2014 and 2016
Figure 51 New Product Launches and New Product Developments Were the Key Strategies Adopted Between 2013 and 2015
Figure 52 Geographic Revenue Mix of the Major Market Players
Figure 53 NXP Semiconductors N.V.: Company Snapshot
Figure 54 NXP Semiconductors : SWOT Analysis
Figure 55 Infineon Technologies AG: Company Snapshot
Figure 56 Infineon Technologies AG: SWOT Analysis
Figure 57 Texas Instruments Incorporated: Company Snapshot
Figure 58 Texas Instruments Incorporated: SWOT Analysis
Figure 59 Robert Bosch GmbH: Company Snapshot
Figure 60 Robert Bosch GmbH: SWOT Analysis
Figure 61 Xilinx, Inc.: Company Snapshot
Figure 62 Xilinx, Inc.: SWOT Analysis
Figure 63 Stmicroelectronics N.V.: Company Snapshot
Figure 64 Stmicroelectronics N.V.: SWOT Analysis
Figure 65 on Semiconductor Corp.: Company Snapshot
Figure 66 Atmel Corporation: Company Snapshot
Figure 67 Microchip Technology Inc.: Company Snapshot
Figure 68 Melexis NV: Company Snapshot
Figure 69 Elmos Semiconductor AG: Company Snapshot
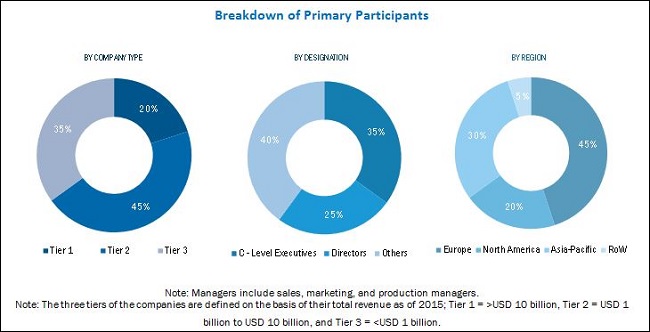
The research methodology used to estimate and forecast the in-vehicle networking market begins with capturing data on key vendor revenues through secondary research. Some of the secondary sources include associations such as Organisation Internationale des Constructeurs d'Automobiles (OCIA), International Council on Clean Transportation, and International Organization of Motor Vehicle Manufacturers, among others. The vendor offerings have also been taken into consideration to determine the market segmentation. The bottom-up procedure has been employed to arrive at the overall market size of the global market from the revenue of the key players in the market. After arriving at the overall market size, the total market has been split into several segments and subsegments, which have then been verified through primary research by conducting extensive interviews with key people such as CEOs, VPs, directors, and executives. The data triangulation and market breakdown procedures have been employed to complete the overall market engineering process and arrive at the exact statistics for all segments and subsegments. The breakdown of profiles of the primary respondents has been depicted in the figure below:
To know about the assumptions considered for the study, download the pdf brochure
The in-vehicle networking ecosystem includes raw material suppliers; semiconductor manufacturers such as NXP Semiconductor NV (Netherlands), Infineon Technologies AG (Germany), Texas Instruments, Inc. (U.S.), Robert Bosch GmbH (Germany), Xilinx, Inc. (U.S.), STMicroelectronics NV (Switzerland), ON Semiconductor Corp. (U.S.), Atmel Corporation (U.S.), Microchip Technology Inc. (U.S.), Elmos Semiconductor AG (Germany), and Melexis Semiconductors (Belgium); system integrators; automobile manufacturers; and end users.
Key Target Audience:
- Raw material suppliers
- Semiconductor component and device manufacturers
- Original equipment manufacturers (OEMs)—white label manufacturing for others in bulk volume
- Component and device suppliers and distributors
- Automotive control system integrators
- Automobile manufacturers
- Software, services, and technology providers
- Standardization and testing firms
- Government bodies such as regulating authorities and policy makers
- Associations, organizations, forums, and alliances related to semiconductor and automotive industries, research institutes and organizations
- Market research and consulting firms
Scope of the Report:
The in-vehicle networking market has been covered in detail in this report. To provide a holistic picture, the current market demand and forecasts have also been included in the report. The market has been segmented as follows:
By Vehicle Type:
- Passenger Cars
- LCVs
- HCVs
- AGVs
By Application:
- Powertrain
- Safety
- Body Electronics
- Chassis
- Infotainment
By Connectivity Standards:
- CAN
- LIN
- FlexRay
- RF
- Ethernet
- MOST
By Geography:
- North America
- Europe
- APAC
- RoW
Available Customizations:
With the given market data, MarketsandMarkets offers customizations according to the company’s specific needs. The following customization options are available for the report:
Application Analysis:
- Market numbers for various sub-segments of application can be given in the customization.
Company Information:
- Detailed analysis and profiling of additional market players


Growth opportunities and latent adjacency in In-Vehicle Networking Market