Industrial Catalyst Market by Type (Heterogeneous & Homogeneous), by Material (Metal, Chemical, Zeolites and Organometallic Materials), by Application and by Region - Global Trends and Forecasts to 2020


The industrial catalyst market was worth USD 17.15 Billion, in 2014, expected to register a CAGR of 4.2% between 2015 and 2020. In this study, 2013 has been considered as the historical year and 2014 as the base year for estimating market size of industrial catalyst. Industrial catalyst is widely used in petroleum refining, chemical synthesis, and petrochemicals.
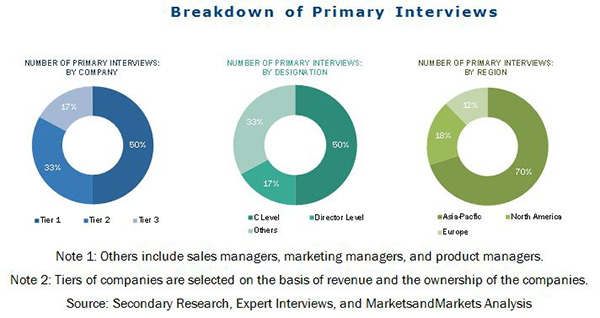
Different secondary sources such as company websites, encyclopedia, directories, and databases have been used to identify and collect information useful for this extensive commercial study of the industrial catalyst market. The primary sources, which include experts from related industries, have been interviewed to verify and collect critical information as well as to assess the prospects of the market. The top-down approach has been implemented to validate the market size in terms of value and volume. The exact values of the overall parent market size and individual market sizes have been determined and confirmed in this study with the data triangulation procedure and validation of data through primary interviews.
The industrial catalyst market has a diversified and established ecosystem of its upstream players such as the raw material suppliers, and the downstream stakeholders such as manufacturers, vendors, end users, and government organizations. The major raw material suppliers are Zeolyst International, W.R. Grace and Co., Anten Chemical Co., and KNT Group, which supply raw material such as metal, chemical, zeolites, and organometallic materials to the industrial catalyst manufacturers such as Albemarle Corporation (U.S.), BASF SE (Germany), Clariant AG (Switzerland), and AkzoNobel N.V. (The Netherlands), The DOW Chemicals Company (U.S.), among others.
This study answers several questions for the stakeholders; primarily, which market segments to focus on in the next two to five years for prioritizing the efforts and investments. These stakeholders include the industrial catalyst manufacturers such as the ExxonMobil Chemical Co. (U.S.), E.I DU Pont de Nemours & Company (U.S.), and Chevron Philips Chemical Company (U.S.), Arkema SA (France), and Evonik Industries AG (Germany), among others.
Scope of the Report:
This research report categorizes the market for industrial catalyst based on type, material, application, and region and forecasts revenue growth and analysis of trends in each of the submarkets.
On the Basis of Type: The industrial catalyst market is segmented on the basis of type, such as heterogeneous and homogeneous. Each type is further described in detail in the report with value and volume forecasts till 2020.
On the Basis of Material: The market is segmented on the basis of material, such as, metal, chemical, zeolites and organometallic materials. Each material is further described in detail in the report with value and volume forecasts till 2020. Metal and chemical are further classified and described in detail in the report with value and volume forecasts till 2020.
On the Basis of Application: The market is segmented on the basis of applications that include Petroleum Refining, Chemical Synthesis, Petrochemicals, and Others. Each application segment is further described in detail in the report with value and volume forecasts till 2020.
On the Basis of Region: The industrial catalyst market is segmented, by region, as Asia-Pacific, North America, Europe, and RoW. Each region is further segmented, by key countries, such as China, Japan, South Korea, India, the U.S., Mexico, Canada, Germany, Italy, France, the U.K., and Brazil.
Available Customizations: The following customization options are available in the report:
- Company Information
Analysis and profiling of additional global as well as regional market players (up to three)
The industrial catalyst market size, in terms of value, is projected to reach USD 22 Billion by 2020, at a CAGR of 4.2%, between 2015 and 2020. The market, in terms of volume, is projected to reach 6,420.6 kilotons, by 2020, at a CAGR of 3.8%, during the forecast period. The increasing applications, growing manufacturing industries, increasing R&D activities, continuous expansion, and merger & acquisition activities undertaken by companies are key factors responsible for the growth of the industrial catalyst market.
The heterogeneous catalyst are projected to be the fastest-growing type of industrial catalyst between 2015 and 2020. It is preferred by the major manufacturers owing to its characteristic of being easily separated from the products. Organometallic material is projected to register the fastest-growth among materials, followed by metals, in the market. Metal is the most preferred material used in the manufacturing of the industrial catalyst market. The demand for metals is mainly driven by to the growing application sector. Petroleum refining is the largest application segment in the market. The increase in refinery capacity and the demand for fuels have led to an increase in the use of catalyst in this application.
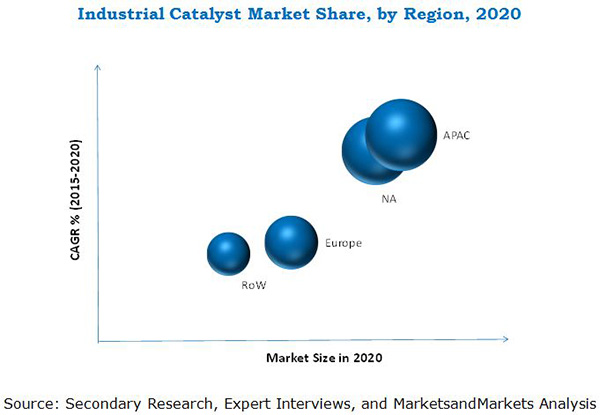
The Asia-Pacific region, being the largest market for industrial catalyst is also projected to register a high CAGR in the industrial catalyst market, in terms of value, between 2015 and 2020. This growth is mainly driven due to an increase in the industrial catalyst demand in various application sectors, such as petroleum refining, chemical synthesis, and petrochemicals.
Though the industrial catalyst market is gaining importance at a fast pace, a few factors act as a bottleneck toward the growth of market. The limited availability of industrial catalyst raw materials and higher production costs of industrial catalyst are major restraints toward the growth of the market. The technological advancements in chemical synthesis also reduce the demand of catalyst.
The companies such as Albemarle Corporation (U.S.), BASF SE (Germany), Clariant AG (Switzerland), The DOW Chemicals Company (U.S.), ExxonMobil Chemical Co. (U.S.), E and Chevron Philips Chemical Company (U.S.), are the dominant market players in the industrial catalyst market. The diverse product portfolio and strategically positioned R&D centers, continuous adoption of development strategies, and technological advancements are a few factors that are responsible for strengthening the market position of these companies in the industrial catalyst market. They have been adopting various organic and inorganic growth strategies such as expansion, merger & acquisition, partnership, new product launch & product development to enhance their revenue in the market. This would help the market to evolve in further applications, which would, in turn, help them to expand their global reach.
 Exclusive indicates content/data unique to MarketsandMarkets and not available with any competitors.
Table of Contents
1 Introduction (Page No. - 20)
1.1 Objectives of the Study
1.2 Market Definition
1.3 Market Scope
1.3.1 Markets Covered
1.3.2 Years Considered for the Study
1.4 Currency
1.5 Limitations
1.6 Stakeholders
2 Research Methodology (Page No. - 23)
2.1 Research Data
2.1.1 Secondary Data
2.1.1.1 Key Data From Secondary Sources
2.1.2 Primary Data
2.1.2.1 Key Data From Primary Sources
2.1.2.2 Key Industry Insights
2.1.2.3 Breakdown of Primary Interviews
2.2 Market Size Estimation
2.3 Market Breakdown & Data Triangulation
2.4 Research Assumptions
3 Executive Summary (Page No. - 31)
4 Premium Insights (Page No. - 35)
4.1 Attractive Opportunities
4.1 Industrial Catalyst Market: By Type
4.2 Market Share, By Value
4.3 Market Attractiveness
4.4 Market: Developing vs Developed Nations
4.5 Lifecycle Analysis, By Region (2014)
5 Market Overview (Page No. - 40)
5.1 Introduction
5.2 Market Segmentation
5.2.1 By Type
5.2.2 By Material
5.2.3 By Application
5.2.4 By Region
5.3 Market Dynamics
5.3.1 Drivers
5.3.1.1 Increasing Growth of the Refinery Industry
5.3.1.2 Rising Demand From Application Sectors
5.3.1.3 Growing Consumption of Fuels and Other Chemical Products
5.3.2 Restraints
5.3.2.1 Technological Advancements in Chemical Synthesis Reduces Catalyst Consumption
5.3.3 Opportunities
5.3.3.1 R&D Activities to Reduce Costs and to Improve the Quality of Catalysts
6 Industry Trends (Page No. - 46)
6.1 Introduction
6.2 Supply-Chain Analysis
6.2.1 Raw Material Suppliers
6.2.2 R&D
6.2.3 Manufacturers
6.2.4 End Users
6.3 Porter�s Five Forces Analysis
6.3.1 Threat of New Entrants
6.3.2 Bargaining Power of Buyers
6.3.3 Threat of Substitutes
6.3.4 Bargaining Power of Suppliers
6.3.5 Intensity of Rivalry
6.4 Raw Material Overview
6.5 Regulatory Framework
7 Industrial Catalyst Market, By Material (Page No. - 52)
7.1 Introduction
7.1.1 Metals
7.1.1.1 Base Metals
7.1.1.2 Precious Metals
7.1.2 Chemicals
7.1.2.1 Peroxides
7.1.2.2 Acids
7.1.2.3 Amines and Other Chemicals
7.1.3 Zeolites
7.1.4 Organometallic Material
8 Market, By Type (Page No. - 61)
8.1 Introduction
8.2 Market Size & Projection
8.3 Heterogeneous Catalyst
8.4 Homogeneous Catalyst
9 Industrial Catalyst Market, By Application (Page No. - 67)
9.1 Introduction
9.2 Petroleum Refinery
9.3 Chemical Synthesis
9.4 Petrochemicals
9.5 Others
10 Regional Analysis (Page No. - 73)
10.1 Introduction
10.2 Asia-Pacific
10.2.1 China
10.2.2 Japan
10.2.3 South Korea
10.2.4 India
10.2.5 Rest of Asia-Pacific
10.3 North America
10.3.1 U.S.
10.3.2 Canada
10.3.3 Mexico
10.4 Europe
10.4.1 Germany
10.4.2 Italy
10.4.3 U.K.
10.4.4 France
10.4.5 Rest of Europe
10.5 RoW
10.5.1 Brazil
10.5.2 Rest of RoW
11 Competitive Landscape (Page No. - 145)
11.1 Overview
11.2 Expansion: the Most Popular Growth Strategy
11.3 Competitive Situations and Trends
11.3.1 Expansion
11.3.2 New Product Launch
11.3.3 Acquisition
11.3.4 Joint Venture & Agreement
12 Company Profiles (Page No. - 151)
(Overview, Financial*, Products & Services, Strategy, and Developments)
12.1 Introduction
12.2 Albemarle Corporation
12.3 BASF SE
12.4 Exxon Mobil Chemical Corporation
12.5 Akzonobel N.V.
12.6 Chevron Phillips Chemical Company
12.7 Arkema SA
12.8 The DOW Chemical Company
12.9 Evonik Industries AG
12.10 E.I. Du Pont De Nemours and Company (Dupont)
12.11 Clariant AG
*Details Might Not Be Captured in Case of Unlisted Companies
13 Appendix (Page No. - 176)
13.1 Insights From Industrial Experts
13.2 Discussion Guide
13.3 Introducing RT: Real Time Market Intelligence
13.4 Available Customizations
13.5 Related Reports
List of Tables (238 Tables)
Table 1 Industrial Catalyst Market, By Type
Table 2 Market, By Material
Table 3 Market, By Application
Table 4 Raw Materials for Industrial Catalysts
Table 5 Industrial Catalyst Market Size, By Material, 2013-2020 (USD Million)
Table 6 Industrial Catalyst Market Size, By Material, 2013-2020 (Kiloton)
Table 7 Industrial Catalyst Market Size in Metals, By Particular, (Volume and Value), 2013�2020
Table 8 Industrial Catalyst Market Size, By Metal Type, (Value), 2013�2020
Table 9 Industrial Catalyst Market Size, By Metal Type, (Volume), 2013�2020
Table 10 Industrial Catalyst Market Size in Base Metals, By Particular, (Volume and Value), 2013�2020
Table 11 Industrial Catalyst Market Size in Precious Metals, By Particular, (Volume and Value), 2013�2020
Table 12 Industrial Catalyst Market Size in Chemicals, By Particular, (Volume and Value), 2013�2020
Table 13 Industrial Catalyst Market Size, By Chemical Type, (Value), 2013�2020
Table 14 Industrial Catalyst Market Size in Chemicals, By Chemical, (Volume), 2013�2020
Table 15 Industrial Catalyst Market Size in Peroxides, By Particular, (Volume and Value), 2013�2020
Table 16 Industrial Catalyst Market Size in Acids, By Particular, (Volume and Value), 2013�2020
Table 17 Industrial Catalyst Market Size in Amines and Other Chemicals, By Particular, (Volume and Value), 2013�2020
Table 18 Structural Characteristics of Zeolites
Table 19 Petroleum Refinery and Petrochemical Applications Using Zeolite-Based Catalyst
Table 20 Industrial Catalyst Market Size in Zeolites, By Particular, (Volume and Value), 2013�2020
Table 21 Industrial Catalyst Market Market Size in Organometallic , By Particular, (Volume and Value), 2013�2020
Table 22 Industrial Catalyst Market Market Size, By Type, 2013-2020 (USD Million)
Table 23 Industrial Catalyst Market Market Size, By Type, 2013-2020 (Kiloton)
Table 24 Examples of Industrial Processes Using Heterogeneous Catalysis
Table 25 Heterogeneous Catalyst Market Size, By Particular, (Volume and Value), 2013-2020
Table 26 Examples of Industrial Processes Using Homogeneous Catalysis
Table 27 Homogeneous Catalyst Market Size, By Particular, (Volume and Value), 2013-2020
Table 28 Major Differences Between Homogeneous and Heterogeneous Catalysts
Table 29 Industrial Catalyst Market Size, By Application, 2013-2020 (USD Million)
Table 30 Market Size, By Application, 2013-2020 (Kiloton)
Table 31 Market Size in Petroleum Refinery Application, By Particular (Volume and Value), 2013�2020
Table 32 Market Size in Chemical Synthesis Application, By Particular,(Volume and Value), 2013�2020
Table 33 Market Size in Petrochemicals Application, By Particular (Volume and Value), 2013�2020
Table 34 Market Size in Others Application, By Particular (Volume and Value), 2013�2020
Table 35 Market Size, By Region, 2013�2020 (USD Million)
Table 36 Industrial Catalyst Market Size, By Region, 2013�2020 (Kiloton)
Table 37 Asia-Pacific: Market Size, By Country, 2013�2020 (USD Million)
Table 38 Asia-Pacific: Market Size, By Country, 2013�2020 (Kiloton)
Table 39 Asia-Pacific: Market Size, By Material, 2013�2020 (USD Million)
Table 40 Asia-Pacific: Market Size, By Material, 2013�2020 (Kiloton)
Table 41 Asia-Pacific: Market Size, By Metal Type, 2013�2020 (USD Million)
Table 42 Asia-Pacific: Market Size, By Metal Type, 2013�2020 (Kiloton)
Table 43 Asia-Pacific: Market Size, By Chemical Type, 2013�2020 (USD Million)
Table 44 Asia-Pacific: Industrial Catalyst Market Size, By Chemical Type, 2013�2020 (Kiloton)
Table 45 Asia-Pacific: Market Size, By Type, 2013�2020 (USD Million)
Table 46 Asia-Pacific: Market Size, By Type, 2013�2020 (Kiloton)
Table 47 Asia-Pacific: Market Size, By Application, 2013�2020 (USD Million)
Table 48 Asia-Pacific: Market Size, By Application, 2013�2020 (Kiloton)
Table 49 China: Market Size, By Material, 2013�2020 (USD Million)
Table 50 China: Market Size, By Material, 2013�2020 (Kiloton)
Table 51 China: Market Size, By Metal Type, 2013�2020 (USD Million)
Table 52 China: Market Size, By Metal Type, 2013�2020 (Kiloton)
Table 53 China: Market Size, By Chemical Type, 2013�2020 (USD Million)
Table 54 China: Market Size, By Chemical Type, 2013�2020 (Kiloton)
Table 55 China: Market Size, By Type, 2013�2020 (USD Million)
Table 56 China: Market Size, By Type, 2013�2020 (Kiloton)
Table 57 China: Market Size, By Application, 2013�2020 (USD Million)
Table 58 China: Market Size, By Application, 2013�2020 (Kiloton)
Table 59 Japan: Industrial Catalyst Market Size, By Material, 2013�2020 (USD Million)
Table 60 Japan: Market Size, By Material, 2013�2020 (Kiloton)
Table 61 Japan: Market Size, By Metal Type ,2013�2020 (USD Million)
Table 62 Japan: Market Size, By Metal Type, 2013�2020 (Kiloton)
Table 63 Japan: Market Size, By Chemical Type, 2013�2020 (USD Million)
Table 64 Japan: Market Size, By Chemical Type, 2013�2020 (Kiloton)
Table 65 Japan: Market Size, By Type, 2013�2020 (USD Million)
Table 66 Japan: Market Size, By Type, 2013�2020 (Kiloton)
Table 67 Japan: Market Size, By Application, 2013�2020 (USD Million)
Table 68 Japan: Market Size, By Application, 2013�2020 (Kiloton)
Table 69 South Korea: Industrial Catalyst Market Size, By Material, 2013�2020 (USD Million)
Table 70 South Korea: Market Size, By Material, 2013�2020 (Kiloton)
Table 71 South Korea: Market Size, By Metal Type, 2013�2020 (USD Million)
Table 72 South Korea: Market Size, By Metal Type, 2013�2020 (Kiloton)
Table 73 South Korea: Market Size, By Chemical Type, 2013�2020 (USD Million)
Table 74 South Korea: Market Size, By Chemical Type, 2013�2020 (Kiloton)
Table 75 South Korea: Market Size, By Type, 2013�2020 (USD Million)
Table 76 South Korea: Market Size, By Type, 2013�2020 (Kiloton)
Table 77 South Korea: Market Size, By Application, 2013�2020 (USD Million)
Table 78 South Korea: Market Size, By Application, 2013�2020 (Kiloton)
Table 79 India: Industrial Catalyst Market Size, By Material, 2013�2020 (USD Million)
Table 80 India: Market Size, By Material, 2013�2020 (Kiloton)
Table 81 India: Market Size, By Metal Type, 2013�2020 (USD Million)
Table 82 India: Market Size, By Metal Type, 2013�2020 (Kiloton)
Table 83 India: Market Size, By Chemical Type, 2013�2020 (USD Million)
Table 84 India: Market Size, By Chemical Type, 2013�2020 (Kiloton)
Table 85 India: Market Size, By Type, 2013�2020 (USD Million)
Table 86 India: Market Size, By Type, 2013�2020 (Kiloton)
Table 87 India: Market Size, By Application, 2013�2020 (USD Million)
Table 88 India: Market Size, By Application, 2013�2020 (Kiloton)
Table 89 Rest of APAC: Industrial Catalyst Market Size, By Material, 2013�2020 (USD Million)
Table 90 Rest of APAC: Market Size, By Material, 2013�2020 (Kiloton)
Table 91 Rest of APAC: Market Size, By Metal Type, 2013�2020 (USD Million)
Table 92 Rest of APAC: Market Size, By Metal Type, 2013�2020 (Kiloton)
Table 93 Rest of APAC: Market Size, By Chemical Type, 2013�2020 (USD Million)
Table 94 Rest of APAC: Market Size, By Chemical Type, 2013�2020 (Kiloton)
Table 95 Rest of APAC: Market Size, By Type, 2013�2020 (USD Million)
Table 96 Rest of APAC: Market Size, By Type, 2013�2020 (Kiloton)
Table 97 Rest of APAC: Market Size, By Application, 2013�2020 (USD Million)
Table 98 Rest of APAC: Market Size, By Application, 2013�2020 (Kiloton)
Table 99 North America: Industrial Catalyst Market Size, By Country, 2013�2020 (USD Million)
Table 100 North America: Market Size, By Country, 2013�2020 (Kiloton)
Table 101 North America: Market Size, By Material, 2013�2020 (USD Million)
Table 102 North America: Market Size, By Material, 2013�2020 (Kiloton)
Table 103 North America: Market Size, By Metal Type, 2013�2020 (USD Million)
Table 104 North America: Market Size, By Metal Type, 2013�2020 (Kiloton)
Table 105 North America: Market Size, By Chemical Type, 2013�2020 (USD Million)
Table 106 North America: Market Size, By Chemical Type, 2013�2020 (Kiloton)
Table 107 North America: Market Size, By Type, 2013�2020 (USD Million)
Table 108 North America: Market Size, By Type, 2013�2020 (Kiloton)
Table 109 North America: Market Size, By Application, 2013�2020 (USD Million)
Table 110 North America: Market Size, By Application, 2013�2020 (Kiloton)
Table 111 U.S.: Industrial Catalyst Market Size, By Material, 2013�2020 (USD Million)
Table 112 U.S.: Market Size, By Material, 2013�2020 (Kiloton)
Table 113 U.S.: Market Size, By Metal Type, 2013�2020 (USD Million)
Table 114 U.S.: Market Size, By Metal Type, 2013�2020 (Kiloton)
Table 115 U.S.: Market Size, By Chemical Type, 2013�2020 (USD Million)
Table 116 U.S.: Market Size, By Chemical Type, 2013�2020 (Kiloton)
Table 117 U.S.: Market Size, By Type, 2013�2020 (USD Million)
Table 118 U.S.: Market Size, By Type, 2013�2020 (Kiloton)
Table 119 U.S.: Market Size, By Application, 2013�2020 (USD Million)
Table 120 U.S.: Market Size, By Application, 2013�2020 (Kiloton)
Table 121 Canada: Industrial Catalyst Market Size, By Material, 2013�2020 (USD Million)
Table 122 Canada: Market Size, By Material, 2013�2020 (Kiloton)
Table 123 Canada: Market Size, By Metal Type, 2013�2020 (USD Million)
Table 124 Canada: Market Size, By Metal Type, 2013�2020 (Kiloton)
Table 125 Canada: Market Size, By Chemical Type, 2013�2020 (USD Million)
Table 126 Canada: Market Size, By Chemical Type, 2013�2020 (Kiloton)
Table 127 Canada: Market Size, By Type, 2013�2020 (USD Million)
Table 128 Canada: Market Size, By Type, 2013�2020 (Kiloton)
Table 129 Canada: Market Size, By Application, 2013�2020 (USD Million)
Table 130 Canada: Market Size, By Application, 2013�2020 (Kiloton)
Table 131 Mexico: Industrial Catalyst Market Size, By Material, 2013�2020 (USD Million)
Table 132 Mexico: Market Size, By Material 2013�2020 (Kiloton)
Table 133 Mexico: Market Size, By Metal Type, 2013�2020 (USD Million)
Table 134 Mexico: Market Size, By Metal Type, 2013�2020 (Kiloton)
Table 135 Mexico: Market Size, By Chemical Type, 2013�2020 (USD Million)
Table 136 Mexico: Market Size, By Chemical Type, 2013�2020 (Kiloton)
Table 137 Mexico: Market Size, By Type, 2013�2020 (USD Million)
Table 138 Mexico: Market Size, By Type, 2013�2020 (Kiloton)
Table 139 Mexico: Market Size, By Application, 2013�2020 (USD Million)
Table 140 Mexico: Market Size, By Application, 2013�2020 (Kiloton)
Table 141 Europe: Industrial Catalyst Market Size, By Country, 2013�2020 (USD Million)
Table 142 Europe: Market Size, By Country, 2013�2020 (Kiloton)
Table 143 Europe: Market Size, By Material, 2013�2020 (USD Million)
Table 144 Europe: Market Size, By Material 2013�2020 (Kiloton)
Table 145 Europe: Market Size, By Metal Type, 2013�2020 (USD Million)
Table 146 Europe: Market Size, By Metal Type, 2013�2020 (Kiloton)
Table 147 Europe: Market Size, By Chemical Type, 2013�2020 (USD Million)
Table 148 Europe: Market Size, By Chemical Type, 2013�2020 (Kiloton)
Table 149 Europe: Market Size, By Type, 2013�2020 (USD Million)
Table 150 Europe: Market Size, By Type, 2013�2020 (Kiloton)
Table 151 Europe: Market Size, By Application, 2013�2020 (USD Million)
Table 152 Europe: Market Size, By Application, 2013�2020 (Kiloton)
Table 153 Germany: Industrial Catalyst Market Size, By Material, 2013�2020 (USD Million)
Table 154 Germany: Market Size, By Material 2013�2020 (Kiloton)
Table 155 Germany: Market Size, By Metal Type, 2013�2020 (USD Million)
Table 156 Germany: Market Size, By Metal Type, 2013�2020 (Kiloton)
Table 157 Germany: Market Size, By Chemical Type, 2013�2020 (USD Million)
Table 158 Germany: Market Size, By Chemical Type, 2013�2020 (Kiloton)
Table 159 Germany: Market Size, By Type, 2013�2020 (USD Million)
Table 160 Germany: Market Size, By Type, 2013�2020 (Kiloton)
Table 161 Germany: Market Size, By Application, 2013�2020 (USD Million)
Table 162 Germany: Market Size, By Application, 2013�2020 (Kiloton)
Table 163 Italy: Industrial Catalyst Market Size, By Material, 2013�2020 (USD Million)
Table 164 Italy: Market Size, By Material, 2013�2020 (Kiloton)
Table 165 Italy: Market Size, By Metal Type, 2013�2020 (USD Million)
Table 166 Italy: Market Size, By Metal Type, 2013�2020 (Kiloton)
Table 167 Italy: Market Size, By Chemical Type, 2013�2020 (USD Million)
Table 168 Italy: Market Size, By Chemical Type, 2013�2020 (Kiloton)
Table 169 Italy: Market Size, By Type, 2013�2020 (USD Million)
Table 170 Italy: Market Size, By Type, 2013�2020 (Kiloton)
Table 171 Italy: Market Size, By Application, 2013�2020 (USD Million)
Table 172 Italy: Market Size, By Application, 2013�2020 (Kiloton)
Table 173 U.K.: Industrial Catalyst Market Size, By Material, 2013�2020 (USD Million)
Table 174 U.K.: Market Size, By Material, 2013�2020 (Kiloton)
Table 175 U.K.: Market Size, By Metal Type, 2013�2020 (USD Million)
Table 176 U.K.: Market Size, By Metal Type, 2013�2020 (Kiloton)
Table 177 U.K.: Market Size, By Chemical Type, 2013�2020 (USD Million)
Table 178 U.K.: Market Size, By Chemical Type, 2013�2020 (Kiloton)
Table 179 U.K.: Market Size, By Type, 2013�2020 (USD Million)
Table 180 U.K.: Market Size, By Type, 2013�2020 (Kiloton)
Table 181 U.K.: Market Size, By Application, 2013�2020 (USD Million)
Table 182 U.K.: Market Size, By Application, 2013�2020 (Kiloton)
Table 183 France: Industrial Catalyst Market Size, By Material, 2013�2020 (USD Million)
Table 184 France: Market Size, By Material, 2013�2020 (Kiloton)
Table 185 France: Market Size, By Metal Type, 2013�2020 (USD Million)
Table 186 France: Market Size, By Metal Type, 2013�2020 (Kiloton)
Table 187 France: Market Size, By Chemical Type, 2013�2020 (USD Million)
Table 188 France: Market Size, By Chemical Type, 2013�2020 (Kiloton)
Table 189 France: Market Size, By Type, 2013�2020 (USD Million)
Table 190 France: Market Size, By Type, 2013�2020 (Kiloton)
Table 191 France: Market Size, By Application, 2013�2020 (USD Million)
Table 192 France: Market Size, By Application, 2013�2020 (Kiloton)
Table 193 Rest of Europe: Industrial Catalyst Market Size, By Material, 2013�2020 (USD Million)
Table 194 Rest of Europe: Market Size, By Material, 2013�2020 (Kiloton)
Table 195 Rest of Europe: Market Size, By Metal Type, 2013�2020 (USD Million)
Table 196 Rest of Europe: Market Size, By Metal Type, 2013�2020 (Kiloton)
Table 197 Rest of Europe: Market Size, By Chemical Type, 2013�2020 (USD Million)
Table 198 Rest of Europe: Market Size, By Chemical Type, 2013�2020 (Kiloton)
Table 199 Rest of Europe: Market Size, By Type, 2013�2020 (USD Million)
Table 200 Rest of Europe: Market Size, By Type, 2013�2020 (Kiloton)
Table 201 Rest of Europe: Market Size, By Application, 2013�2020 (USD Million)
Table 202 Rest of Europe: Market Size, By Application, 2013�2020 (Kiloton)
Table 203 RoW: Industrial Catalyst Market Size, By Country, 2013�2020 (USD Million)
Table 204 RoW: Market Size, By Country, 2013�2020 (Kiloton)
Table 205 RoW: Market Size, By Material, 2013�2020 (USD Million)
Table 206 RoW: Market Size, By Material, 2013�2020 (Kiloton)
Table 207 RoW: Market Size, By Metal Type, 2013�2020 (USD Million)
Table 208 RoW: Market Size, By Metal Type, 2013�2020 (Kiloton)
Table 209 RoW: Market Size, By Chemical Type, 2013�2020 (USD Million)
Table 210 RoW: Market Size, By Chemical Type, 2013�2020 (USD Million)
Table 211 RoW: Market Size, By Type, 2013�2020 (USD Million)
Table 212 RoW: Market Size, By Type, 2013�2020 (Kiloton)
Table 213 RoW: Market Size, By Application, 2013�2020 (USD Million)
Table 214 RoW: Market Size, By Application, 2013�2020 (Kiloton)
Table 215 Brazil: Industrial Catalyst Market Size, By Material, 2013�2020 (USD Million)
Table 216 Brazil: Market Size, By Material, 2013�2020 (Kiloton)
Table 217 Brazil: Market Size, By Metal Type 2013�2020 (USD Million)
Table 218 Brazil: Market Size, By Metal Type, 2013�2020 (Kiloton)
Table 219 Brazil: Market Size, By Chemical Type, 2013�2020 (USD Million)
Table 220 Brazil: Market Size, By Chemical Type, 2013�2020 (Kiloton)
Table 221 Brazil: Market Size, By Type, 2013�2020 (USD Million)
Table 222 Brazil: Market Size, By Type, 2013�2020 (Kiloton)
Table 223 Brazil: Market Size, By Application, 2013�2020 (USD Million)
Table 224 Brazil: Market Size, By Application, 2013�2020 (Kiloton)
Table 225 Rest of RoW: Industrial Catalyst Market Size, By Material, 2013�2020 (USD Million)
Table 226 Rest of RoW: Market Size, By Material, 2013�2020 (Kiloton)
Table 227 Rest of RoW: Market Size, By Metal Type, 2013�2020 (USD Million)
Table 228 Rest of RoW: Market Size, By Metal Type, 2013�2020 (Kiloton)
Table 229 Rest of RoW: Market Size, By Chemical Type, 2013�2020 (USD Million)
Table 230 Rest of RoW: Market Size, By Chemical Type, 2013�2020 (Kiloton)
Table 231 Rest of RoW: Market Size, By Type, 2013�2020 (USD Million)
Table 232 Rest of RoW: Market Size, By Type, 2013�2020 (Kiloton)
Table 233 Rest of RoW: Market Size, By Application, 2013�2020 (USD Million)
Table 234 Rest of RoW: Market Size, By Application, 2013�2020 (Kiloton)
Table 235 Expansion, 2010�2015
Table 236 New Product Launch, 2010�2015
Table 237 Acquisition, 2010�2015
Table 238 Joint Venture, 2010�2015
List of Figures (49 Figures)
Figure 1 Industrial Catalyst Market Segmentation
Figure 2 Market: Research Design
Figure 3 Market Size Estimation: Top-Down Approach
Figure 4 Market Size Estimation: Bottom-Up Approach
Figure 5 Data Triangulation Methodology
Figure 6 Hetrogeneous Catalyst to Continue Dominating the Industrial Catalyst Market, By Form, Between 2015 and 2020
Figure 7 Petroleum Refining Dominated the Industrial Catalyst Market, By Application, in 2014
Figure 8 Metal to Dominate the Industrial Catalyst Market, By Material, Between 2015 and 2020
Figure 9 Asia-Pacific Industrial Catalyst Market to Register the Fastest Growth During the Projected Period
Figure 10 Asia-Pacific Was the Largest Market for Industrial Catalyst in 2014
Figure 11 Significant Growth in the Industrial Catalyst Market
Figure 12 Heterogeneous Catalyst to Be the Fastest-Growing Industrial Catalysts Between 2015 and 2020
Figure 13 Petroleum Refinery Application Accounted for the Largest Share in the Industrial Catalyst Market in 2014
Figure 14 Industrial Catalyst Market to Register High Growth in Emerging Economies Between 2015 and 2020
Figure 15 U.S. to Emerge as A Lucrative Market for Industrial Catalyst Between 2015 and 2020
Figure 16 High Growth Potential in the Asia-Pacific Region for Industrial Catalysts
Figure 17 Market, By Region
Figure 18 Drivers, Restraints, and Opportunities in Industrial Catalyst Market
Figure 19 Supply-Chain Analysis
Figure 20 Porter�s Five Forces Analysis
Figure 21 Metals Dominated the Industrial Catalyst Market, 2015�2020
Figure 22 Organometallic Material: the Fastest-Growing Material in the Industrial Catalyst Market, 2015�2020
Figure 23 Heterogeneous Catalyst Dominated the Industrial Catalyst Market in 2014
Figure 24 Petroleum Refinery is the Largest Application for Industrial Catalyst, 2015 vs 2020, (USD Million)
Figure 25 Chemical Synthesis: the Fastest-Growing Application in the Industrial Catalyst Market, 2014
Figure 26 Rapid Growth Markets are Emerging as New Strategic Locations
Figure 27 Industrial Catalyst Market in Asia-Pacific has the Highest Growth Potential
Figure 28 Asia-Pacific: Market Snapshot
Figure 29 North America: the Second-Fastest Growing Industrial Catalyst Market, 2015�2020
Figure 30 U.K.: the Fastest-Growing Market in Europe
Figure 31 RoW is Projected to Witness High Growth, 2015-2020
Figure 32 Companies Primarily Adopted Organic Growth Strategies
Figure 33 Battle for Market Share: Expansion Was the Key Strategy, 2010�2015
Figure 34 Regional Revenue Mix of Major Players
Figure 35 Albemarle Corporation: Company Snapshot
Figure 36 Albemarle Corporation: SWOT Analysis
Figure 37 BASF SE: Company Snapshot
Figure 38 BASF SE: SWOT Analysis
Figure 39 Exxon Mobil Chemical Corporation: Company Snapshot
Figure 40 Exxon Mobil Chemical Corporation: SWOT Analysis
Figure 41 Akzonobel N.V.: Company Snapshot
Figure 42 SWOT Analysis
Figure 43 Chevron Phillips Chemical Company: Company Snapshot
Figure 44 Chevron Phillips Chemical Company: SWOT Analysis
Figure 45 Arkema SA: Company Snapshot
Figure 46 The DOW Chemical Company: Company Snapshot
Figure 47 Evonik Industries AG: Company Snapshot
Figure 48 Dupont: Company Snapshot
Figure 49 Clariant AG: Company Snapshot


Growth opportunities and latent adjacency in Industrial Catalyst Market