IoT in Chemical Industry Market by Technology Type (Enabling Technology and Operational Technology), Chemical Verticals (Mining & Metals, Food & Beverages, Chemicals, Pharmaceuticals, Paper & Pulp), Region - Global Forecast to 2024


Updated on : February 15, 2023
IoT in Chemical Industry Market Overview
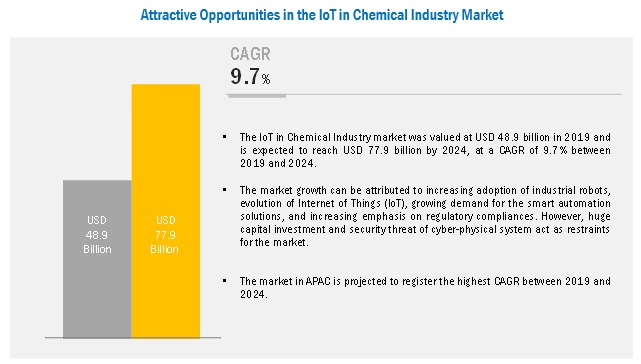
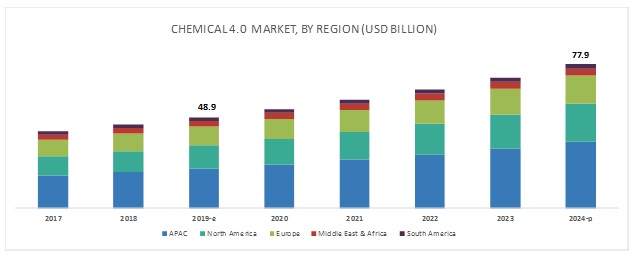
IoT in Chemical Industry Market was valued at USD 48.9 billion in 2019 and is projected to reach USD 77.9 billion by 2024, growing at a cagr 9.7% from 2019 to 2024. The market is driven by the increasing adoption of industrial robots, the evolution of the Internet of Things (IoT), the growing demand for the smart automation solutions, and increasing emphasis on regulatory compliances. APAC is the key market for IoT in Chemical Industry, globally, followed by North America and Europe.
Enabling technology is expected to lead the IoT in Chemical Industry market during the forecast period.
On the basis of type, the IoT in Chemical Industry market has been segmented into enabling technology and operational technology. The enabling technology segment is estimated to lead the IoT in Chemicals Industry market in terms of value. The growing concern towards the reduction of risk associated with chemical and metal industries, rising environmental concerns due to chemical release from the plants, and rising emphasis on circular economy are driving the demand for digital transformation, which is driving the IoT in Chemical Industry market.
The chemical verticals segment is estimated to witness the highest growth rate, between 2019 and 2024
The chemical verticals segment is estimated to witness the highest growth rate, in terms of value, between 2019 and 2024. This is owing to the increase in chemical production across various regions and rise in demand for specialty chemicals in advanced engineering processes. Growth of petrochemical and specialty chemical segments are directly influencing the growth of the chemical industry. There are almost 100 Greenfield refinery projects active around the world, which will positively impact the petrochemical industry. The growing need for automated processes along with the interconnected plant to optimize production process is further going to drive the IoT in Chemical Industry market growth.
APAC is expected to account for the largest share of the IoT in Chemical Industry market during the forecast period.
The APAC IoT in Chemical Industry market is estimated to witness significant growth during the forecast period. The growing chemical production in China, India, Indonesia, and Thailand, along with increasing urbanization and industrialization are driving the market in the region. In addition, due to the rise of mining and metals companies in the region will further drive the IoT in Chemicals Industry market.
Key IoT in Chemical Industry Market Players
The key market players profiled in the report include as Siemens AG (Germany), General Electric Co (US), ABB Ltd (Switzerland), Rockwell Automation, Inc. (US), Emerson Electric Co (US), Yokogawa Electric Corporation (Japan), Honeywell International Inc. (US), Mitsubishi Electric Corporation (Japan), Schneider Electric SE (Germany).
Siemens AG (Germany) is developing its automation business by launching new products and expanding in regions such as South America and Africa. In May 2019, Siemens and HP announced an expansion of their strategic alliance to help customers transform their businesses with industrial additive manufacturing (AM). Siemens, an innovation leader in automation and digitalization, and HP, the leader in industrial 3D printing, will expand their integrated additive manufacturing solution,
ncorporating new systems and software innovations, including overall product lifecycle management (PLM), this will help the company to expand its offering into new technologies as well markets. The company also launched a new comprehensive additive manufacturing solution that integrates entire additive manufacturing process from automated performance-driven design optimization to advanced 3D printing. This solution includes integrated design simulation, digital manufacturing, and data and process management software.
Emersion Electric Co. (US) is focused on new product launches. In July 2019, it has introduced two new Rosemount 628 Universal Gas Sensors to measure carbon monoxide and oxygen depletion in addition to the existing capability to monitor hydrogen sulfide. This will help the chemical industry to reduce risk related to gas leaks and help Emersion to grow its customer base.
IoT in Chemical Industry Market Report Scope
|
Report Metric |
Details |
|
Years considered for the study |
2017-2024 |
|
Base year considered |
2018 |
|
Forecast period |
2019-2024 |
|
Units considered |
Value (USD Billion) |
|
Segments covered |
By Technology Type, By Chemical Vertical, By Process, and By Region |
|
Regions covered |
APAC, North America, Europe, Middle East & Africa, and South America |
|
Companies profiled |
Siemens AG (Germany), General Electric Co (US), ABB Ltd (Switzerland), Rockwell Automation, Inc. (US), Emerson Electric Co (US), Yokogawa Electric Corporation (Japan), Honeywell International Inc. (US), Mitsubishi Electric Corporation (Japan), Schneider Electric SE. (Germany), Top 20 major players covered |
This report categorizes the global IoT in chemical industry market based on technology type, chemical verticals, process, and region.
On the basis of technology type, the IoT in chemical industry market has been segmented as follows:
-
Enabling Technology
- Industrial Robotics
- Machine Vision
- Internet of Things
- 3D Printing
- Big data
- Machine Condition Monitoring
- AR & VR
- Artificial Intelligence
- Digital Twin
-
Operational Technology
- Distributed Control System
- Programmable Logic Controller
- Manufacturing Execution System
- Enterprise Resource Planning
- Supervisory Control and Data Acquisition
- Plant Asset Management
- Human Machine Interface
- Product Lifecycle Management
On the basis of chemical verticals, the IoT in chemical industry market has been segmented as follows:
- Mining & Metals
- Food & Beverages
-
Chemicals
- Petrochemicals & Polymers
- Specialty Chemicals
- Fertilizers & Agrochemicals
- Others (others include consumer chemicals, industrial gases and water management, etc.)
- Pharmaceuticals
- Paper & Pulp
On the basis of region, the IoT in chemical industry has been segmented as follows:
- APAC
- North America
- Europe
- Middle East & Arica
- South America
Recent Developments in IoT in Chemical Industry Market
- In July 2019, Mitsubishi Electric Corporation has launched world’s first diagnostic technology based on the company's proprietary Maisart artificial intelligence (AI) technology that uses machine learning to analyze sensor data and then generate models.
- In April 2019, SE launched a new digital ecosystem to drive worldwide economies of scale for IoT solutions.
- May 2019, BASF and Emerson agreed on a multi-million dollar contract to modernize automation software and controllers at BASFs specialty chemical production facility in Lampertheim, Germany.
- In November 2018, Rockwell automation launched a new AI Module from Rockwell Automation Models
Key Questions Addressed by the Report
- What are the major developments impacting the market?
- Where will all the developments take the industry in the mid to long term?
- What are the upcoming product types of IoT in Chemical Industry?
- What are the emerging technologies for IoT in Chemical Industry?
- What are the major factors impacting market growth during the forecast period?
Frequently Asked Questions (FAQ):
How big is the IoT in chemical industry market industry?
The IoT in Chemical Industry market is projected to reach USD 79.9 billion by 2024, at a CAGR of 9.7% from USD 48.9 billion in 2019.
Who leading market players in IoT in chemical industry industry?
The key IoT in Chemical market players profiled in the report include Siemens AG (Germany), General Electric Co (US), ABB Ltd (Switzerland), Rockwell Automation, Inc. (US), Emerson Electric Co (US), Yokogawa Electric Corporation (Japan), Honeywell International Inc. (US), Mitsubishi Electric Corporation (Japan), Schneider Electric SE (Germany).
To speak to our analyst for a discussion on the above findings, click Speak to Analyst
 Exclusive indicates content/data unique to MarketsandMarkets and not available with any competitors.
Table of Contents
1 Introduction (Page No. - 18)
1.1 Objectives of the Study
1.2 Market Definition
1.3 Scope of the Study
1.3.1 Markets Covered
1.3.2 Years Considered for the Study
1.4 Currency
1.5 Limitations
1.6 Stakeholders
2 Research Methodology (Page No. - 23)
2.1 Research Data
2.1.1 Primary and Secondary Research
2.2 Market Size Estimation
2.2.1 Bottom-Up Approach
2.2.2 Top-Down Approach
2.3 Secondary Data
2.3.1.1 Key Data From Secondary Sources
2.4 Primary Data
2.4.1.1 Key Data From Primary Sources
2.4.1.2 Breakdown of Primary Interviews
2.4.1.3 Key Industry Insights
3 Executive Summary (Page No. - 30)
4 Premium Insights (Page No. - 34)
4.1 Attractive Growth Opportunities in the Chemical 4.0 Market
4.2 Chemical 4.0 Market, By Region (2019–2024)
4.3 APAC: Chemical 4.0 Market, By Enabling Technology and Country
4.5 Chemical 4.0 Market, By Operational Technology
5 Market Overview (Page No. - 37)
5.1 Introduction
5.1.1 Market Evolution
5.1.2 Elements of Chemical 4.0
5.1.2.1 Cyber Physical Systems
5.1.2.2 Industrial Internet of Things
5.1.2.3 Cloud Computing
5.1.2.4 Cognitive Computing
5.1.2.5 Data
5.1.3 Essentials of Chemical 4.0
5.1.3.1 Technical Requirements
5.1.3.1.1 Connectivity
5.1.3.1.2 Sensor Technology
5.1.3.1.3 Automation
5.1.3.1.4 Data Analytics
5.1.3.2 Organizational Requirements
5.1.3.2.1 Digitization Strategy
5.1.3.2.2 Workforce Optimization
5.1.3.2.3 Change Management
5.1.3.2.4 Cross-Industry Collaborations
5.2 Market Dynamics
5.2.1 Drivers
5.2.1.1 Increased Emphasis on Efficiency and Optimization
5.2.1.2 Increasing Adoption of Industrial Robots
5.2.1.3 Increasing Demand for Industry-Specific Solutions to Drive the Growth of the Market for IoT in Manufacturing
5.2.1.4 Increased Emphasis on Regulatory Compliances
5.2.1.5 Growth of the Semiconductor Industry and Other Supporting Industries
5.2.1.6 5g Communication
5.2.1.7 Circular Economy
5.2.2 Restraints
5.2.2.1 High Capital Investment Required for Transformation
5.2.2.2 Low Adoption Rate of Technologies
5.2.3 Opportunities
5.2.3.1 Industrial Growth in Emerging Economies
5.2.3.2 Enterprise-Wide Integration Leading to Enhanced Efficiency
5.2.3.3 High Emphasis on Digitization By Governments Globally
5.2.3.4 Advancement in IoT, Cognitive Computing, and Additive Manufacturing
5.2.3.5 Real-Time Data Generation and Data-Driven Process
5.2.3.6 Better Working Conditions, Superior Sustainability, Increased Energy-Efficiency, and Environmentally Sustainable Production and Systems
5.2.3.7 Food Safety, Spoilage, and Contamination
5.2.4 Challenges
5.2.4.1 Threats to Data Security and Other Cybersecurity Risks
5.2.4.2 Skill Gap
5.2.4.3 Lack of Infrastructure
5.2.4.4 Challenges in Information Technology and Operational Technology Convergence
5.2.4.5 Low Adoption Rate of Industry 4.0 Infrastructure in Small- and Medium-Sized Industries
5.2.4.6 Employee Pushback and Change Management
5.2.4.7 Transparency, Ethics, and Regulatory Compliances
6 Chemical 4.0 Market, By Type (Page No. - 54)
6.1 Introduction
6.2 Operational Technology
6.3 Distributed Control System (DCS)
6.3.1 DCS Provide Safe Execution and Control of Critical Process, Which are Not Possible to Control Manually Due the Risks Involved
6.4 Programmable Logic Controller (PLC)
6.4.1 Increasing Number of Factories are Generating Demand for Micro and Nano Plcs
6.5 Manufacturing Execution System (MES)
6.5.1 High Rate of Adoption of Mes is Due to Its Increasing Benefits in Process and Discrete Industries
6.6 Enterprise Resource Planning (ERP)
6.6.1 Ability to Integrate All the Critical Business Information Across an Organization is Boosting the Adoption of Erp Solutions in Smart Factories
6.7 Supervisory Control and Data Acquisition (SCADA)
6.7.1 Shift Toward Development of Scada App for Smartphones and Tablets is Likely to Encourage Chemical 4.0 Market Growth
6.8 Plant Asset Management (PAM)
6.8.1 Increasing Demand for Software Solutions Capable of Determining Failures in Advance is Favoring the Market for Pam
6.9 Human Machine Interface (HMI)
6.9.1 Evolution of Industrial Internet of Things ( IIoT) and the Growing Demand of Smart Automation Solutions are Driving the Market
6.10 Product Lifecycle Management (PLM)
6.10.1 Rising Demand for Efficiency and Productivity in Manufacturing Plants Across the Globe is Promising for the Market
6.11 Enabling Technology
6.12 Industrial Robotics
6.12.1 Traditional Robots
6.12.1.1 Cartesian Robots
6.12.1.1.1 Cartesian Robots Help With A High Degree of Mechanical Rigidity, Accuracy, and Repeatability
6.12.1.2 Scara Robots
6.12.1.2.1 Scara Robots Provide Higher Flexible Reach
6.12.1.3 Articulated Robots
6.12.1.3.1 These Robots Cover A Larger Work Envelope
6.12.1.4 Other Robots
6.12.2 Collaborative Robots
6.12.2.1 The Robotics Industry Players are Focusing on Designing Collaborative Robots as Per the Requirements of Smart Manufacturing Facilities
6.13 Machine Vision
6.13.1 Machine Vision Will Be Able to Reduce the Risk of Humans to Get Exposed to Hazardous and Toxic Conditions in Chemical Industries
6.14 Internet of Things (IoT)
6.14.1 IoT is Gaining Traction With Its Ability to Enhance Product Knowledge and Production Efficiency
6.15 3D Printing
6.15.1 The 3D Printing Market is Experiencing Growth With Strong R&D Regarding New Print Materials and Technologies
6.16 Big Data
6.16.1.The APAC Region Holds Immense Potential for the Growth of the Big Data Market
6.17 Machine Condition Monitoring
6.17.1 The Technology is Helpful in the Reduction of Maintenance Costs By Optimizing Machine Performance
6.18 Augmented Reality (AR) & Virtual Reality (VR)
6.18.1 The Implementation of These Technologies is Increasing in Various Industries, Including Chemical
6.19 Artificial Intelligence (AI)
6.19.1 The Major Factor Contributing to the Growth of the Market in the Ai Segment is the Ability of the Technology to Reduce Human Errors
6.20 Digital Twin
6.20.1 APAC is the Fastest-Growing Market in This Segment
7 Chemical 4.0 Market, By Industry Vertical (Page No. - 85)
7.1 Shift in Revenue Streams Due to Megatrends in Chemical Industry
7.2 Introduction
7.3 Metals & Mining
7.3.1 Rising Demand for Preventive Maintenance is Encouraging the Adoption of Industry 4.0 Solutions in the Mining Industry
7.4 Food & Beverage
7.4.1 The Implementation of Automation Technologies is Growing in This Industry
7.5 Chemical
7.5.1 Petrochemicals & Polymers
7.5.1.1 The Growth of the Petrochemicals & Polymers Segment is Opening Up Opportunities for the Adoption of Industry 4.0 Solutions
7.5.2 Specialty Chemicals
7.5.2.1 Data Analytics Have Immense Scope in This Segment of the Chemical Industry
7.5.3 Fertilizers & Agrochemicals
7.5.3.1 The Growing Demand for Organic Chemicals is Expected to Drive the Market
7.5.4 Others
7.6 Pharmaceutical
7.6.1 Increasing Demand for Industrial Automation to Ensure Product Standard is Driving Digital Transformation in This Industry
7.7 Pulp & Paper
7.7.1 The Ongoing Digitization of the Paper Manufacturing Process is Expected to Drive Chemical 4.0 Adoption in the Industry
7.8 Used Cases
8 Chemical 4.0 Market, By Process (Page No. - 101)
8.1 Introduction
8.2 Research & Development (R&D)
8.2.1 Reduced Product Development Time
8.3 Manufacturing
8.3.1 Leveraging Technology to Improve Production Process
8.4 Procurement
8.4.1 Inventory Management Complements Procurement Process
8.5 Packaging
8.5.1 Achieving Sustainability Through Automation and Technology
8.6 Supply Chain Management and Logistics
8.6.1 Faster and Flexible Distribution
8.6.2 Maintaining A Large Amount of Data
8.6.3 Automation as A Solution
8.6.4 Warehousing for Profit
9 Chemical 4.0 Market, By Region (Page No. - 107)
9.1.1 Introduction
9.1.2 APAC
9.1.2.1 China
9.1.2.1.1 The Country is Experiencing the Fastest Rate of Chemical 4.0 Adoption
9.1.2.2 India
9.1.2.2.1 The Country has Good Growth Opportunities for the Market in the Future
9.1.2.3 Japan
9.1.2.3.1 The Government is Working Toward the Automation of All Manufacturing Processes
9.1.2.4 South Korea
9.1.2.4.1 The Country is Witnessing A Digital Revolution in Its Industrial Manufacturing Sector
9.1.2.5 Rest of APAC
9.1.3 Europe
9.1.3.1 Germany
9.1.3.1.1 Germany is at the Forefront When It Comes to the Implementation of Chemical 4.0 Solutions
9.1.3.2 Italy
9.1.3.2.1 Italian Manufacturers are Emphasizing Chemical 4.0 to Enhance Their Productivity
9.1.3.3 France
9.1.3.3.1 The Opportunities for the Adoption of Chemical 4.0 is Promising in the Country
9.1.3.4 UK
9.1.3.4.1 The Implementation of Chemical 4.0 Solutions is Increasing in the Country’s Automotive Industry
9.1.3.5 Rest of Europe
9.1.4 North America
9.1.4.1 US
9.1.4.1.1 The Automation of Manufacturing Processes is Taking Place to Improve Operational Efficiency
9.1.4.2 Canada
9.1.4.2.1 The Market is Growing With Companies Investing in Cutting-Edge Technologies
9.1.4.3 Mexico
9.1.4.3.1 The Recent Structural Reforms in Mexico are Favorable for the Growth of the Market
9.1.5 Middle East & Africa
9.1.5.1 Turkey
9.1.5.1.1 The Government is Focusing on the Adoption of Industry 4.0
9.1.5.2 Saudi Arabia
9.1.5.2.1 The Growth of the Chemical and Oil & Gas Industries in the Country is Expected to Impact the Market Positively
9.1.5.3 Rest of Middle East & Africa
9.1.6 South America
9.1.6.1 Brazil
9.1.6.1.1 Apart From Chemical, the Oil & Gas Industry is Expected to Influence the Market Positively
9.1.6.2 Argentina
9.1.6.2.1 Argentina has the Second-Largest Oil Reserves After the US
9.1.6.3 Rest of South America
10 Competitive Landscape (Page No. - 134)
11 Company Profiles (Page No. - 144)
11.1 Siemens AG
11.1.1 Business Overview
11.1.2 Products Offered
11.1.3 Recent Developments
11.1.4 Winning Imperatives
11.1.5 Current Focus and Strategies
11.1.6 Threat From Competition
11.1.7 Siemens AG’s Right to Win
11.2 General Electric Co.
11.2.1 Business Overview
11.2.2 Products Offered
11.2.3 Recent Developments
11.2.4 Winning Imperatives
11.2.5 Current Focus and Strategies
11.2.6 Threat From Competition
11.2.7 Ge Electric’s Right to Win
11.3 ABB Ltd.
11.3.1 Business Overview
11.3.2 Products Offered
11.3.3 Recent Developments
11.3.4 Winning Imperatives
11.3.5 Current Focus and Strategies
11.3.6 Threat From Competition
11.3.7 ABB’s Right to Win
11.4 Rockwell Automation, Inc.
11.4.1 Business Overview
11.4.2 Products Offered
11.4.3 Recent Developments
11.4.4 Winning Imperatives
11.4.5 Current Focus and Strategies
11.4.6 Threat From Competition
11.4.7 Rockwell Automation’s Right to Win
11.5 Emerson Electric Co.
11.5.1 Business Overview
11.5.2 Products Offered
11.5.3 Recent Developments
11.5.4 Winning Imperatives
11.5.5 Current Focus and Strategies
11.5.6 Threat From Competition
11.5.7 Emersion Electric’s Right to Win
11.6 Yokogawa Electric Corporation
11.6.1 Business Overview
11.6.2 Products Offered
11.6.3 Recent Developments
11.6.4 Winning Imperatives
11.6.5 Current Focus and Strategies
11.6.6 Threat From Competition
11.6.7 Yokogawa’s Right to Win
11.7 Honeywell International Inc.
11.7.1 Business Overview
11.7.2 Products Offered
11.7.3 Recent Developments
11.7.4 Winning Imperatives
11.7.5 Current Focus and Strategies
11.7.6 Threat From Competition
11.7.7 Honeywell International’s Right to Win
11.8 Mitsubishi Electric Corporation
11.8.1 Business Overview
11.8.2 Products Offered
11.8.3 Recent Developments
11.8.4 Winning Imperatives
11.8.5 Current Focus and Strategies
11.8.6 Threat From Competition
11.8.7 Mitsubishi International’s Right to Win
11.9 Schneider Electric SE
11.9.1 Business Overview
11.9.2 Products Offered
11.9.3 Recent Developments
11.9.4 Winning Imperatives
11.9.5 Current Focus and Strategies
11.9.6 Threat From Competition
11.9.7 Schneider Electric’s Right to Win
11.10 Fanuc Corporation
11.10.1 Business Overview
11.10.2 Products Offered
11.10.3 Recent Developments
11.10.4 Winning Imperatives
11.10.5 Current Focus and Strategies
11.10.6 Threat From Competition
11.10.7 Schneider Electric’s Right to Win
11.11 Fortive
11.11.1 Products Offered
11.12 International Business Machines Corporation
11.12.1 Business Overview
11.12.2 Products Offered
11.12.3 Recent Developments
11.13 Cisco Systems, Inc.
11.13.1 Business Overview
11.13.2 Products Offered
11.13.3 Recent Developments
11.14 Microsoft Corporation
11.14.1 Business Overview
11.14.2 Products Offered
11.14.3 Recent Developments
11.15 Stratasys Ltd.
11.15.1 Business Overview
11.15.2 Products Offered
11.15.3 Recent Developments
11.16 Hewlett Packard Enterprise Company
11.16.1 Business Overview
11.16.2 Products Offered
11.16.3 Recent Developments
11.17 Qualcomm Inc.
11.17.1 Business Overview
11.17.2 Products Offered
11.17.3 Recent Developments
11.18 Samsung Electronics Co. Ltd
11.18.1 Business Overview
11.18.2 Products Offered
11.18.3 Recent Developments
11.19 Texas Instruments Inc.
11.19.1 Business Overview
11.19.2 Products Offered
11.19.3 Recent Developments
11.20 Atos SE
11.20.1 Business Overview
11.20.2 Products Offered
11.20.3 Recent Developments
11.21 3D Systems Corporation
11.21.1 Business Overview
11.21.2 Products Offered
11.21.3 Recent Developments
11.22 Denso Corporation
11.22.1 Business Overview
11.22.2 Products Offered
11.23 Other Players
12 Appendix (Page No. - 209)
12.1 Insights of Industry Experts
12.2 Discussion Guide
12.3 Knowledge Store: Marketsandmarkets’ Subscription Portal
12.4 Available Customizations
12.5 Related Reports
List of Tables (69 Tables)
Table 1 Chemical 4.0 Market Size, By Type, 2017–2024 (Usd Billion)
Table 2 Chemical 4.0 Market Size, By Operational Technology, 2017–2024 (USD Billion)
Table 3 Operational Technology Market Size, By Region, 2017–2024 (USD Billion)
Table 4 DCS: Chemical 4.0 Market Size, By Region, 2017–2024 (USD Million)
Table 5 Plc: Chemical 4.0 Market Size, By Region, 2017–2024 (USD Million)
Table 6 Mes: Chemical 4.0 Market Size, By Region, 2017–2024 (USD Million)
Table 7 Erp: Chemical 4.0 Market Size, By Region, 2017–2024 (USD Million)
Table 8 Scada: Chemical 4.0 Market Size, By Region, 2017–2024 (USD Million)
Table 9 Pam: Chemical 4.0 Market Size, By Region, 2017–2024 (USD Million)
Table 10 Hmi: Chemical 4.0 Market Size, By Region, 2017–2024 (USD Million)
Table 11 Plm: Chemical 4.0 Market Size, By Region, 2017–2024 (USD Million)
Table 12 Chemical 4.0 Market Size, By Enabling Technology, 2017–2024 (USD Billion)
Table 1 Enabling Technology Market Size, By Region, 2017–2024 (USD Billion)
Table 2 Industrial Robotics Market Size, By Type, 2017–2024 (USD Billion)
Table 3 Industrial Robotics Market Size, By Component, 2017–2024 (USD Billion)
Table 4 Industrial Robotics Market Size, By Region, 2017–2024 (USD Billion)
Table 5 Machine Vision Market Size, By Region, 2017–2024 (USD Million)
Table 6 Internet of Things Market Size, By Region, 2017–2024 (USD Million)
Table 7 Internet of Things Market Size, By Offering, 2017–2024 (USD Billion)
Table 8 Hardware: Internet of Things Market Size, 2017–2024 (USD Million)
Table 9 Software: Internet of Things Market Size, 2017–2024 (USD Million)
Table 10 3D Printing Market Size, By Region, 2017–2024 (USD Million)
Table 11 3D Printing Market Size, By Offering, 2017–2024 (USD Billion)
Table 12 3D Printing Market Size, By Material, 2017–2024 (USD Million)
Table 13 3D Printing Market Size, By Service, 2017–2024 (USD Million)
Table 14 3D Printing Market Size, By Software, 2017–2024 (USD Million)
Table 15 3D Printing Market Size, By Technology, 2017–2024 (USD Million)
Table 16 Big Data Market Size, By Offering, 2017–2024 (USD Billion)
Table 17 Big Data Market Size, By Software, 2017–2024 (USD Million)
Table 18 Big Data Market Size, By Service, 2017–2024 (USD Million)
Table 19 Big Data Market Size, By Region, 2017–2024 (USD Million)
Table 20 Machine Condition Monitoring Market Size, By Region, 2017–2024 (USD Million)
Table 21 Ar & Vr Market Size, By Region, 2017–2024 (USD Million)
Table 22 Ar & Vr Market Size, By Offering, 2017–2024 (USD Million)
Table 23 Ar & Vr Market Size, By Hardware, 2017–2024 (USD Million)
Table 24 Artificial Intelligence Market Size, By Offering, 2017–2024 (USD Million)
Table 25 Ai: Chemical 4.0 Market Size, By Region, 2017–2024 (USD Million)
Table 26 Digital Twin: Chemical 4.0 Market Size, By Region, 2017–2024 (USD Million)
Table 27 Chemical 4.0 Market Size, By Industry Verticals, 2017–2024 (USD Billion)
Table 28 Chemical 4.0 Market Size in Metals & Mining, By Region, 2017–2024 (USD Billion)
Table 29 Chemical 4.0 Market Size in Food & Beverage, By Region, 2017–2024 (USD Billion)
Table 30 Investments From Downstream Companies
Table 31 Chemical 4.0 Market Size in Different Chemical Industry Verticals, By Region, 2017–2024 (USD Billion)
Table 32 Chemical 4.0 Market Size, By Different Chemical Industry Verticals, 2017–2024 (USD Billion)
Table 33 Petrochemicals & Polymers: Chemical 4.0 Market Size in Different Chemical Industry Verticals, By Region, 2017–2024 (USD Billion)
Table 34 Specialty Chemicals: Chemical 4.0 Market Size in Different Chemical Industry Verticals, By Region, 2017–2024 (USD Billion)
Table 35 Fertilizers & Agrochemicals: Chemical 4.0 Market Size in Different Chemical Industry Verticals, By Region, 2017–2024 (USD Billion)
Table 36 Others: Chemical 4.0 Market Size in Different Chemical Industry Verticals, By Region, 2017–2024 (USD Billion)
Table 37 Chemicals 4.0 Market Size in Pharmaceutical, By Region, 2017–2024 (USD Billion)
Table 38 Chemical 4.0 Market Size in Pulp & Paper, By Region, 2017–2024 (USD Billion)
Table 39 Chemicals 4.0 Market Size, By Region, 2017–2024 (USD Billion)
Table 40 APAC: Chemical 4.0 Market Size, By Country, 2017–2024 (USD Billion)
Table 41 APAC: Chemicals 4.0 Market Size, By Type, 2017–2024 (USD Billion)
Table 42 APAC: Chemical 4.0 Market Size, By Operational Technology, 2017–2024 (USD Billion)
Table 43 APAC: Chemicals 4.0 Market, By Enabling Technology, 2017–2024 (USD Billion)
Table 44 APAC: Chemical 4.0 Market Size, By Industry Vertical, 2017–2024 (USD Billion)
Table 45 APAC: Chemicals 4.0 Market Size, By Chemical Industry Verticals, 2017–2024 (USD Billion)
Table 46 Europe: Chemical 4.0 Market Size, By Country, 2017–2024 (USD Billion)
Table 47 Europe: Chemicals 4.0 Market Size, By Type, 2017–2024 (USD Billion)
Table 48 Europe: Chemical 4.0 Market, By Enabling Technology, 2017–2024 (USD Million)
Table 49 Europe: Chemicals 4.0 Market Size, By Operational Technology, 2017–2024 (USD Million)
Table 50 Europe: Chemical 4.0 Market Size, By Industry Verticals, 2017–2024 (USD Billion)
Table 51 Europe: Chemicals 4.0 Market Size, By Chemical Industry Verticals, 2017–2024 (USD Billion)
Table 52 North America: Chemical 4.0 Market Size, By Country, 2017–2024 (USD Billion)
Table 53 North America: Chemicals 4.0 Market Size, By Type, 2017–2024 (USD Billion)
Table 54 North America: Chemical 4.0 Market, By Enabling Technology, 2017–2024 (USD Billion)
Table 55 North America: Chemicals 4.0 Market Size, By Operational Technology, 2017–2024 (USD Billion)
Table 56 North America: Chemical 4.0 Market Size, By Industry Verticals, 2017–2024 (USD Billion)
Table 57 North America: Chemicals 4.0 Market Size, By Chemical Industry Verticals, 2017–2024 (USD Billion)
Table 58 Middle East & Africa: Chemical 4.0 Market Size, By Country, 2017–2024 (USD Billion)
Table 59 Middle East & Africa: Chemicals 4.0 Market Size, By Type, 2017–2024 (USD Billion)
Table 60 Middle East & Africa: Chemical 4.0 Market, By Enabling Technology, 2017–2024 (USD Million)
Table 61 Middle East & Africa: Chemicals 4.0 Market Size, By Operational Technology, 2017–2024 (USD Million)
Table 62 Middle East & Africa: 4.0 Market Size, By Industry Verticals, 2017–2024 (USD Million)
Table 63 Middle East & Africa: Chemical 4.0 Market Size, By Chemical Industry Verticals, 2017–2024 (USD Million)
Table 64 South America: Chemical 4.0 Market Size, By Country, 2017–2024 (USD Billion)
Table 65 South America: Chemicals 4.0 Market Size, By Type, 2017–2024 (USD Billion)
Table 66 South America: Chemical 4.0, By Enabling Technology, 2017–2024 (USD Million)
Table 67 South America: Chemicals 4.0 Market Size, By Operational Technology, 2017–2024 (USD Million)
Table 68 South America 4.0 Market Size, By Industry Verticals, 2017–2024 (USD Million)
Table 69 South America: Chemical 4.0 Market Size, By Chemical Industry Verticals, 2017–2024 (USD Million)
List of Figures (61 Figures)
Figure 1 Market Segmentation
Figure 2 Global Market Calculation
Figure 3 Market Calculation By Chemical Verticals
Figure 4 Chemical 4.0, Forecast (2024)
Figure 5 Chemicals 4.0 Market: Bottom-Up Approach
Figure 6 Chemical 4.0 Market: Top-Down Approach
Figure 7 Chemicals 4.0 Market, By Technology, 2018 (USD Billion)
Figure 8 APAC to Be the Fastest-Growing Region in the Chemical 4.0 Market
Figure 9 Growing Demand for Smart Automation Solutions to Drive the Growth of the Chemical 4.0 Market During the Forecast Period
Figure 10 The Chemical 4.0 Market in APAC to Grow at the Highest Rate During the Forecast Period
Figure 11 Enabling Technology and China Accounted for the Largest Share in APAC Chemical 4.0 Market Share in 2018
Figure 12 China to Be the Fastest-Growing Chemical 4.0 Market
Figure 13 Distributed Control System Was the Largest Application in the Chemical 4.0 Market in 2018
Figure 14 Industrial Revolution Timeline
Figure 15 Enabling Technology to Register Higher CAGR
Figure 16 YC and YCC Shift
Figure 17 Chemical 4.0 Market, By Industry Verticals
Figure 18 Petrochemicals & Polymers to Be the Largest Segment of the Market
Figure 19 Refinery: Iocl-Emerson-Meeting Low Fuel Emission Standards (Bharat Stage Vi)
Figure 20 Polymerization: Denka-Emerson Cost Optimization By Real-Time Analysis
Figure 21 Petrochemicals & Polymers Used Cases
Figure 22 Specialty Chemicals, Lubricants, Coatings Used Cases
Figure 23 Value Chain
Figure 24 APAC to Be the Largest Chemical 4.0 Market
Figure 25 APAC: Chemical 4.0 Market Snapshot
Figure 26 Europe: Chemical 4.0 Market Snapshot
Figure 27 North America: Chemical 4.0 Market Snapshot
Figure 31 Siemens AG: Company Snapshot
Figure 32 Siemens AG: Winning Imperatives
Figure 33 General Electric Co.: Company Snapshot
Figure 34 GE Electric Co.: Winning Imperatives
Figure 35 ABB Ltd.: Company Snapshot
Figure 36 ABB Ltd.: Winning Imperatives
Figure 37 Rockwell Automation Inc.: Company Snapshot
Figure 38 Rockwell Automation: Winning Imperatives
Figure 39 Emerson Electric Co: Company Snapshot
Figure 40 Emersion Electric: Winning Imperatives
Figure 41 Yokogawa Electric Corporation: Company Snapshot
Figure 42 Yokogawa: Winning Imperatives
Figure 43 Honeywell International Inc.: Company Snapshot
Figure 44 Honeywell: Winning Imperatives
Figure 45 Mitsubishi Electric Corporation: Company Snapshot
Figure 46 Mitsubishi Electric Corporation : Winning Imperatives
Figure 47 Schneider Electric SE: Company Snapshot
Figure 48 Schneider Electric SE : Winning Imperatives
Figure 49 Fanuc Corporation : Company Snapshot
Figure 50 Fanuc Corporation : Winning Imperatives
Figure 51 Fortive: Company Snapshot
Figure 52 International Business Machines Corporation: Company Snapshot
Figure 53 Cisco Systems Inc.: Company Snapshot
Figure 54 Microsoft Corporation: Company Snapshot
Figure 55 Stratasys Ltd: Company Snapshot
Figure 56 Hewlett Packard Enterprise Company: Company Snapshot
Figure 57 Qualcomm Inc.: Company Snapshot
Figure 58 Samsung Electronics Co. Ltd: Company Snapshot
Figure 59 Texas Instruments Inc.: Company Snapshot
Figure 60 Atos SE: Company Snapshot
Figure 61 3D Systems Corporation: Company Snapshot
The study involved four major activities in estimating the market size for IoT in chemical industry. Exhaustive secondary research was done to collect information on the market, the peer market, and the parent market. The next step was to validate these findings, assumptions, and sizing with industry experts across the value chain through primary research. Both top-down and bottom-up approaches were employed to estimate the complete market size. Thereafter, the market breakdown and data triangulation procedures were used to estimate the market size of the segments and subsegments.
IoT in Chemical Industry Market Secondary Research
Secondary sources used in this study included annual reports, press releases, and investor presentations of companies; white papers; certified publications; articles from recognized authors; and gold standard & silver standard websites, such as Factiva, ICIS, Bloomberg, EPA (Environmental Protection Agency), Gen-Z consortium, The World Economic Forum, GENIVI alliance, The European Chemical Industry Council, Green Electronic Counsel, United Nations Industrial Development Organization. The findings of this study were verified through primary research by conducting extensive interviews with key officials, such as CEOs, VPs, directors, and other executives.
IoT in Chemical Industry Market Primary Research
The IoT in chemical industry market comprises several stakeholders, such as technology suppliers and vendors, end-product manufacturers, and regulatory organizations in the supply chain. The demand side of this market is characterized by the development of the different chemical verticals such as pharmaceutical, food & beverage, mining & metals, paper and pulp, and chemical industries such as petrochemical & polymers, agrochemical & fertilizers and specialty chemicals, and other industries such as industrial gases, and water management. The supply side is characterized by advancements in technology and diverse applications in various industries. Various primary sources from both the supply and demand sides of the market were interviewed to obtain qualitative and quantitative information.
The breakdown of profiles of the primary interviewees is illustrated in the figure below:
To know about the assumptions considered for the study, download the pdf brochure
IoT in Chemical Industry Market Size Estimation
Both top-down and bottom-up approaches were used to estimate and validate the total size of the IoT in chemical industry market. These methods were also used extensively to estimate the size of various subsegments in the market. The research methodology used to estimate the market size includes the following:
The key players in the industry were identified through extensive secondary research.
- The industry’s supply chain and market size, in terms of value, were determined through primary and secondary research processes.
- All percentage shares, splits, and breakdowns were determined using secondary sources and verified through primary sources.
IoT in Chemical Industry Market Data Triangulation
After arriving at the overall market size-using the market size estimation processes as explained above-the market was split into several segments and subsegments. In order to complete the overall market engineering process and arrive at the exact statistics of each market segment and subsegment, the data triangulation and market breakdown procedures were employed, wherever applicable. The data was triangulated by studying various factors and trends from both the demand and supply sides.
IoT in Chemical Industry Market Report Objectives
- To define, describe, and forecast the IoT in chemical industry market on the basis of operational technology, enabling technology, process, and region
- To forecast the market size in terms of value, with respect to 5 main regions. APAC, Europe, North America, South America, and the Middle East & Africa
- To provide detailed information regarding the factors influencing the growth of the IoT in chemical industry market (drivers, restraints, opportunities, and challenges).
- Strategically analyze the micromarkets with respect to individual growth trends, future prospects, and contribution to the total market.
- To identify the opportunities in the market for various stakeholders by identifying high-growth segments in the IoT in chemical industry market.
- To strategical identify the key players and comprehensively analyze their market share and core competencies and provide a detailed competitive landscape for the market leaders.
- To analyze the various development strategies such as joint-venture, merger & acquisitions, new product launch & development, expansions, and research & development implemented by the key market players in the IoT in chemical industry market.
- To strategically profile key players and comprehensively analyze their core competencies


Growth opportunities and latent adjacency in IoT in Chemical Industry Market