Laboratory Balances and Scales Market by Product (Balances (Analytical, Precision, Micro, Portable, Moisture), Scales (Bench, Counting, Compact)), End User (Pharmaceutical, Biotechnology, Chemical, Beverage, Petroleum, Academia) - Global Forecasts to 2023


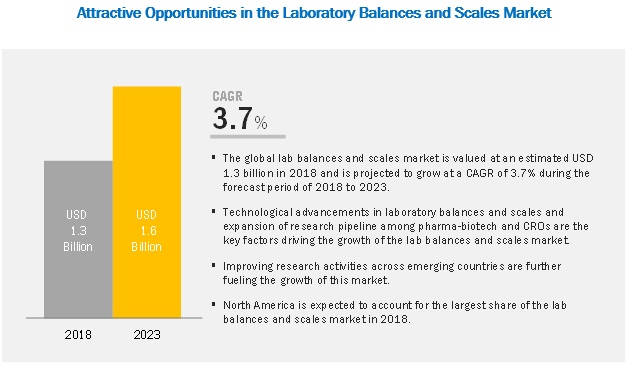
The Laboratory Balances and Scales Market is projected to reach USD 1.6 billion by 2023, growing at a CAGR of 3.7%. The study involved four major activities to estimate the current market size for lab balances and scales. Exhaustive secondary research was done to collect information on the market and its different sub-segments. The next step was to validate these findings, assumptions, and sizing with industry experts across the value chain through primary research. Top-down and bottom-up approaches were employed to estimate the complete market size. Thereafter market breakdown and data triangulation was used to estimate the market size of segments and sub-segments.
Secondary Research
In the secondary research process, various secondary sources such as annual reports, SEC filings, press releases & investor presentations of companies, white papers, certified publications, articles by recognized authors, gold standard & silver standard websites, regulatory bodies, and databases (such as D&B Hoovers, Bloomberg Business, and Factiva) were referred to identify and collect information for this study.
Primary Research
The lab balances and scales market comprises several stakeholders such as laboratory balances and scales platform manufacturing companies, product sales and distribution companies, pharmaceutical, cosmeceutical, and biotechnology products testing laboratories, chemical and Material Testing laboratories, food and beverages testing laboratories, and clinical research organizations (CROs). The demand side of this market is characterized by the expansion of research pipeline among Pharma-Biotech & CROs and regulatory framework for product safety in bio-pharma technology industry. The supply side is characterized by advancements in technology. Various primary sources from both the supply and demand sides of the market were interviewed to obtain qualitative and quantitative information.
Following is the breakdown of primary respondents:
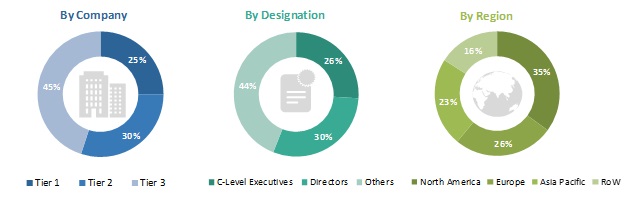
To know about the assumptions considered for the study, download the pdf brochure
Market Size Estimation
Top-down and bottom-up approaches were used to estimate and validate the total size of the lab balances and scales market. These methods were also used extensively to estimate the size of various sub-segments in the market. The research methodology used to estimate the market size includes the following:
- The key players in the industry and markets have been identified through extensive secondary research
- The industry’s supply chain and market size, in terms of value, have been determined through primary and secondary research processes
- All percentage shares, splits, and breakdowns have been determined using secondary sources and verified through primary sources
Data Triangulation
After arriving at the overall market size using the market size estimation processes as explained above the market was split into several segments and sub-segments. In order to complete the overall market engineering process and arrive at the exact statistics of each market segment and sub-segment, the data triangulation and market breakdown procedures were employed, wherever applicable. The data was triangulated by studying various factors and trends from both the demand and supply sides in the lab balances and scales industry.
Report Objectives
- To define, describe, and forecast the global laboratory balances and scales market by product, end user, and region
- To provide detailed information about the major factors influencing market growth (key drivers, restraints, opportunities, and industry-specific challenges)
- To strategically analyze micromarkets1 with respect to individual growth trends, prospects, and their contributions to the global market
- To analyze market opportunities for stakeholders and provide details of the competitive landscape for key global players
- To forecast market value of various segments and sub-segments with respect to four main regions, namely, North America (US and Canada), Europe [Germany, France, the UK, and Rest of Europe (RoE)], Asia Pacific [China, India, Japan, and Rest of Asia Pacific (RoAPAC)], and the Rest of the World (RoW)
- To profile the key global players active in the global laboratory balances and scales industry and comprehensively analyze their global revenue shares and core competencies2
- To track and analyze competitive market-specific developments such as product developments & commercialization, strategic mergers, market expansions, as well as agreements in the global market
Laboratory Balances and Scales Market Scope
|
Report Metric |
Details |
|
Market size available for years |
2016–2023 |
|
Base year considered |
2017 |
|
Forecast period |
2018–2023 |
|
Forecast units |
Value (USD) |
|
Segments covered |
Product, end user, and region |
|
Geographies covered |
North America (US & Canada), Europe (Germany, France, UK, and RoE), APAC (Japan, China, India, and RoAPAC), and the RoW |
|
Companies covered |
Major 10 players covered, including A&D Company, Ltd (Japan), Metler Toledo international, Inc. (US), Sartorius AG (Germany), Shimadzu Corporation (Japan), and PCE Instruments (UK). |
This research report categorizes the lab balances and scales market based on product, end user, and region.
By Product
- Lab Balances
- Micro & Ultra Micro Balances
- Top Loading/Precision Balances
- Analytical Balances
- Portable/Compact Balances
- Moisture Balances
- Other Balances (includes hanging pan balances, triple beam balances, trip balances, equal arm balances, pan balances, and spring balances, among others)
- Lab Scales
- Bench Scales
- Compact Scales
- Counting Scales
- Other Scales (includes pocket scales, micro scales, accurate scales, paper scales, and high-resolution tissue scales, among others)
By End User
- Pharmaceutical, Cosmeceutical, and Biotechnology Products Testing Laboratories
- Chemical and Material Testing laboratories
- Food and Beverages testing Laboratories
- Petroleum Product Testing Laboratories
- Research Laboratories and Academic Institutes
- Other End Users (include the textile laboratories, water testing laboratories, and regulatory authorities, among others)
By Region
-
North America
- US
- Canada
-
Europe
- Germany
- France
- UK
- RoE
-
Asia Pacific
- China
- Japan
- India
- RoAPAC
- Rest of the World
Available Customizations
With the given market data, MarketsandMarkets offers customizations as per the company’s specific needs. The following customization options are available for the global laboratory balances and scales report:
Product Analysis
- Product Matrix, which gives a detailed comparison of the product portfolios of the top five global players
Geographical Analysis
- Further breakdown of the Rest of Europe laboratory balances and scales industry into Poland, Italy, Spain, and other European countries (aggregated)
- Further breakdown of the RoW laboratory balances and scales industry into the Middle East, Latin America, and Africa
Company Information
- Detailed analysis and profiling of additional global players (Up to 5 OEMs)
Growth in the lab balances and scales market is primarily driven by factors such as technological advancements in laboratory balances and scales; expansion of research pipeline among pharma-biotech and CROs; increasingly stringent regulatory framework for product safety in biotechnology and pharmaceutical industries; and growing public emphasis on Implementation of stringent food safety guidelines.
By product, the lab balances segment is expected to grow at the highest rate during the forecast period
Laboratory balances are used to compare the mass of two different objects (such as solids, liquids, and tissues) those are used in laboratories. The growth of the lab balances segment is attributed to factors such as the greater regulatory compliance for product quality and increased research pipeline that replicate into higher lab balances usage.
By End User, pharmaceutical, cosmeceutical, and biotechnology product testing laboratories are expected to be the largest contributor to the lab balances and scales market
Pharmaceutical, cosmeceutical, and biotechnology products testing laboratories utilize lab balances and scales to determine the weight of biopharmaceutical substances for research & development activities and quality assurance. Factors driving the growth of the pharmaceutical, cosmeceutical, and biotechnology products testing laboratories segment include growing developmental pipeline of key manufacturers and expansion of research facilities by the product manufacturers & private organizations in the industry.
North America is expected to hold a significant share in the lab balances and scales market during the forecast period
The North America is one of the major revenue generating regions in the lab balances and scales market. North America and Canada are the major countries responsible for the dominant position of this regional market owing to factors such as presence of stringent regulatory guidelines and extensive regulatory compliance for product quality among target end user industries and the strong presence of major market players in the region. Furthermore, growing research pipeline among the biopharmaceutical companies and ongoing technological advancements in the field of lab balances and scales are also driving the growth of this regional market.
Key Market Players
A&D Company, Ltd (Japan), Metler Toledo international, Inc. (US), Sartorius AG (Germany), and Shimadzu Corporation (Japan) were the top players in the global laboratory balances and scales market. Other prominent players present in this market include PCE Instruments (UK), Kern & Sohn GmbH (Germany), RADWAG Balances and Scales (Poland), Adam Equipment Co. (UK), Avery Weigh-Tronix, LLC (UK), Bonso Electronics International, Inc. (China), Essae Group (India), Gram Precision S.L (Spain), Humboldt Scientific, Inc. (US), Scientech, Inc. (US), and Danaher Corporation (US), among others.
Mettler-Toledo International, Inc. (US) is one of the leading players operating in the lab balances and scales market. The company has manufacturing facilities across the US, Germany, the UK, Switzerland, and China and has a strong distribution network across more than 100 countries includes Canada, France, Switzerland, India, Japan, Malaysia, Australia, New Zealand, Vietnam, Singapore, Brazil, Mexico, Denmark, and Poland, among others.
The company offers a wide range of laboratory balances; those are used across various testing laboratories such as drug testing labs, food testing labs, beverages testing labs, and biotechnology labs, and petrochemical testing labs. The company mainly focuses on the development of technologically innovative products to further strengthen its position in the market. As a part of this organic growth strategy, the company launched XPR Micro and Ultra-Micro Balances in June 2016.
Recent Developments
- In June 2016, the company launched the XPR Micro and Ultra-Micro balances. This helped Mettler-Toledo to improve its position in the lab balances and scales market.
Frequently Asked Questions (FAQs):
What is the size of Laboratory Balances and Scales Market?
The Laboratory Balances and Scales Market is projected to reach USD 1.6 billion by 2023, growing at a CAGR of 3.7%.
What are the major growth factors of Laboratory Balances and Scales Market?
The study involved four major activities to estimate the current market size for lab balances and scales. Exhaustive secondary research was done to collect information on the market and its different sub-segments. The next step was to validate these findings, assumptions, and sizing with industry experts across the value chain through primary research. Top-down and bottom-up approaches were employed to estimate the complete market size. Thereafter market breakdown and data triangulation was used to estimate the market size of segments and sub-segments.
Who all are the prominent players of Laboratory Balances and Scales Market?
The major players operating in the laboratory balances and scales market are A&D Company, Ltd (Japan), Metler Toledo international, Inc. (US), Sartorius AG (Germany), Shimadzu Corporation (Japan), PCE Instruments (UK), Kern & Sohn GmbH (Germany), RADWAG Balances and Scales (Poland), Adam Equipment Co. (UK), Avery Weigh-Tronix, LLC (UK), Bonso Electronics International, Inc. (China), Essae Group (India), and Gram Precision S.L (Spain).
To speak to our analyst for a discussion on the above findings, click Speak to Analyst
 Exclusive indicates content/data unique to MarketsandMarkets and not available with any competitors.
Table of Contents
1 Introduction (Page No. - 16)
1.1 Objectives of the Study
1.2 Market Definition
1.3 Market Scope
1.3.1 Markets Covered
1.3.2 Years Considered for the Study
1.4 Currency Used for the Study
1.5 Major Market Stakeholders
2 Research Methodology (Page No. - 19)
2.1 Research Data
2.1.1 Secondary Data
2.1.2 Primary Data
2.2 Market Estimation Methodology
2.2.1 Usage Pattern-Based Market Estimation
2.2.2 Revenue Mapping-Based Market Estimation
2.2.3 Primary Research Validation
2.3 Data Triangulation
2.4 Research Assumptions
2.5 Research Limitations
3 Executive Summary (Page No. - 28)
4 Premium Insights (Page No. - 32)
4.1 Laboratory Balances and Scales: Market Overview
4.2 Laboratory Balances Market, By Type, 2018 vs 2023
4.3 Laboratory Scales Market, By Type, 2018 vs 2023
4.4 Geographic Analysis: Laboratory Balances and Scales Market, By End User (2018)
4.5 Market, By Country (2018–2023)
5 Market Overview (Page No. - 37)
5.1 Introduction
5.2 Market Dynamics
5.2.1 Drivers
5.2.1.1 Technological Advancements in Laboratory Balances and Scales
5.2.1.2 Expansion of the Research Pipeline of Pharma-Biotech Companies and Cros
5.2.1.3 Increasing Stringency of the Regulatory Framework for Product Safety Compliance in Pharma-Biotech Industries
5.2.1.4 Growing Public Emphasis on the Implementation of Stringent Food Safety Regulations
5.2.2 Restraints
5.2.2.1 Limited Replacement Rate Among End Users
5.2.3 Opportunities
5.2.3.1 Emerging Markets
6 Laboratory Balances and Scales Market, By Type (Page No. - 46)
6.1 Introduction
6.2 Laboratory Balances
6.2.1 Analytical Balances
6.2.1.1 Procedural Benefits Offered By Analytical Balances to Drive Market Growth
6.2.2 Top-Loading/Precision Balances
6.2.2.1 The Ability to Weigh Samples With A Relatively Larger Mass is A Key Advantage of Precision Balances
6.2.3 Micro & Ultra-Micro Balances
6.2.3.1 High-Speed Measurement, High Accuracy, and Easy Operations are Key Advantages of Micro and Ultra-Micro Balances
6.2.4 Moisture Balances
6.2.4.1 The Demand for Moisture Balances is Increasing Among Target End Users Due to Their High-Speed Measurement and High Accuracy
6.2.5 Portable/Compact Balances
6.2.5.1 Limited Ability of Portable Balances to Measure Heavy Samples Limits Their Adoption Among End Users
6.2.6 Other Balances
6.3 Laboratory Scales
6.3.1 Bench Scales
6.3.1.1 Quick Stabilization, High Accuracy, Ease of Handling, and Fast Measurement Time—Key Benefits of Bench Scales
6.3.2 Counting Scales
6.3.2.1 Increasing Adoption of Counting Scales Among Drug Testing, Food Testing, and Biotechnology Laboratories to Drive Market Growth
6.3.3 Compact Scales
6.3.3.1 High Accuracy, Easy Portability, Fewer Space Requirements, and Ease of Handling are Key Advantages of Compact Scales
6.3.4 Other Scales
7 Laboratory Balances and Scales Market, By End User (Page No. - 67)
7.1 Introduction
7.2 Pharmaceutical, Cosmeceutical, and Biotechnology Products Testing Laboratories
7.2.1 Growing Developmental Pipeline of Pharmaceutical and Biotechnology Manufacturers is A Key Driver
7.3 Chemical and Material Testing Laboratories
7.3.1 Demand for Lab Balances and Scales is Estimated to Rise With Increasing Production Output of Chemicals and Materials
7.4 Food and Beverage Testing Laboratories
7.4.1 Increasing Food Adulteration and Contamination has Resulted in Implementation of Stringent Food Safety Guidelines
7.5 Petroleum Product Testing Laboratories
7.5.1 Increasing Number of Research Activities Across Petroleum Industries is Driving Demand
7.6 Research Laboratories and Academic Institutes
7.6.1 Limited Budgets of Small & Mid-Sized Research Labs and Academic Institutes May Restrain Market Growth
7.7 Other End Users
8 Lab Balances and Scales Market, By Region (Page No. - 76)
8.1 Introduction
8.2 North America
8.2.1 US
8.2.1.1 The Strong Presence of Major Market Players in the US to Drive Market Growth
8.2.2 Canada
8.2.2.1 Growth in the Lab Balances and Scales Market in Canada is Driven By the Growing Availability of Novel Lab Balances and Scales
8.3 Europe
8.3.1 Germany
8.3.1.1 Growing Demand for Lab Balances and Scales is Supported By Increasing Number of Patent Renewals of Pharma Drugs
8.3.2 UK
8.3.2.1 Growth in This Market is Driven By the Rising Number of Research Activities to Validate the Therapeutic Efficacy and Safety of Drugs
8.3.3 France
8.3.3.1 Increasing Adoption of Lab Balances and Scales Among Research Experts in Various End-Use Industries is Driving Demand
8.3.4 Rest of Europe
8.4 Asia Pacific
8.4.1 Japan
8.4.1.1 High Market Entry Barriers and Pricing Pressure on Product Manufacturers to Limit Market Growth
8.4.2 China
8.4.2.1 Supportive Government Regulations for the Expansion and Modernization of Healthcare Facilities Will Drive Market Growth
8.4.3 India
8.4.3.1 Increasing Public Focus on Food Safety & Drug Quality Regulations to Drive Market Growth in India
8.4.4 Rest of Asia Pacific
8.5 Rest of the World
9 Competitive Landscape (Page No. - 116)
9.1 Overview
9.2 Global Market Share Analysis (2017)
9.3 Competitive Scenario (2014-2018)
9.3.1 Key Product Launches (2014-2018)
9.3.2 Key Expansions (2014-2018)
10 Company Profiles (Page No. - 119)
(Business Overview, Products Offered, Recent Developments (2014-2018), MnM View)*
10.1 Introduction
10.2 A&D Company, Ltd.
10.3 Adam Equipment, Ltd.
10.4 Avery Weigh-Tronix LLC
10.5 Bonso Electronics International, Inc.
10.6 Danaher Corporation
10.7 Essae Group
10.8 Gram Precision
10.9 Humboldt Mfg. Co.
10.10 Kern & Sohn GmbH
10.11 Mettler Toledo International, Inc.
10.12 Pce Holding GmbH & Co. Kg
10.13 Radwag Balances and Scales
10.14 Sartorius AG
10.15 Scientech, Inc.
10.16 Shimadzu Corporation
*Business Overview, Products Offered, Recent Developments (2014-2018), MnM View Might Not Be Captured in Case of Unlisted Companies.
11 Appendix (Page No. - 150)
11.1 Discussion Guide
11.2 Knowledge Store: Marketsandmarkets’ Subscription Portal
11.3 Available Customizations
11.4 Related Reports
11.5 Author Details
List of Tables (91 Tables)
Table 1 Laboratory Balances and Scales Market, By Type, 2016–2023 (USD Million)
Table 2 Laboratory Balances Market, By Type, 2016–2023 (USD Million)
Table 3 Laboratory Balances Market, By Region, 2016–2023 (USD Million)
Table 4 Laboratory Balances Market, By End User, 2016–2023 (USD Million)
Table 5 Analytical Balances Market, By Region, 2016–2023 (USD Million)
Table 6 Analytical Balances Market, By End User, 2016–2023 (USD Million)
Table 7 Top-Loading Balances/Precision Balances Market, By Region, 2016–2023 (USD Million)
Table 8 Top-Loading Balances/Precision Balances Market, By End User, 2016–2023 (USD Million)
Table 9 Micro and Ultra-Micro Balances Market, By Region, 2016–2023 (USD Million)
Table 10 Micro and Ultra-Micro Balances Market, By End User, 2016–2023 (USD Million)
Table 11 Moisture Balances Market, By Region, 2016–2023 (USD Million)
Table 12 Moisture Balances Market, By End User, 2016–2023 (USD Million)
Table 13 Portable/Compact Balances Market, By Region, 2016–2023 (USD Million)
Table 14 Portable/Compact Balances Market, By End User, 2016–2023 (USD Million)
Table 15 Other Laboratory Balances Market, By Region, 2016–2023 (USD Million)
Table 16 Other Laboratory Balances Market, By End User, 2016–2023 (USD Million)
Table 17 Laboratory Scales Market, By Type, 2016–2023 (USD Million)
Table 18 Laboratory Scales Market, By Region, 2016–2023 (USD Million)
Table 19 Laboratory Scales Market, By End User, 2016–2023 (USD Million)
Table 20 Bench Scales Market, By Region, 2016–2023 (USD Million)
Table 21 Bench Scales Market, By End User, 2016–2023 (USD Million)
Table 22 Counting Scales Market, By Region, 2016–2023 (USD Million)
Table 23 Counting Scales Market, By End User, 2016–2023 (USD Million)
Table 24 Compact Scales Market, By Region, 2016–2023 (USD Million)
Table 25 Compact Scales Market, By End User, 2016–2023 (USD Million)
Table 26 Other Scales Market, By Region, 2016–2023 (USD Million)
Table 27 Other Scales Market, By End User, 2016–2023 (USD Million)
Table 28 Market, By End User, 2016–2023 (USD Million)
Table 29 Laboratory Balances and Scales Market for Pharmaceutical, Cosmeceutical, and Biotechnology Products Testing Laboratories, By Region, 2016-2023 (USD Million)
Table 30 Market for Chemical and Material Testing Laboratories, By Region, 2016-2023 (USD Million)
Table 31 Laboratory Balances and Scales Market for Food and Beverage Testing Laboratories, By Region, 2016-2023 (USD Million)
Table 32 Market for Petroleum Product Testing Laboratories, By Region, 2016-2023 (USD Million)
Table 33 Market for Research Laboratories and Academic Institutes, By Region, 2016-2023 (USD Million)
Table 34 Laboratory Balances and Scales Market for Other End Users, By Region, 2016-2023 (USD Million)
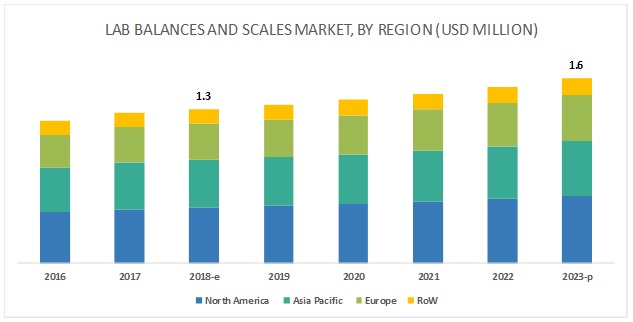
Table 35 Lab Balances and Scales Market, By Region, 2016–2023 (USD Million)
Table 36 Lab Balances Market, By Region, 2016–2023 (USD Million)
Table 37 Lab Balances Market, By Country, 2016–2023 (USD Million)
Table 38 Lab Scales Market, By Region, 2016–2023 (USD Million)
Table 39 Lab Scales Market, By Country, 2016–2023 (USD Million)
Table 40 North America: Lab Balances Market, By Country, 2016–2023 (USD Million)
Table 41 North America: Lab Scales Market, By Country, 2016–2023 (USD Million)
Table 42 North America: Lab Balances Market, By Type, 2016–2023 (USD Million)
Table 43 North America: Lab Scales Market, By Type, 2016–2023 (USD Million)
Table 44 North America: Lab Balances Market, By End User, 2016–2023 (USD Million)
Table 45 North America: Lab Scales Market, By End User, 2016–2023 (USD Million)
Table 46 US: Lab Balances and Scales Market, By Type, 2016–2023 (USD Million)
Table 47 US: Lab Balances Market, By Type, 2016–2023 (USD Million)
Table 48 US: Lab Scales Market, By Type, 2016–2023 (USD Million)
Table 49 Canada: Lab Balances and Scales Market, By Type, 2016–2023 (USD Million)
Table 50 Canada: Lab Balances Market, By Type, 2016–2023 (USD Million)
Table 51 Canada: Lab Scales Market, By Type, 2016–2023 (USD Million)
Table 52 Europe: Lab Balances Market, By Country, 2016–2023 (USD Million)
Table 53 Europe: Lab Scales Market, By Country, 2016–2023 (USD Million)
Table 54 Europe: Lab Balances Market, By Type, 2016–2023 (USD Million)
Table 55 Europe: Lab Scales Market, By Type, 2016–2023 (USD Million)
Table 56 Europe: Lab Balances Market, By End User, 2016–2023 (USD Million)
Table 57 Europe: Lab Scales Market, By End User, 2016–2023 (USD Million)
Table 58 Germany: Lab Balances and Scales Market, By Type, 2016–2023 (USD Million)
Table 59 Germany: Lab Balances Market, By Type, 2016–2023 (USD Million)
Table 60 Germany: Lab Scales Market, By Type, 2016–2023 (USD Million)
Table 61 UK: Lab Balances and Scales Market, By Type, 2016–2023 (USD Million)
Table 62 UK: Lab Balances Market, By Type, 2016–2023 (USD Million)
Table 63 UK: Lab Scales Market, By Type, 2016–2023 (USD Million)
Table 64 France: Lab Balances and Scales Market, By Type, 2016–2023 (USD Million)
Table 65 France: Lab Balances Market, By Type, 2016–2023 (USD Million)
Table 66 France: Lab Scales Market, By Type, 2016–2023 (USD Million)
Table 67 RoE: Lab Balances and Scales Market, By Type, 2016–2023 (USD Million)
Table 68 RoE: Lab Balances Market, By Type, 2016–2023 (USD Million)
Table 69 RoE: Lab Scales Market, By Type, 2016–2023 (USD Million)
Table 70 Asia Pacific: Lab Balances Market, By Country, 2016–2023 (USD Million)
Table 71 Asia Pacific: Lab Scales Market, By Country, 2016–2023 (USD Million)
Table 72 Asia Pacific: Lab Balances Market, By Type, 2016–2023 (USD Million)
Table 73 Asia Pacific: Lab Scales Market, By Type, 2016–2023 (USD Million)
Table 74 Asia Pacific: Lab Balances Market, By End User, 2016–2023 (USD Million)
Table 75 Asia Pacific: Lab Scales Market, By End User, 2016–2023 (USD Million)
Table 76 Japan: Lab Balances and Scales Market, By Type, 2016–2023 (USD Million)
Table 77 Japan: Lab Balances Market, By Type, 2016–2023 (USD Million)
Table 78 Japan: Lab Scales Market, By Type, 2016–2023 (USD Million)
Table 79 China: Lab Balances and Scales Market, By Type, 2016–2023 (USD Million)
Table 80 China: Lab Balances Market, By Type, 2016–2023 (USD Million)
Table 81 China: Lab Scales Market, By Type, 2016–2023 (USD Million)
Table 82 India: Lab Balances and Scales Market, By Type, 2016–2023 (USD Million)
Table 83 India: Lab Balances Market, By Type, 2016–2023 (USD Million)
Table 84 India: Lab Scales Market, By Type, 2016–2023 (USD Million)
Table 85 RoAPAC: Lab Balances and Scales Market, By Type, 2016–2023 (USD Million)
Table 86 RoAPAC: Lab Balances Market, By Type, 2016–2023 (USD Million)
Table 87 RoAPAC: Lab Scales Market, By Type, 2016–2023 (USD Million)
Table 88 RoW: Lab Balances Market, By Type, 2016–2023 (USD Million)
Table 89 RoW: Lab Scales Market, By Type, 2016–2023 (USD Million)
Table 90 RoW: Lab Balances Market, By End User, 2016–2023 (USD Million)
Table 91 RoW: Lab Balances Market, By End User, 2016–2023 (USD Million)
List of Figures (38 Figures)
Figure 1 Research Design
Figure 2 Breakdown of Primaries: Global Lab Balances and Scales Market
Figure 3 Research Methodology: Hypothesis Building
Figure 4 Market Size Estimation: Market
Figure 5 Data Triangulation Methodology
Figure 6 Laboratory Balances and Scales Market, By Type, 2018 vs 2023
Figure 7 Regional Analysis: Laboratory Balances Market Share, By Type, 2018
Figure 8 Market Share, By End User, 2018 vs 2023
Figure 9 Geographic Snapshot: Market
Figure 10 Expansion of the Research Pipeline of Pharma-Biotech Companies & Cros are the Key Factor That Drives Market Growth
Figure 11 Analytical Balances to Dominate the Laboratory Balances Market During the Forecast Period
Figure 12 Bench Scales Segment Will Continue to Dominate the Laboratory Scales Market in 2023
Figure 13 Pharmaceutical, Cosmeceutical, and Biotechnology Product Testing Laboratories Will Dominate the Market in 2018
Figure 14 China is Estimated to Be the Fastest-Growing Country in the Laboratory Balances and Scales Market During the Study Period
Figure 15 Market: Drivers, Restraints, and Opportunities
Figure 16 Evolution of Laboratory Balances With Advanced Technologies
Figure 17 Increasing Size of the R&D Pipeline of Aggregated Pharmaceutical Companies From 2001 to 2017
Figure 18 Novartis Had the Highest Research Investments in the Pharma-Biotech Industry in 2016 (USD Billion)
Figure 19 Global Trend for Phases of Clinical Trial, (2007–2017)
Figure 20 Asia Pacific Countries to Witness High Growth in Research Activities Due to the Increasing Presence of R&D Companies
Figure 21 Analytical Balances to Dominate the Laboratory Balances Market in 2018
Figure 22 Bench Scales to Dominate the Laboratory Scales Market During the Forecast Period
Figure 23 Pharmaceutical, Cosmeceutical, & Biotechnology Product Testing Laboratories to Dominate the Market During the Forecast Period
Figure 24 Pharmacological Research Pipeline, By Development Phase, 2017 vs 2016
Figure 25 Asia Pacific to Register the Highest Growth in the Lab Balances and Scales Market During the Forecast Period
Figure 26 North America: Lab Balances and Scales Market Snapshot
Figure 27 Europe: Lab Balances and Scales Market Snapshot
Figure 28 Phases of Clinical Trials in France During 2012–2016
Figure 29 Asia Pacific: Lab Balances and Scales Market Snapshot
Figure 30 RoW: Lab Balances and Scales Market Snapshot
Figure 31 Key Developments in the Lab Balances and Scales Market From 2014 to 2018
Figure 32 Mettler-Toledo International Held the Leading Position in the Lab Balances and Scales Market in 2017
Figure 33 A&D Company, Ltd.: Company Snapshot
Figure 34 Bonso Electronics International: Company Snapshot
Figure 35 Danaher Corporation: Company Snapshot
Figure 36 Mettler Toledo International: Company Snapshot
Figure 37 Sartorius AG: Company Snapshot
Figure 38 Shimadzu Corporation: Company Snapshot

 Generating Response ...


Growth opportunities and latent adjacency in Laboratory Balances and Scales Market