Load Balancer Market by Component (Hardware, Software, and Services), Load Balancer Type (Global Load Balancer and Local Load Balancer), Deployment Type, (On-Premises and Cloud), Organization Size, Vertical, and Region - Global Forecast to 2023


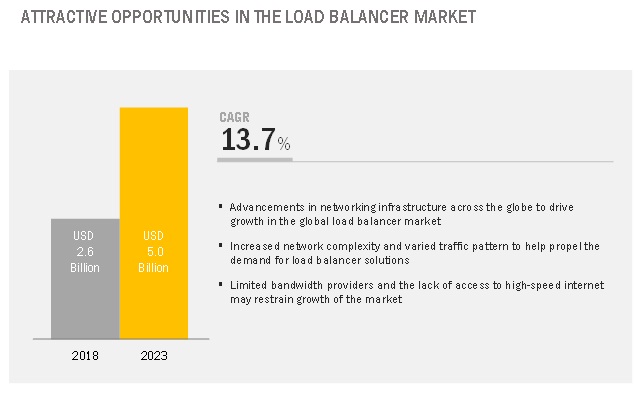
[151 Pages Report] The global load balancer market size expected to grow from USD 2.6 billion in 2018 to USD 5.0 billion by 2023, at a Compound Annual Growth Rate (CAGR) of 13.7% during the forecast period. Increasing adoption of cloud load balancing services, data center traffic, and server virtualization are major growth factors for the global load balancing market.
The report provides detailed insights into the load balancer market by regions, segments, and application areas. The market by component has solution and services segments. The services considered for the market include training, consulting and integration, and support and maintenance.
By load balancer type, global load balancer segment to be a larger contributor to the load balancer market growth during the forecast period
Global load balancers facilitate network traffic distribution to a group of data centers in various geographic locations. These load balancers are located at a single site and provide load balancing to multiple sites or data centers. Global load balancers act as internet DNS services and provide the IP address to local clients who are accessing data center services. Global load balancers are expected to witness significant adoption due to growth in interconnected data center infrastructures which require efficient load balancing to deliver optimum performance.
By organization size, large enterprises segment to be a larger contributor in the market during the forecast period
The adoption of load balancers is higher in the large enterprises segment, and the trend is expected to continue during the forecast period. Load balancers offer scalability to large enterprises. Therefore, large enterprises are majorly investing in advanced technologies to increase their overall productivity and efficiency.
By deployment type, on-premises segment to be a larger contributor in the Load Balancer Market during the forecast period
On-premises load balancers are software-based load balancers deployed to provide load balancing on-premises for applications running in the data center. Organizations prefer deploying load balancers in the same environment, as the resources they are load balancing to deliver optimal application performance. For instance, organizations prefer to deploy cloud-based load balancers for cloud-hosted applications; however, they prefer to deploy on-premises load balancers for applications running within the data center.
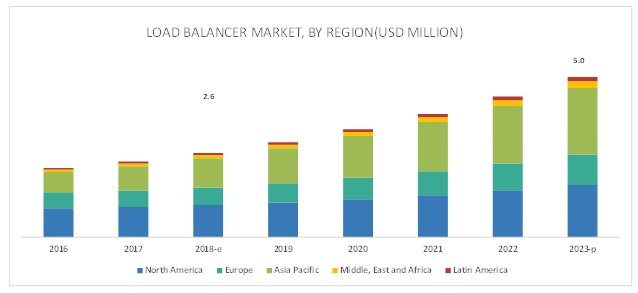
APAC to account for the largest market size during the forecast period
APAC has a favorable market for vendors of load balancer solution and services. APAC has witnessed significant growth in terms of data center workloads and the trend is expected to continue over the next few years. The growth in data center workload has led to an increased demand for load balancer solutions in APAC.
Key Players
Major vendors in the global load balancer market are AWS (US), F5 Networks (US), Citrix Systems (US), Microsoft (US), HPE (US), IBM (US), Google (US), Imperva (US), NGINX (US), Radware (Israel). The market players have adopted various growth strategies, such as partnerships, collaborations, and expansions, to remain competitive in the market. NGINX, a leading player in the market, provides software product, NGINX Plus software for load balancer and web server. NGINX has adopted various organic and inorganic growth strategies. Its organic growth strategies include new product launches, product upgradations, and business expansions. Through the strategies, NGINX is enhancing its product portfolio and expanding its market reach.
Recent Developments
- In September 2018, AWS and Salesforce expanded their partnership by integrating new products to simplify offerings to customers.
- In May 2018, Microsoft and Red Hat expanded their alliance for container-based applications across Microsoft Azure and on-premises to introduce the first jointly managed OpenShift offering in the public cloud, combining the power of Red Hat OpenShift and Azure, Microsoft�s public cloud.
- In June 2018, IBM expanded its capabilities on IBM Cloud and strategies to expand the cloud�s global reach. The announcements included the global availability of multi-zone clusters and worldwide availability of IBM Cloud Internet Services through 18 new zones in North America, Europe, and APAC.
Scope of the Load Balancer Market Report
|
Report Metric |
Details |
|
Market size available for years |
2016�2023 |
|
Base year considered |
2018 |
|
Forecast period |
2018�2023 |
|
Forecast units |
Billion (USD) |
|
Segments covered |
Components (Software, Services), Applications, Deployment Modes, Organization Size, Industry Verticals and Regions |
|
Geographies covered |
North America, APAC, Europe, and RoW |
|
Companies covered |
AWS (US), F5 Networks (US), Citrix Systems (US), Microsoft (US), HPE (US), IBM (US), Google (US), Imperva (US), NGINX (US), Radware (Israel), Fortinet (US), A10 Networks (US), Kemp Technologies (US), Riverbed Technologies (US), Fastly (US), Dialogic (US), Avi Networks (US), Joyent (US), Inlab Software (Germany), Cloudflare, Inc. (US), Zevenet (Spain), Array Networks (US), Avanu (US), Barracuda Networks (US), and loadbalancer.org (UK) |
The research report categorizes the load balancer market to forecast the revenues and analyze the trends in each of the following subsegments:
Market By Component:
- Hardware
- Software
- Services
Load Balancer Market By Services:
- Training and Consulting
- Integration and Deployment
- Support and Maintenance
Market By Load Balancer Type:
- Global Load Balancer
- Local Load Balancer
Load Balancer Market By Organization Size:
- SMEs
- Large Enterprises
Load Balancer Market By Verticals:
- BFSI
- IT and Telecom
- Government and Public Sector
- Healthcare and Lifesciences
- Manufacturing
- Retail
- Energy
- Media and Entertainment
- Others
Load Balancer Market By Region:
- North America
- US
- Canada
- Europe
- UK
- France
- Germany
- Other European Countries
- APAC
- China
- Japan
- ANZ
- Other APAC Countries
- MEA
- KSA
- South Africa
- UAE
- Other MEA Countries
- Latin America
- Brazil
- Mexico
- Other Latin American Countries
Critical questions the report answers:
- Where will all these developments take the industry in the mid to long term?
- What are the upcoming industry applications for load balancing market?
- Which segment provides the most opportunity for growth?
- Who are the leading vendors operating in this load balancer market?
- What are the opportunities for new market entrants?
To speak to our analyst for a discussion on the above findings, click Speak to Analyst
 Exclusive indicates content/data unique to MarketsandMarkets and not available with any competitors.
Table of Contents
1 Introduction (Page No. - 17)
1.1 Objectives of the Study
1.2 Market Definition
1.3 Market Scope
1.4 Years Considered for the Study
1.5 Stakeholders
2 Research Methodology (Page No. - 20)
2.1 Research Data
2.1.1 Secondary Data
2.1.2 Primary Data
2.1.2.1 Breakup of Primaries
2.1.2.2 Key Industry Insights
2.2 Market Breakdown and Data Triangulation
2.3 Market Size Estimation
2.3.1 Bottom-Up Approach
2.3.2 Top-Down Approach
2.4 Assumptions for the Study
2.5 Limitations of the Study
3 Executive Summary (Page No. - 27)
4 Premium Insights (Page No. - 32)
4.1 Attractive Growth Opportunities in the Load Balancer Market
4.2 By Component, 2018
4.3 By Deployment Type, 2018
4.4 By Vertical, 2018
4.5 Market Investment Scenario, 2018�2023
5 Load Balancer Market Overview (Page No. - 35)
5.1 Introduction
5.2 Market Dynamics
5.2.1 Drivers
5.2.1.1 Increasing Adoption of Cloud Load Balancing Services, Data Center Traffic, and Server Virtualization
5.2.1.2 Growing Investments in New Digital Transformation Initiatives By Governments
5.2.1.3 Advancements in the Networking Infrastructure Across the Globe
5.2.1.4 Increased Awareness Among Enterprises About the Benefits of Cloud and Networking Technologies
5.2.1.5 Increased Network Complexity and Varied Traffic Pattern
5.2.2 Restraints
5.2.2.1 Limited Bandwidth Providers and the Lack of Access to High-Speed Internet
5.2.3 Opportunities
5.2.3.1 Exponential Growth in Global IP Traffic and Cloud Traffic
5.2.3.2 Surging Adoption of IoT, AI, and SDN Technologies
5.2.3.3 Higher Involvement of Vars and Load Balancer Vendors
5.2.4 Challenges
5.2.4.1 Implementation of the Latest Load Balancer Components in the Existing Or Traditional Networking Ecosystem
6 Load Balancer Market, By Component (Page No. - 40)
6.1 Introduction
6.2 Hardware
6.2.1 Hardware-Based Load Balancers Help in Reducing Complexities of Infrastructure Management With A Single Application Delivery Network Applications42
6.3 Software
6.3.1 Software-Based Load Balancers Provide Real-Time Scalability
6.4 Services
6.4.1 Services Help in Providing Efficient Implementation, and Support and Maintenance of Load Balancer Solutions
7 Market, By Service (Page No. - 45)
7.1 Introduction
7.2 Training and Consulting
7.2.1 Training and Consulting Services Enable Effective Decision-Making in Implementing the Right Load Balancer Solution
7.3 Integration and Deployment
7.3.1 Integration and Deployment Provides Effective Integration of Vendors� Offerings With Clients� Existing Infrastructure and Business Functions
7.4 Support and Maintenance
7.4.1 Support and Maintenance Services Provide A Single Point of Contact to Help Solve Customer Issues Quickly
8 Load Balancer Market, By Load Balancer Type (Page No. - 50)
8.1 Introduction
8.2 Global Load Balancers
8.2.1 Global Load Balancers Provide Load Balancing to Multiple Sites Or Data Centers
8.3 Local Load Balancer
8.3.1 Local Load Balancers are Deployed to Control Traffic Distribution Within Data Centers
9 Market, By Organization Size (Page No. - 54)
9.1 Introduction
9.2 Small and Medium-Sized Enterprises
9.2.1 The Implementation of Load Balancer as A Service is Expected to Result in Reduced Costs and Improved Business Efficiency for the Small 56
9.3 Large Enterprises
9.3.1 Large Enterprises are Majorly Investing in Advanced Technologies to Increase their Overall Productivity and Efficiency
10 Load Balancer Market, By Deployment Type (Page No. - 58)
10.1 Introduction
10.2 On-Premises
10.2.1 Software-Based On-Premises Load Balancers are Mainly Deployed for Applications Running in Data Centers
10.3 Cloud
10.3.1 Cloud-Based Load Balancers Create A Simple Model for Application Teams to Easily Scale-Up their Load Balancers
11 Market, By Vertical (Page No. - 62)
11.1 Introduction
11.2 Banking, Financial Services, and Insurance
11.2.1 Digitalization Provides Strong and Credible Solutions and Helps Banks Enhance their Quality of Services
11.3 It and Telecom
11.3.1 Load Balancer Solutions Provide Undisrupted Connectivity in the It and Telecom Vertical With the Help of Intelligent Traffic Routing
11.4 Government and Public Sector
11.4.1 Load Balancer Solutions Help in Reducing Cyber Threats and Meeting High Standards of Effectiveness
11.5 Retail
11.5.1 Load Balancer Solutions Promise to Provide High-Performance Load Balancing to Ensure That Retail Websites are Always Up and Running
11.6 Manufacturing
11.6.1 Load Balancers Help in Providing Full Data Visibility and Ensure That the Data Remains Protected in the Manufacturing Sector
11.7 Energy
11.7.1 Load Balancers Help in Streamlining the It Workflow and Smooth Functioning in the Energy Vertical
11.8 Media and Entertainment
11.8.1 Load Balancer Solutions Help in Increasing the Operational Efficiency of Broadcasters
11.9 Healthcare and Life Sciences
11.9.1 Highly Critical Applications in the Healthcare Domain are Easily Taken Care of By High-Performing Load Balancers
11.10 Others
11.10.1 Travel and Hospitality, and Education Verticals are Expected to Adopt Load Balancer Solutions at A Faster Pace Shortly
12 Load Balancer Market, By Region (Page No. - 73)
12.1 Introduction
12.2 North America
12.2.1 North America has Adopted New and Emerging Technologies and Accounts for the Highest Market Share
12.3 Europe
12.3.1 With Heavy Spending on It Infrastructure Services, Europe is the 2nd Largest Player in Terms of Adopting Load Balancer Solutions
12.4 Asia Pacific
12.4.1 Fastest-Growing Economies and Favourable Markets are Important Drivers for the Adoption of Load Balancer Solutions in the Asia Pacific Region
12.5 Middle East and Africa
12.5.1 Technological Advancements, Emerging Technologies, and Cloud Computing Drive the Growth of Load Balancer Solutions
12.6 Latin America
12.6.1 Cost-Effective It Infrastructure Deployments and Explosion of New Technologies are Expected to Drive the Adoption of Cost-Effective Solutions
13 Competitive Landscape (Page No. - 93)
13.1 Overview
13.2 Competitive Scenario
13.2.1 New Product Launches
13.2.2 Business Expansions
13.2.3 Acquisitions
13.2.4 Partnerships
14 Company Profiles (Page No. - 96)
(Business Overview, Products and Services Offered, Recent Developments, SWOT Analysis & MnM View)*
14.1 Introduction
14.2 AWS
14.3 F5 Networks
14.4 Citrix Systems
14.5 Microsoft
14.6 IBM
14.7 Google
14.8 Imperva
14.9 NGINX
14.10 Radware
14.11 Fortinet
14.12 HPE
14.13 A1o Networks
14.14 Kemp Technologies
14.15 Riverbed Technology
14.16 Fastly
14.17 Dialogic
14.18 Avi Networks
14.19 Joyent
14.20 Inlab Software
14.21 Cloudflare
14.22 Zevenet
14.23 Array Networks
14.24 Avanu
14.25 Barracuda Networks
14.26 Loadbalancer.Org
*Details on Business Overview, Products and Services Offered, Recent Developments, SWOT Analysis & MnM View Might Not Be Captured in Case of Unlisted Companies.
15 Appendix (Page No. - 144)
15.1 Discussion Guide
15.2 Knowledge Store: Marketsandmarkets� Subscription Portal
15.3 Available Customizations
15.4 Related Reports
15.5 Author Details
List of Tables (67 Tables)
Table 1 Load Balancer Market Size, By Component, 2016�2023 (USD Million)
Table 2 Hardware: Market Size, By Region, 2016�2023 (USD Million)
Table 3 Software: Market Size, By Region, 2016�2023 (USD Million)
Table 4 Services: Market Size, By Region, 2016�2023 (USD Million)
Table 5 Market Size, By Service, 2016�2023 (USD Million)
Table 6 Training and Consulting: Market Size, By Region, 2016�2023 (USD Million)
Table 7 Integration and Deployment: Market Size, By Region, 2016�2023 (USD Million)
Table 8 Support and Maintenance: Market Size, By Region, 2016�2023 (USD Million)
Table 9 Load Balancer Market Size, By Load Balancer Type, 2016�2023 (USD Million)
Table 10 Load Balancer Market Size, By Region, 2016�2023 (USD Million)
Table 11 Local Load Balancer: Market Size, By Region, 2016�2023 (USD Million)
Table 12 Market Size, By Organization Size, 2016�2023 (USD Million)
Table 13 Small and Medium-Sized Enterprises: Market Size, By Region, 2016�2023 (USD Million)
Table 14 Large Enterprises: Market Size, By Region, 2016�2023 (USD Million)
Table 15 Load Balancer Market Size, By Deployment Type, 2016�2023 (USD Million)
Table 16 On-Premises: Market Size, By Region, 2016�2023 (USD Million)
Table 17 Cloud: Market Size, By Region, 2016�2023 (USD Million)
Table 18 Market Size, By Vertical, 2016�2023 (USD Million)
Table 19 Banking, Financial Services, and Insurance: Market Size, By Region, 2016�2023 (USD Million)
Table 20 It and Telecom: Market Size, By Region, 2016�2023 (USD Million)
Table 21 Government and Public Sector: Market Size, By Region, 2016�2023 (USD Million)
Table 22 Retail: Market Size, By Region, 2016�2023 (USD Million)
Table 23 Manufacturing: Market Size, By Region, 2016�2023 (USD Million)
Table 24 Energy: Load Balancer Market Size, By Region, 2016�2023 (USD Million)
Table 25 Media and Entertainment: Market Size, By Region, 2016�2023 (USD Million)
Table 26 Healthcare and Life Sciences: Market Size, By Region, 2016�2023 (USD Million)
Table 27 Others: Market Size, By Region, 2016�2023 (USD Million)
Table 28 Market Size, By Region, 2016�2023 (USD Million)
Table 29 North America: Market Size, By Component, 2016�2023 (USD Million)
Table 30 North America: Market Size, By Service, 2016�2023 (USD Million)
Table 31 North America: Market Size, By Load Balancer Type, 2016�2023 (USD Million)
Table 32 North America: Load Balancer Market Size, By Organization Size, 2016�2023 (USD Million)
Table 33 North America: Market Size, By Deployment Type, 2016�2023 (USD Million)
Table 34 North America: Market Size, By Vertical, 2016�2023 (USD Million)
Table 35 North America: Market Size, By Country, 2016�2023 (USD Million)
Table 36 Europe: Market Size, By Component, 2016�2023 (USD Million)
Table 37 Europe: Market Size, By Service, 2016�2023 (USD Million)
Table 38 Europe: Market Size, By Load Balancer Type, 2016�2023 (USD Million)
Table 39 Europe: Load Balancer Market Size, By Organization Size, 2016�2023 (USD Million)
Table 40 Europe: Market Size, By Deployment Type, 2016�2023 (USD Million)
Table 41 Europe: Market Size, By Vertical, 2016�2023 (USD Million)
Table 42 Europe: Market Size, By Country, 2016�2023 (USD Million)
Table 43 Asia Pacific: Market Size, By Component, 2016�2023 (USD Million)
Table 44 Asia Pacific: Market Size, By Service, 2016�2023 (USD Million)
Table 45 Asia Pacific: Market Size, By Load Balancer Type, 2016�2023 (USD Million)
Table 46 Asia Pacific: Load Balancer Market Size, By Organization Size, 2016�2023 (USD Million)
Table 47 Asia Pacific: Market Size, By Deployment Type, 2016�2023 (USD Million)
Table 48 Asia Pacific: Market Size, By Vertical, 2016�2023 (USD Million)
Table 49 Asia Pacific: Market Size, By Country, 2016�2023 (USD Million)
Table 50 Middle East and Africa: Market Size, By Component, 2016�2023 (USD Million)
Table 51 Middle East and Africa: Market Size, By Service, 2016�2023 (USD Million)
Table 52 Middle East and Africa: Market Size, By Load Balancer Type, 2016�2023 (USD Million)
Table 53 Middle East and Africa: Load Balancer Market Size, By Organization Size, 2016�2023 (USD Million)
Table 54 Middle East and Africa: Market Size, By Deployment Type, 2016�2023 (USD Million)
Table 55 Middle East and Africa: Market Size, By Vertical, 2016�2023 (USD Million)
Table 56 Middle East and Africa: Market Size, By Country, 2016�2023 (USD Million)
Table 57 Latin America: Market Size, By Component, 2016�2023 (USD Million)
Table 58 Latin America: Market Size, By Service, 2016�2023 (USD Million)
Table 59 Latin America: Market Size, By Load Balancer Type, 2016�2023 (USD Million)
Table 60 Latin America: Load Balancer Market Size, By Organization Size, 2016�2023 (USD Million)
Table 61 Latin America: Market Size, By Deployment Type, 2016�2023 (USD Million)
Table 62 Latin America: Market Size, By Vertical, 2016�2023 (USD Million)
Table 63 Latin America: Market Size, By Country, 2016�2023 (USD Million)
Table 64 New Product Launches, 2016�2018
Table 65 Business Expansions, 2018
Table 66 Acquisitions, 2017
Table 67 Partnerships, 2017-2018
List of Figures (43 Figures)
Figure 1 Load Balancer Market: Market Segmentation
Figure 2 Regional Scope
Figure 3 Market: Research Design
Figure 4 Market: Bottom-Up Approach
Figure 5 Load Balancer Market: Top-Down Approach
Figure 6 Global Market Size, 2016�2023 (USD Million)
Figure 7 Software Segment is Expected to Grow at the Highest Rate During the Forecast Period
Figure 8 Hardware Segment is Estimated to Account for the Largest Market Share in 2018
Figure 9 It and Telecom Vertical is Estimated to Account for the Highest Market Share in 2018
Figure 10 North America is Estimated to Account for the Largest Market Size in 2018
Figure 11 Increasing Shift Toward Cloud Workloads and Surging Network Traffic Across Regions are Expected to Drive the Load Balancer Market
Figure 12 Hardware Segment is Estimated to Account for the Largest Market Share in 2018
Figure 13 On-Premises Segment is Estimated to Account for A Higher Market Share in 2018
Figure 14 Banking, Financial Services, and Insurance Vertical is Estimated to Account for the Largest Market Size in 2018
Figure 15 Asia Pacific is Expected to Emerge as the Best Market for Investments in the Next 5 Years
Figure 16 Drivers, Restraints, Opportunities, and Challenges: Market
Figure 17 Software Segment is Expected to Grow at the Highest CAGR During the Forecast Period
Figure 18 Integration and Deployment Segment is Expected to Grow at the Highest CAGR During the Forecast Period
Figure 19 Global Load Balancer Segment is Expected to Register A Higher CAGR During the Forecast Period
Figure 20 Large Enterprises Segment is Expected to Register A Higher CAGR During the Forecast Period
Figure 21 Cloud Segment is Expected to Register A Higher CAGR During the Forecast Period
Figure 22 It and Telecom Vertical is Expected to Register the Highest CAGR During the Forecast Period
Figure 23 Asia Pacific is Expected to Grow at the Highest CAGR During the Forecast Period
Figure 24 North America: Load Balancer Market Snapshot
Figure 25 Asia Pacific: Market Snapshot
Figure 26 Key Developments By the Leading Players in the Load Balancer Market During 2015�2018
Figure 27 AWS: Company Snapshot
Figure 28 AWS: SWOT Analysis
Figure 29 F5 Networks: Company Snapshot
Figure 30 F5 Networks: SWOT Analysis
Figure 31 Citrix Systems: Company Snapshot
Figure 32 Citrix Systems: SWOT Analysis
Figure 33 Microsoft: Company Snapshot
Figure 34 Microsoft: SWOT Analysis
Figure 35 IBM: Company Snapshot
Figure 36 IBM: SWOT Analysis
Figure 37 Google: Company Snapshot
Figure 38 Imperva: Company Snapshot
Figure 39 Radware: Company Snapshot
Figure 40 Fortinet: Company Snapshot
Figure 41 HPE: Company Snapshot
Figure 42 A10 Networks: Company Snapshot
Figure 43 Barracuda Networks: Company Snapshot
The study involved 4 major activities to estimate the current market size for load balancer products. Exhaustive secondary research was done to collect information on market, peer market, and parent market. The next step was to validate these findings, assumptions, and sizing with industry experts across the value chain through primary research. Both top-down and bottom-up approaches were employed to estimate the complete market size. Thereafter, market breakdown and data triangulation were used to estimate the market size of segments and sub segments.
Secondary Research
In the secondary research process, various secondary sources were referred to for identifying and collecting information for this study. The secondary sources included annual reports, press releases, and investor presentations of companies; white papers such as Cisco Cloud Index; certified publications; and articles from recognized associations, such as data center knowledge and government publishing sources. Secondary sources such as Factiva and D&B hoovers were also considered for Load Balancer Market study. Secondary research was mainly used to obtain key information about the industry�s value chain, total pool of key players, market classification and segmentation as per the industry trends to the bottom-most level, regional markets, and key developments from both market and technology-oriented perspectives.
Primary Research
In the primary research process, various primary sources from both supply and demand-sides were interviewed to obtain qualitative and quantitative information for this report. Primary sources from the supply side included industry experts, such as Chief Executive Officers (CEOs), Vice Presidents (VPs), marketing directors, technology and innovation directors, and related key executives from various key companies and organizations providing load balancer software and services. The primary sources from the demand-side included the end-users of load balancer software, which included Chief Information Officers (CIOs), IT technicians and technologists, and IT managers at public and investor-owned utilities.
The following figure depicts the breakup of the primary profiles:
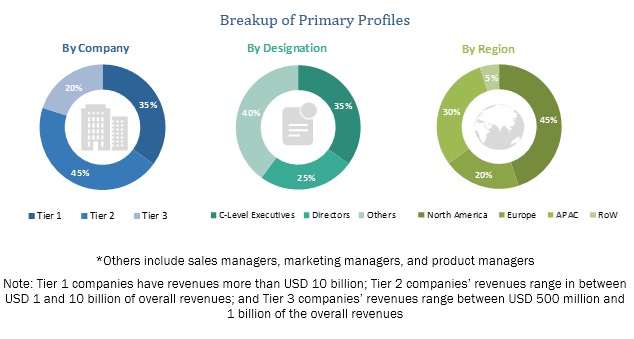
To know about the assumptions considered for the study, download the pdf brochure
Load Balancer Market Size Estimation
Both top-down and bottom-up approaches were used to estimate and validate the total size of the load balancer market. They were also used extensively to estimate the size of various subsegments in the market. The research methodology used to estimate the market size includes the following:
- The key players in the industry and markets have been identified through extensive secondary research.
- The industry�s supply chain and market size, in terms of value, have been determined through primary and secondary research processes.
- All percentage shares, splits, and breakdowns have been determined using secondary sources and verified through primary sources.
Data Triangulation
After arriving at the overall market size-using the market size estimation processes as explained above�the market was split into several segments and subsegments. In order to complete the overall market engineering process and arrive at the exact statistics of each market segment and subsegment, the data triangulation and market breakdown procedures were employed, wherever applicable. The data was triangulated by studying several factors and trends from both, the demand and supply sides, in the load balancer market.
Objectives of the Load Balancer Market Study
- To define, segment, and project the global market size for load balancer
- To understand the structure of the load balancer market by identifying its various subsegments
- To provide detailed information about the key factors (drivers, restraints, opportunities, and industry-specific challenges) influencing the growth of the market
- To analyze the micromarkets with respect to individual growth trends, prospects, and their contribution to the total market
- To project the size of the market and its submarkets, in terms of value, with respect to the 5 major regions (along with their respective key countries)
- To profile key players and comprehensively analyze their core competencies
- To understand the competitive landscape and identify major growth strategies adopted by players across key regions
- To analyze the competitive developments, such as expansions & investments, new product launches, mergers & acquisitions, joint ventures, and agreements, in the load balancer market
Available Customizations
With the given market data, MarketsandMarkets offers customizations as per the company�s specific needs and on best effort basis for profiling of additional market players.


Growth opportunities and latent adjacency in Load Balancer Market