
Machine Control System Market Size, Share & Trends

Machine Control System Market Size, Share & Trends by Type (Total Stations, Global Navigation Satellite Systems (GNSS), Laser Scanners, Sensors), By End-use Equipment (Excavators, Dozers, Graders, Scrapers, Loaders, Paving Systems) - Global Forecast to 2030


MACHINE CONTROL SYSTEM MARKET SIZE, SHARE & TRENDS
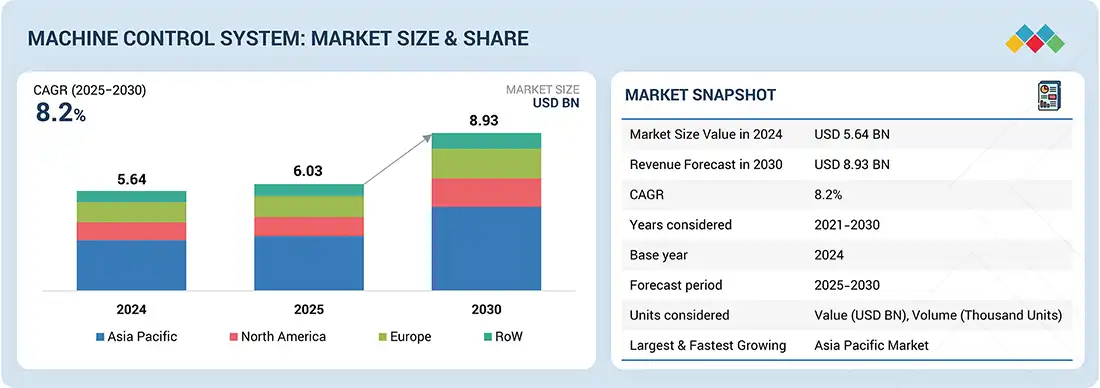
According to Marketsandmarkets, The global machine control system market size was valued at USD 6.03 billion in 2025 and is projected to reach USD 8.93 billion by 2030, growing at a CAGR of 8.2% from 2025 to 2030. during the forecast period. Machine control systems integrate GNSS, total stations, laser scanners, and sensors to guide earthmoving equipment precisely. Market expansion is driven by increasing adoption in infrastructure, commercial, residential, and industrial construction, supported by IoT connectivity and AI-driven solutions that enhance accuracy, reduce rework, and optimize project execution.
MARKET SNAPSHOT TABLE
| REPORT METRIC | DETAILS |
|---|---|
| Market Size in 2025 (Value) | USD 6.03 Billion |
| Market Forecast in 2030 (Value) | USD 8.93 Billion |
| Growth Rate | CAGR of 8.2% from 2025–2030 |
| Years Considered | 2021–2030 |
| Base Year | 2024 |
| Forecast Period | 2025–2030 |
| Units Considered | Value (USD Million/Billion), Volume (In thousand units) |
| Report Coverage | Revenue forecast, company ranking, competitive landscape, growth factors, and trends |
| Top Companies |
|
| Growth Driver |
|
| Segments Covered |
|
| Regional Scope | North America, Asia Pacific, Europe, the Middle East & Africa, and Latin America |
Market Size & Forecast
• 2025 Market Size: USD 6.03 Billion
• 2030 Projected Market Size: USD 8.93 Billion
• CAGR (2025-2030): 8.2%
• Industrial Segment : Highest CAGR
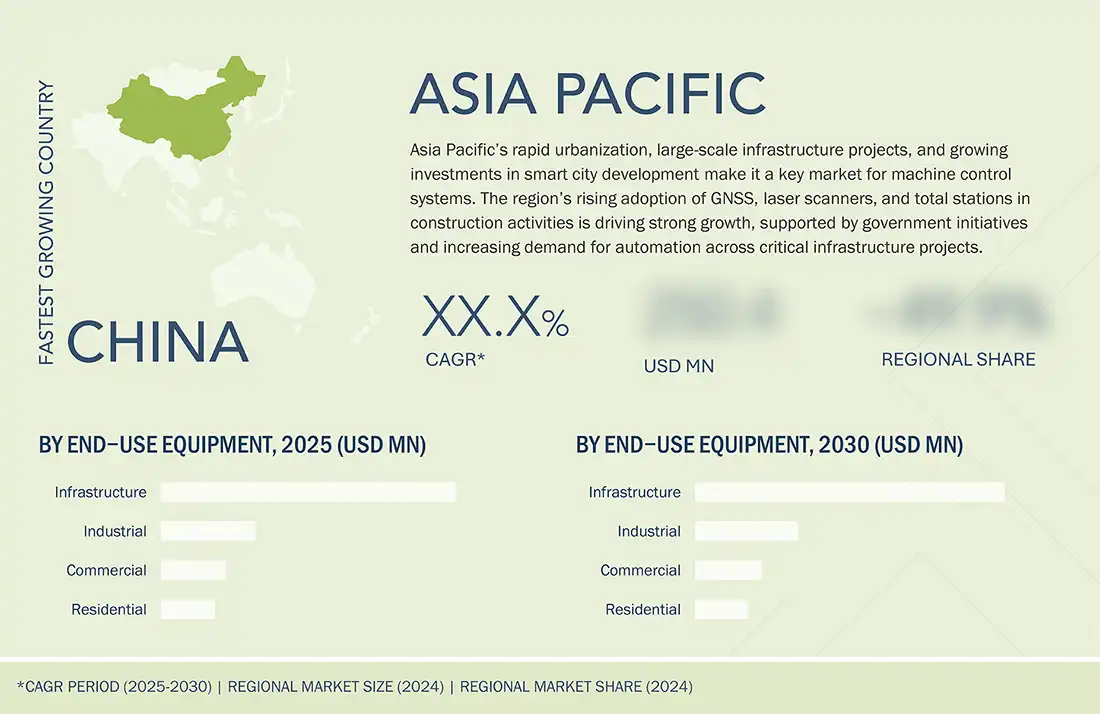
• Asia Pacific : Fastest growing market
KEY TAKEAWAYS
-
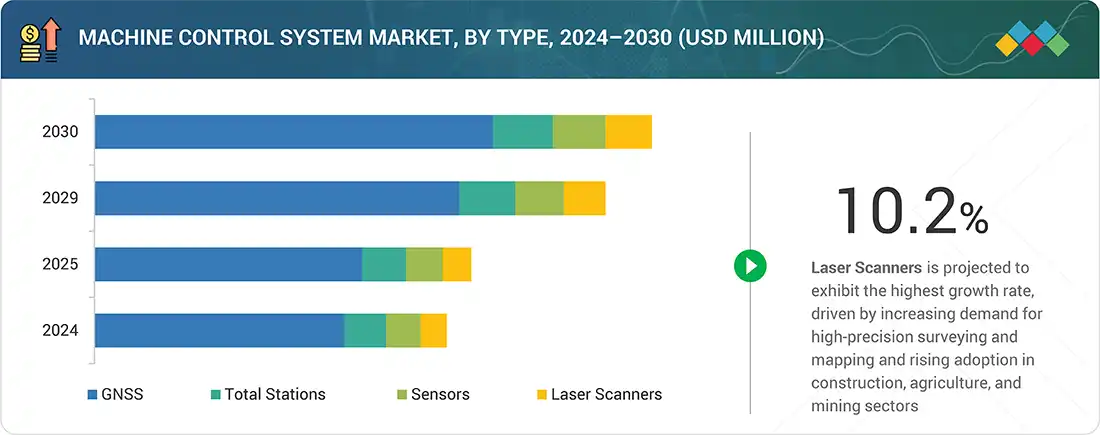
BY TYPEThe machine control system market comprises total stations, GNSS, laser scanners, and sensors, with GNSS and total stations playing a central role in positioning accuracy. Laser scanners and sensors are increasingly integrated to capture precise data, enhancing productivity, safety, and automation in construction projects.
-
BY END–USE EQUIPMENTKey end–use equipment includes excavators, loaders, graders, dozers, scrapers, and paving systems. These systems enable operators to execute construction tasks more precisely, reducing rework, material wastage, and operational downtime. Integrating machine control systems ensures improved project efficiency and cost savings.
-
BY VERTICALAdoption is driven by the infrastructure sector, followed by commercial, residential, and industrial construction projects. Governments' focus on smart infrastructure development and private sector investments in construction automation contribute significantly to market growth.
-
BY REGIONAsia Pacific is projected to record the fastest growth with a CAGR of 9.0%, driven by rapid urbanization, smart city projects, and large-scale infrastructure developments in China, India, and Southeast Asia. North America and Europe remain significant markets due to high adoption of automation technologies and substantial investments in advanced construction equipment.
-
COMPETITIVE LANDSCAPELeading players such as Hexagon AB (Sweden), Trimble Inc. (US), Topcon Corporation (Japan), MOBA Mobile Automation AG (Germany), and Hemisphere GNSS (US) are adopting organic and inorganic growth strategies. These include product innovation, partnerships, acquisitions, and investments to expand their footprint and meet rising demand for precision-based construction solutions.
The machine control system industry is expected to grow considerably over the next decade, fueled by increasing demand for automation and precision in construction projects. Integrating GNSS, total stations, laser scanners, and sensors enhances project accuracy, reduces rework, and improves safety. This makes the machine control systems essential for efficient operations, cost savings, and timely project completion across industries.
Source: Secondary Research, Interviews with Experts, MarketsandMarkets Analysis
TRENDS & DISRUPTIONS IMPACTING CUSTOMERS' CUSTOMERS
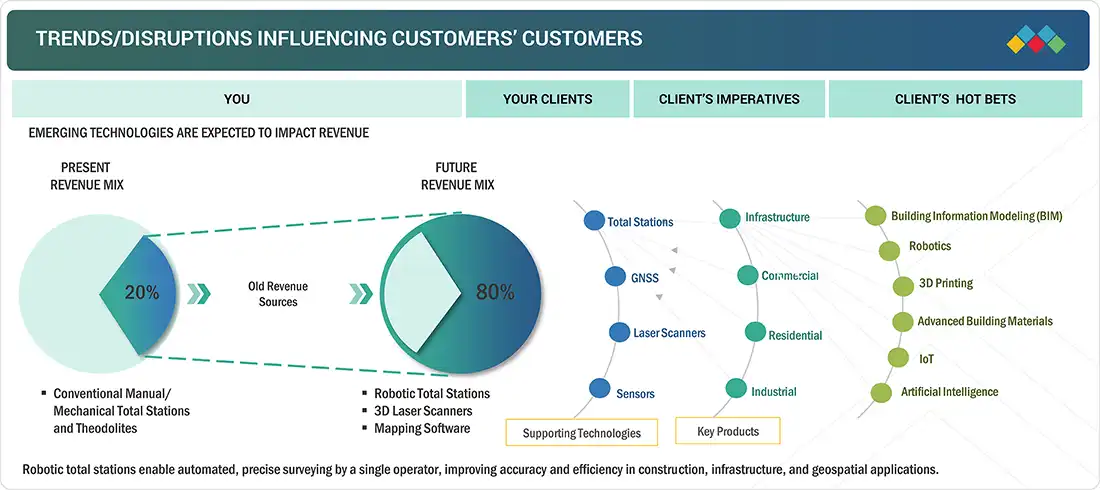
The machine control market is experiencing a shift driven by emerging technologies, evolving customer demands, and rapid digitalization across industries. Manufacturers increasingly focus on advanced solutions such as robotics, IoT, AI, and Building Information Modeling (BIM) to address productivity, safety, and cost challenges. As infrastructure, commercial, residential, and industrial projects adopt automation, machine control solutions are becoming critical for precision, efficiency, and sustainability. These trends present opportunities for manufacturers to innovate, capture niche markets, and expand revenue streams in a competitive landscape.
Source: Secondary Research, Interviews with Experts, MarketsandMarkets Analysis
MACHINE CONTROL SYSTEM MARKET DYNAMICS
Level
-
Need to optimize earthwork operations by leveraging advanced technologies

-
Need to monitor and control construction equipment to ensure optimal performance

Level
-
High installation and integration costs

-
Performance-related issues in harsh weather conditions

Level
-
Rising demand for 3D data in construction industry

-
Infrastructure development in emerging economies

Level
-
Lack of technical knowledge

Source: Secondary Research, Interviews with Experts, MarketsandMarkets Analysis
Driver: Need to optimize earthwork operations by leveraging advanced technologies
Machine control systems transform traditional earthwork operations by replacing manual survey methods with digital design references, eliminating the need for survey pegs. Operators receive real-time horizontal and vertical site data, enhancing accuracy and reducing reliance on grade checkers. These systems improve precision, cut survey costs, and enhance safety by leveraging GNSS and sensor technologies. They enable efficient, pegless construction, ensuring higher productivity, sustainability, and cost-effectiveness in modern earthwork and construction projects.
Restraint: High installation and integration costs
Machine control systems enhance earthmoving productivity, accuracy, and safety, but involve high installation and integration costs. Expenses for GNSS receivers, total stations, laser scanners, software, and retrofitting older equipment create barriers for smaller firms. Additional costs for operator training and compatibility upgrades further limit adoption, making the substantial upfront investment a key restraint to market growth.
Opportunity: Rising demand for 3D data in the construction industry
The growing demand for 3D data in construction creates opportunities for machine control systems. Surveying technologies like GNSS, UAVs, laser scanners, and advanced total stations now integrate 3D modeling, digital imaging, and scanning features to improve project design and execution. Solutions such as Leica Nova MS60 and Topcon GTL-1000 enable faster, precise surveying, driving the adoption of advanced 3D-enabled construction technologies.
Challenge: Lack of technical knowledge
The construction industry requires skilled staff to operate grade and slope systems, set up total stations, and interpret geospatial data for 2D and 3D machine control. However, limited technical knowledge and resistance to retraining hinder adoption. This shortage of expertise restricts effective utilization, posing a key challenge to market growth.
Machine Control System Market: COMMERCIAL USE CASES ACROSS INDUSTRIES
| COMPANY | USE CASE DESCRIPTION | BENEFITS |
|---|---|---|
|
|
Advanced total stations and GNSS solutions for precision grading, excavation, and paving systems in large infrastructure projects | Enhanced accuracy in surveying and construction, reduced rework costs, accelerated project completion, improved asset utilization |
|
|
Integrated GNSS and laser scanners in excavators and dozers for real-time guidance and autonomous operation | Improved construction productivity, minimized fuel consumption, increased operator efficiency, optimized earthmoving operations |
|
|
3D machine control systems for pavers and graders leveraging GNSS and total stations | Seamless project execution, superior road quality, reduced material wastage, enhanced safety on construction sites |
|
|
Sensor-based control systems for paving machines and asphalt compactors | Precise layer thickness control, consistent compaction quality, reduced material costs, extended pavement lifecycle |
|
|
High-precision GNSS receivers and positioning solutions for loaders, scrapers, and graders | Reliable performance in challenging environments, cost-effective surveying, enhanced fleet productivity, and simplified integration with OEM platforms |
Logos and trademarks shown above are the property of their respective owners. Their use here is for informational and illustrative purposes only.
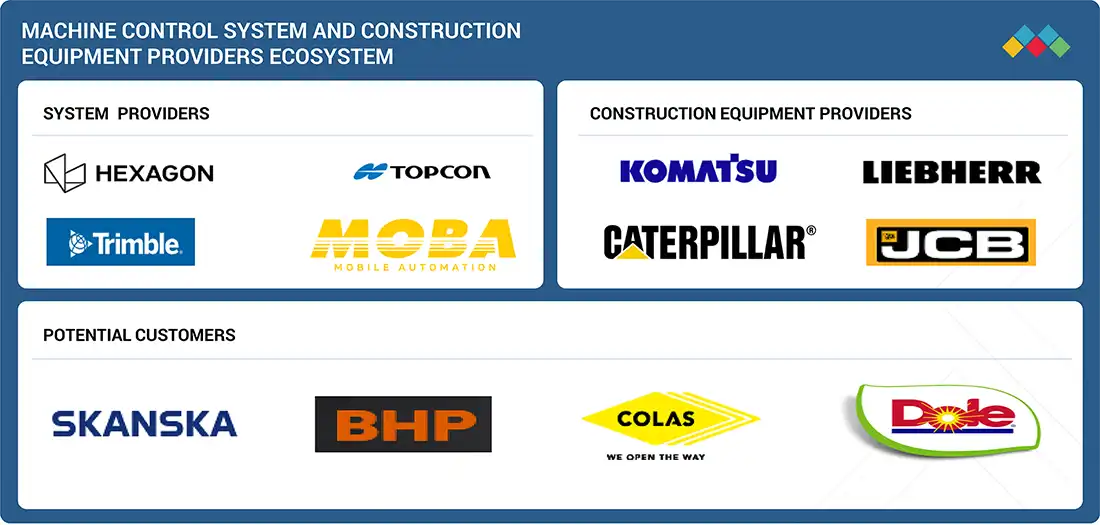
MACHINE CONTROL SYSTEM MARKET ECOSYSTEM
The machine control system market is supported by a strong ecosystem of machine control system providers, technology developers, and construction equipment providers. Machine control system companies such as Hexagon AB (Sweden), Trimble Inc. (US), TOPCON CORPORATION (Japan), and MOBA Mobile Automation AG (Germany) offer advanced positioning, guidance, and automation technologies that enhance the performance of construction, mining, and agricultural machinery. These companies integrate GNSS, sensors, and real-time data processing to improve accuracy, safety, and operational efficiency.
Logos and trademarks shown above are the property of their respective owners. Their use here is for informational and illustrative purposes only.
MACHINE CONTROL SYSTEM MARKET SEGMENTS
Source: Secondary Research, Interviews with Experts, MarketsandMarkets Analysis
Machine Control System Market, By Type
The GNSS segment held the largest share in 2024, driven by its high accuracy and reliability in positioning for earthmoving and construction applications. GNSS supports grading, excavation, and surveying tasks, reducing rework and operational costs. Integration with advanced sensors and IoT platforms further enhances its role, solidifying GNSS as a critical technology in machine control systems.
Machine Control System Market, By End-use Equipment
Excavators accounted for a significant share in 2024, as machine control technologies enable precise digging, grading, and earthmoving operations. By reducing material wastage, improving operator efficiency, and minimizing project delays, excavators equipped with GNSS, sensors, and total stations are pivotal in enhancing productivity across large-scale infrastructure and construction projects.
Machine Control System Market, By Vertical
The infrastructure sector is projected to remain a key contributor, supported by government investments in roadways, railways, airports, and smart city projects. Machine control systems improve construction speed, accuracy, and cost-effectiveness, making them essential in large infrastructure developments. Rising demand for automated equipment in infrastructure projects continues to drive market growth in this vertical.
MACHINE CONTROL SYSTEM MARKET BY REGION
Asia Pacific to be the fastest-growing region in the global machine control system market during the forecast period
Asia Pacific is projected to be the fastest-growing market for machine control systems, fueled by rapid urbanization, infrastructure expansion, and smart city initiatives. Countries such as China, India, and Japan are witnessing strong adoption of GNSS, total stations, and laser scanners to enhance construction efficiency. Government investments and rising automation demand further reinforce the region's growth prospects.
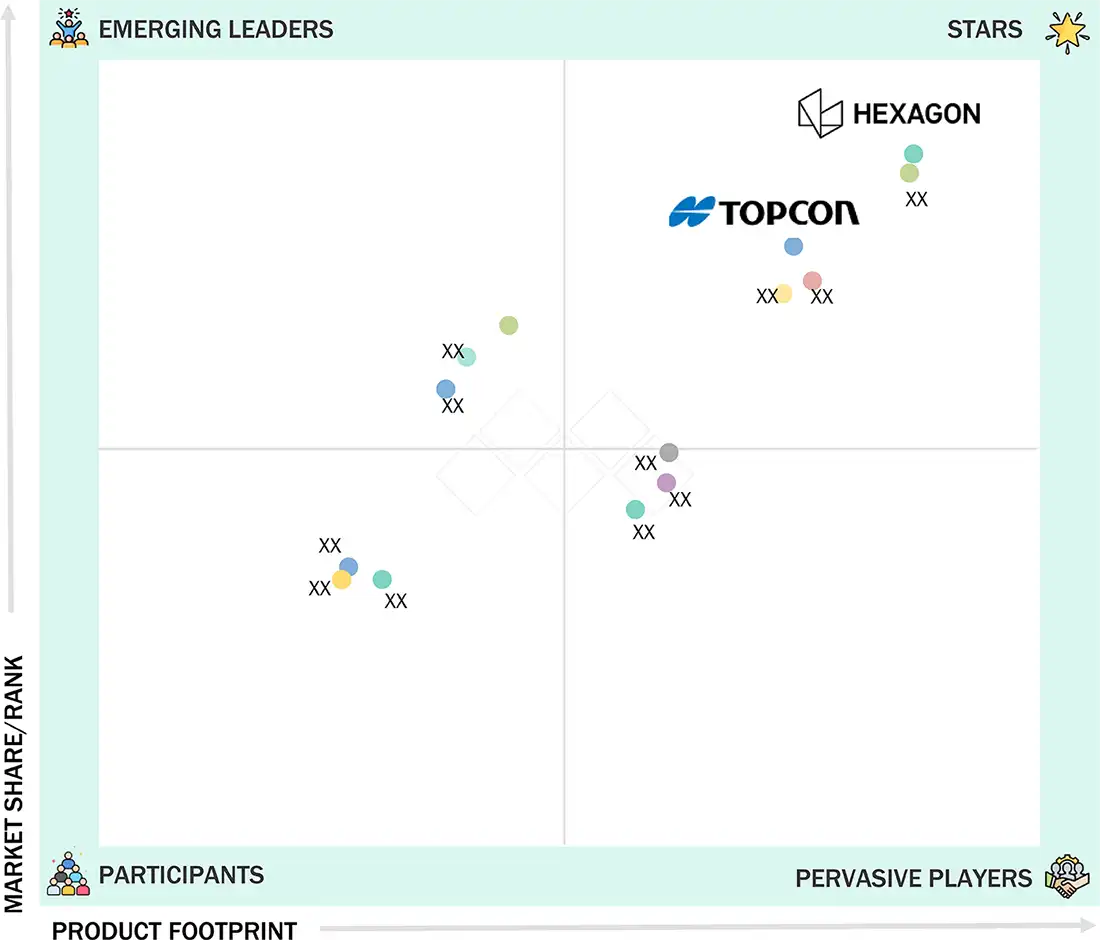
Machine Control System Market: COMPANY EVALUATION MATRIX
In the machine control system market matrix, Hexagon AB (Star) and Topcon Corporation (Star) hold strong positions as Star players with their broad product portfolios, global presence, and robust financial capabilities. Their continuous innovation and brand equity enable them to lead large-scale adoption of machine control solutions worldwide.
Source: Secondary Research, Interviews with Experts, MarketsandMarkets Analysis
KEY MARKET PLAYERS
WHAT IS IN IT FOR YOU: Machine Control System Market REPORT CONTENT GUIDE
DELIVERED CUSTOMIZATIONS
We have successfully delivered the following deep-dive customizations:
| CLIENT REQUEST | CUSTOMIZATION DELIVERED | VALUE ADDS |
|---|---|---|
| European Construction OEM |
|
|
| North American Heavy Equipment Rental Company | Evaluation of machine control deployment across loaders, paving systems, and scrapers- Quantified cost savings from productivity gains using GNSS-based automation - Vendor scoring model for advanced sensor integration |
|
| APAC Infrastructure Developer |
|
|
RECENT DEVELOPMENTS IN MACHINE CONTROL SYSTEM MARKET
- June 2025 : Leica Geosystems, part of Hexagon, launched the DS4000 utility detection system, which identifies underground assets up to 60% deeper using IDS GeoRadar's patented Equalised Scrambling Technology. It enhances visibility of both shallow and deep utilities, including smaller objects such as fiber optic cables.
- March 2025 : Trimble Inc. announced a collaboration with Xona Space Systems (US), a leader in satellite navigation. The companies aim to integrate Trimble correction services with Xona's PULSAR high-performance navigation network. This partnership will enable secure, high-precision positioning for global geospatial, IoT, and mass mobile applications.
- February 2025 : Topcon Corporation and FARO Technologies entered a strategic agreement to develop and distribute advanced laser scanning solutions jointly. The collaboration focuses on integrating Topcon's technologies with FARO's digital reality solutions, aiming to deliver seamless workflows and enhance customer value. This partnership is expected to drive innovation and broaden the product portfolios of both companies in the laser scanning and digital construction space.
- November 2024 : Trimble Inc. launched the Siteworks Machine Guidance Module for compact track loaders, expanding its all-in-one solution to support on-machine guidance and operator assistance. This is Trimble's first machine guidance solution designed specifically for compact track loader buckets.
- September 2024 : Topcon Positioning Systems, a subsidiary of Topcon Corporation, announced a strategic partnership with u-blox to develop one of the most extensive high-precision GNSS positioning service offerings for the mass market. The collaboration aims to deliver enhanced performance, competitive pricing, and flexible delivery options across global markets.
Table of Contents
 Exclusive indicates content/data unique to MarketsandMarkets and not available with any competitors.
Methodology
The research study involved four major steps in estimating the machine control system market size. Exhaustive secondary research has been done to collect important information about the market and peer markets. The next step has been to validate these findings and assumptions and size them with the help of primary research with industry experts across the value chain. Both top-down and bottom-up approaches have been used to estimate the market size. After this, the market breakdown and data triangulation approaches have been adopted to estimate the market sizes of segments and subsegments.
Secondary Research
Various secondary sources have been referred to in the secondary research process to identify and collect the information required for this study. These sources include annual reports, press releases, investor presentations of companies, white papers, and articles from recognized authors. Secondary research has mainly been done to obtain key information about the market’s value chain, the pool of key market players, market segmentation according to industry trends, regional outlook, and developments from market and technology perspectives.
In the machine control system market report, the global market size has been estimated using the top-down and bottom-up approaches, along with several other dependent submarkets. The major players in the market have been identified using extensive secondary research, and their presence in the market has been determined using secondary and primary research. All the percentage splits and breakdowns have been determined using secondary sources and verified through primary sources.
Primary Research
In the primary research process, several primary sources from the supply and demand sides have been interviewed to obtain qualitative and quantitative information pertaining to this report. Several primary interviews have been conducted with market experts from the demand (agriculture and construction companies) and supply sides (machine control system manufacturers and distributors). This primary data has been collected through questionnaires, emails, and telephonic interviews. Approximately 25% of the primary interviews have been conducted with the demand-side respondents and 75% with the supply-side respondents. This primary data has been collected mainly through telephonic interviews, which accounted for 80% of the total primary interviews.
After successful interaction with industry experts, brief sessions have been conducted with highly experienced independent consultants to reinforce the findings of our primary research. This, along with the in-house subject-matter experts’ opinions, led us to the findings described in the report. The breakdown of primary respondents is as follows:

Note: Other designations include machine control system consultants and industry experts
The three tiers of the companies have been defined based on their total revenue as of 2024: tier 1 = >USD 10 billion, tier 2 = USD 1–10 billion, and tier 3 = USD 1 billion.
RoW comprises the Middle East, Africa, and South America.
To know about the assumptions considered for the study, download the pdf brochure
Market Size Estimation
In the complete market engineering process, top-down and bottom-up approaches and several data triangulation methods have been used to estimate and forecast the overall market segments and subsegments listed in this report. The key players in the market have been identified through secondary research, and their market shares in the respective regions have been determined through primary and secondary research. This entire procedure includes the study of the annual and financial reports of the top market players and extensive interviews for key insights (quantitative and qualitative) with industry experts (CEOs, VPs, directors, and marketing executives).
All percentage shares, splits, and breakdowns have been determined using secondary sources and verified through primary sources. All the parameters affecting the markets covered in this research study have been accounted for, viewed in detail, verified through primary research, and analyzed to obtain the final quantitative and qualitative data. This data has been consolidated and supplemented with detailed inputs and analysis from MarketsandMarkets and presented in this report.
Bottom-Up Approach
- The bottom-up approach has been used to arrive at the overall size of the machine control system market.
- The machine control system market size, by volume, has been derived by identifying the country-wise usage of different machine control systems through the shipment volume of these systems.
- The shipment volume obtained has been further categorized according to the specific number of construction equipment used in the construction projects across industries.
- The number of machine control systems sold in each country has been added to derive the regional market size, in terms of volume.
- The market size, by value, has been derived by multiplying the average selling price of machine control systems by the number of units sold (volume).
- The country-level data has been added to obtain the total size, in terms of value, of the market in that region.
Top-Down Approach
- In the top-down approach, the overall market size has been used to estimate the size of the individual markets (mentioned in the market segmentation) through percentage splits from secondary and primary research.
- The most appropriate parent market size has been used to implement the top-down approach to calculate specific market segments.
- The companies have been mapped by type, equipment, and regional and vertical-wise offerings.
- Each company’s market share has been estimated to verify the respective revenue share in the machine control system market.
- The total market size obtained from company revenue analysis has been split between segments based on mapping data.
- With the data triangulation procedure and validation of the data through primaries, the overall parent market size and each individual market size have been determined and confirmed in this study.
Semiconductor Cleanroom Market: Top-Down and Bottom-Up Approach

Data Triangulation
After arriving at the overall market size from the estimation process explained above, the overall market has been split into several segments and subsegments. The data triangulation procedure has been employed wherever applicable to complete the overall market engineering process and arrive at the exact statistics for all segments and subsegments. The data has been triangulated by studying various factors and trends from both the demand and supply sides. Additionally, the market size has been validated using top-down and bottom-up approaches.
Market Definition
Machine control systems are deployed to position earthwork machinery precisely based on the design model. Machine control enables the integration of positioning tools into construction machinery. A machine control system not only guides operators in excavating, grading, dredging, or piling activities but also improves productivity by 30–50% compared to conventional digging operations. Machine control systems include global navigation satellite systems (GNSS), laser scanners, total stations, and sensors. These systems are highly user-friendly, fully upgradable, and flexible enough to meet various job site requirements across multiple verticals, such as residential, infrastructure, commercial, and industrial. The scope of this report is limited to the earthwork or construction work that takes place at the initial stage of the construction of a plant or factory of any industry.
Key Stakeholders
- Government and research organizations
- End users of information and enabling technology
- Providers of information and enabling technology
- Research organizations and consulting companies
- Technology investors
- Technology standard organizations, forums, alliances, and associations
- System integrators
- Analysts and strategic business planners
- Venture capitalists, private equity firms, and startup companies
Report Objectives
- To describe and forecast the machine control system market, by type, end-use equipment, and vertical, in terms of value
- To describe and forecast the market size across four main regions, namely, North America, Europe, Asia Pacific, and Rest of the World, in terms of value
- To provide detailed information regarding the major drivers, restraints, opportunities, and challenges influencing the growth of the market
- To understand and analyze the impact of evolving technologies on the machine control system value chain
- To provide a detailed overview of the value chain of the machine control system market
- To strategically analyze micromarkets1 with respect to individual growth trends, prospects, and contributions to the total market
- To strategically profile the key players and comprehensively analyze their market positions in terms of ranking and core competencies
- To analyze competitive developments, such as product launches, acquisitions, collaborations, agreements, and partnerships, in the machine control system market
- To provide ecosystem analysis, case study analysis, patent analysis, technology analysis, impact of AI/Gen AI, and 2025 US tariff on the machine control system market, key conferences and events, Porter’s five forces analysis, and regulations pertaining to the market under study
- To provide a macroeconomic outlook for all the regions in the region chapter
Available customizations:
With the given market data, MarketsandMarkets offers customizations according to the specific requirements of companies. The following customization options are available for the report:
- Detailed analysis and profiling of additional market players based on various blocks of the supply chain
Key Questions Addressed by the Report
What is the size of the Machine Control System Market?
The global Machine Control System Market is expected to reach USD 8.93 Billion by 2030, driven by increasing automation adoption, construction digitization, and demand for precise earthwork operations.
What is the expected growth rate of the Machine Control System Market?
The Machine Control System Market is projected to grow at a CAGR of around 8.2%. during the forecast period, supported by smart construction technologies and infrastructure development.
What are the major growth drivers of the Machine Control System Market?
Major growth drivers include the need to optimize earthwork operations, adoption of GNSS and sensor technologies, reduction in surveying costs, improved productivity, and demand for safer construction practices.
How does machine control technology improve earthwork operations?
Machine control systems replace manual surveying methods with digital design references, providing operators with real-time horizontal and vertical site data, improving grading accuracy and reducing rework.
What are the key trends shaping the Machine Control System Market?
Key trends include integration of AI, IoT, GNSS technology, 3D machine control, cloud-based construction solutions, and automation of heavy equipment.
Which industries are adopting machine control systems?
Machine control systems are widely used in construction, mining, agriculture, infrastructure development, road construction, and land surveying industries.
Which companies are major players in the Machine Control System Market?
Key companies include Trimble Inc., Topcon Corporation, Hexagon AB, MOBA Mobile Automation AG, Leica Geosystems, and Caterpillar Inc.
Which region is expected to dominate the Machine Control System Market?
North America is expected to hold a significant market share due to high adoption of advanced construction technologies, while Asia Pacific is growing due to infrastructure investments.
What are the main components of machine control systems?
Machine control systems include GNSS receivers, sensors, control boxes, displays, software, machine-mounted components, and communication technologies for accurate equipment guidance.
What does the Machine Control System Market report analyze?
The report covers market size, growth forecast, technology trends, equipment types, applications, industry analysis, competitive landscape, and regional insights across global markets.
Need a Tailored Report?
Customize this report to your needs
Get 10% FREE Customization
Customize This ReportPersonalize This Research
- Triangulate with your Own Data
- Get Data as per your Format and Definition
- Gain a Deeper Dive on a Specific Application, Geography, Customer or Competitor
- Any level of Personalization
Let Us Help You
- What are the Known and Unknown Adjacencies Impacting the Machine Control System Market
- What will your New Revenue Sources be?
- Who will be your Top Customer; what will make them switch?
- Defend your Market Share or Win Competitors
- Get a Scorecard for Target Partners

Custom Market Research Services
We Will Customise The Research For You, In Case The Report Listed Above Does Not Meet With Your Requirements
Get 10% Free CustomisationTESTIMONIALS

Tetsuya Ohhira
Business Development Manager-Technology Business
Nikon Corporation,
Leading Japanese MNC specializing in optics and imaging productswww.nikon.com
MarketsandMarkets™ response
is quick. Their attitude is flexible and positive. Analyst Insights are globally considered and
significant. Client Services quickly respond to our inquiry and demand. Their wide range of global
surveys help us make our strategic plan.
We hope Knowledge Store will be easier to search
for a report.
VP - Marketing & Business Development
Leading Provider of Process Control Solutions
We engaged with MarketsandMarkets on a study to perform an analysis and recommend a Go-To-Market strategy for metrology and process control in the semiconductor market. The study was tailored to our targets and needs with well-defined milestones. Our overall experience with the MarketsandMarkets team was very good throughout the project in all aspects including the analysis methodologies used, the quality and depth of primary and secondary data sets, the professionalism and flexibility of the team and the ability to meet the target schedule and milestones. We want to thank MarketsandMarkets team for a job well done.
Growth opportunities and latent adjacency in Machine Control System Market


Richard
Apr, 2026
I�m considering buying this report�will it clearly show the ROI and payback period for investing in machine control systems across different construction use cases?.
William
Apr, 2026
I�m particularly interested in investment opportunities ,does the report identify the fastest-growing regions and segments where I can expect the best returns through 2030.