
Machine Safety Market Size, Share and Growth Analysis

Machine Safety Market by Component (Safety Light Curtains, Laser Scanners, Safety Controllers/Modules/Relays, Programmable Safety Systems, Safety Interlock Switches, Push Buttons, Pull Rope Buttons, Two-Hand Safety Controls) - Global Forecast to 2030


MACHINE SAFETY MARKET OVERVIEW
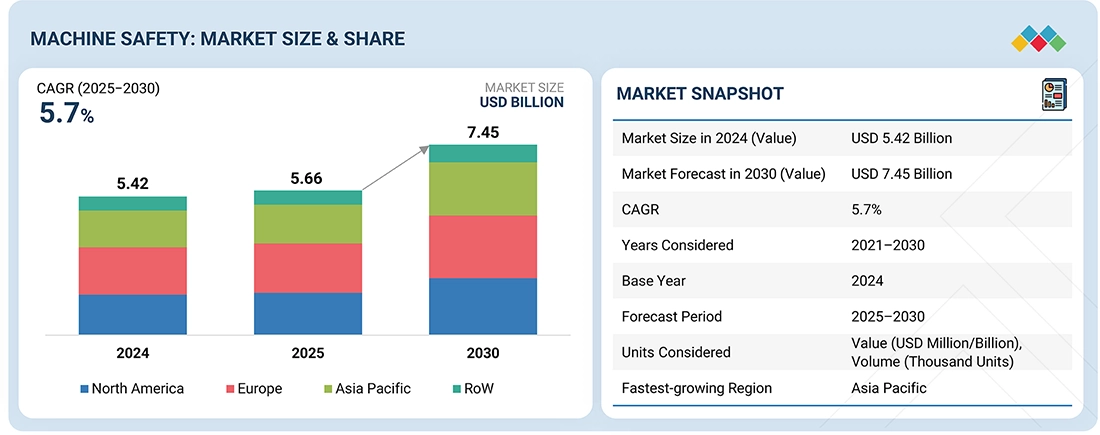
The machine safety market size is projected to reach USD 7.45 billion by 2030 from USD 5.66 billion in 2025, at a CAGR of 5.7%. The machine safety market is growing due to the adoption of automation and Industry 4.0 technologies, which increase machinery complexity and workplace risks. Strict global regulations are driving compliance in high-risk industries, while the focus on predictive analytics and IoT-enabled solutions is further boosting market growth.
The Machine Safety industry is expanding rapidly as organizations across manufacturing, automotive, packaging, and food processing sectors focus on protecting workers and ensuring regulatory compliance. Increasing automation and the adoption of smart manufacturing technologies are contributing significantly to the growth of the Machine Safety market size worldwide. As companies upgrade production facilities with advanced safety solutions such as safety controllers, light curtains, safety sensors, and emergency stop devices, the Machine Safety market share of leading providers continues to grow. Furthermore, strict workplace safety regulations and international standards are encouraging businesses to implement modern safety systems, which is further supporting the expansion of the Machine Safety industry.
Several emerging Machine Safety market trends are shaping the future of the sector. The integration of Industry 4.0 technologies, including IoT-enabled safety devices and real-time monitoring systems, is transforming how organizations approach machine protection and worker safety. These innovations are expected to positively influence the Machine Safety market size as industries increasingly adopt connected safety solutions. In addition, growing awareness about accident prevention and operational efficiency is driving companies to invest in advanced safety technologies, helping major players strengthen their Machine Safety market share. With continuous technological advancements and increased automation across industries, the Machine Safety industry is expected to witness sustained growth in the coming years.
Market Size & Forecast
• 2025 Market Size: USD 5.66 Billion
• 2030 Projected Market Size: USD 7.45 Billion
• CAGR (2025-2030): 5.7%
• Wireless Segment: Highest CAGR
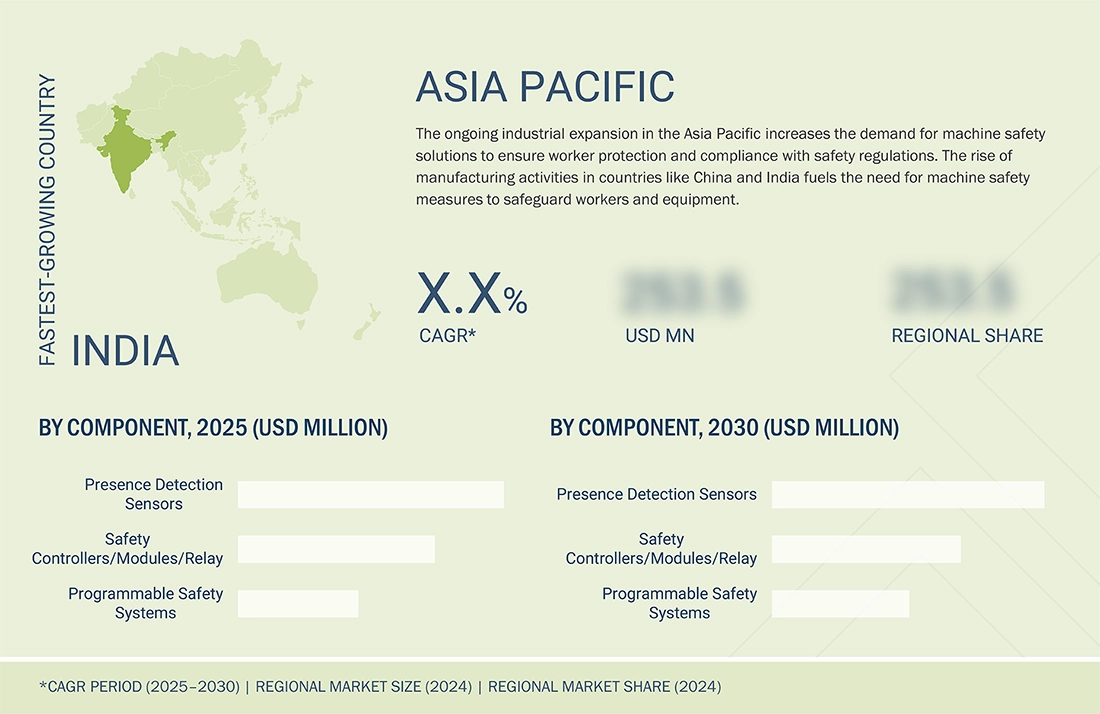
• Asia Pacific: Fastest-growing Market
MACHINE SAFETY MARKET KEY TAKEAWAYS
-
BY OFFERINGSystems account for the largest market share due to their comprehensive integration of multiple components (sensors, controllers, PLCs) into scalable, SIL-compliant solutions that ensure end-to-end safety and regulatory compliance across complex industrial processes.
-
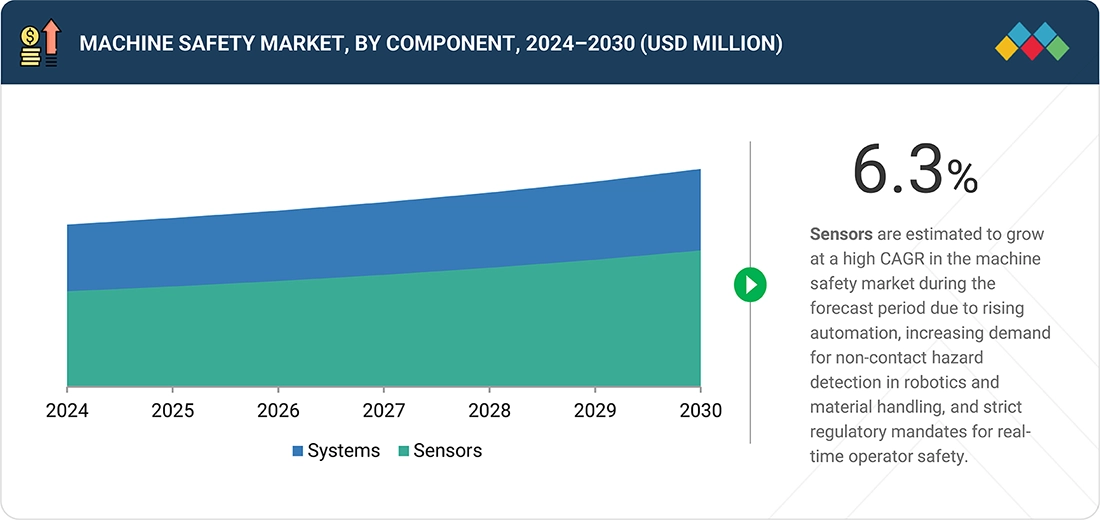
BY COMPONENTPresence detection sensors are set to form the largest component segment due to their essential role in real-time hazard monitoring across diverse applications like robotics and assembly, ensuring immediate machine shutdowns to prevent accidents and comply with safety standards.
-
BY IMPLEMENTATIONIndividual implementation of machine safety is estimated to account for a larger share due to widespread use in retrofitting legacy machinery and cost-effective deployment in SMEs, offering flexibility despite the growing adoption of embedded systems.
-
BY CONNECTIVITYThe wireless segment is projected to grow at a high CAGR due to increasing demand for flexible, reconfigurable automation in robotics and mobile machinery, along with IIoT-driven real-time monitoring in dynamic industrial environments.
-
BY APPLICATIONThe robotics segment is estimated to grow faster due to the rapid rise in human-robot collaboration and Industry 4.0 adoption, requiring advanced safety systems like laser scanners and AI-integrated controls to ensure safe, dynamic interactions in manufacturing.
-
BY INDUSTRYThe process industry segment is estimated to record a high CAGR due to stringent safety regulations in high-risk sectors like oil & gas and pharmaceuticals, coupled with rising automation and SIL-compliant system adoption for continuous operations.
-
BY REGIONThe machine safety market trends covers Europe, North America, Asia Pacific, and RoW. Among these regions, Asia Pacific is projected to grow at the highest rate due to due to rapid industrial expansion and surging manufacturing activities in countries like China and India, driving demand for advanced safety solutions to protect workers, ensure equipment reliability, and comply with evolving safety regulations.
-
COMPETITIVE LANDSCAPEMajor market players have adopted both organic and inorganic strategies, including partnerships and investments. Siemens (Germany), Schneider Electric (France), KEYENCE CORPORATION (Japan), Rockwell Automation (US), and Emerson Electric Co. (US) have entered into a number of agreements and partnerships to cater to the growing demand for machine safety across innovative applications.
The machine safety industry is rising due to the rapid adoption of automation and Industry 4.0 technologies, which increase machinery complexity and workplace risks, driving demand for advanced systems like safety PLCs and presence detection sensors. Stringent global regulations (e.g., IEC 61508, ISO 13849) mandate compliance in high-risk industries such as oil & gas, pharmaceuticals, and automotive, further accelerating investments. Additionally, the focus on predictive analytics, worker safety, and reducing downtime through IoT-enabled solutions is propelling market growth across regions, especially in Asia Pacific.
Source: Secondary Research, Interviews with Experts, MarketsandMarkets Analysis
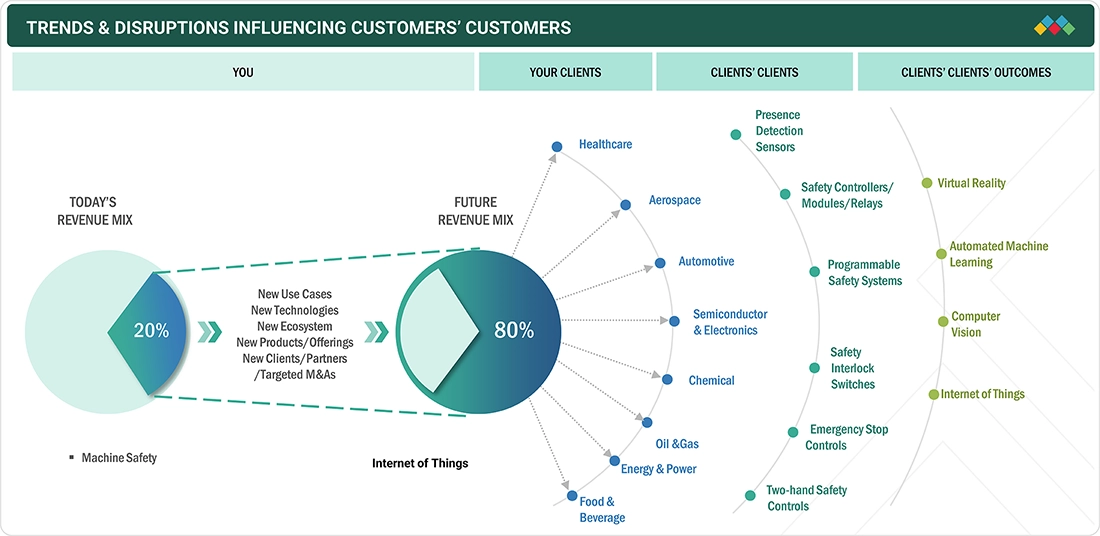
TRENDS & DISRUPTIONS IMPACTING CUSTOMERS' CUSTOMERS
The industry-wide focus on personnel and asset protection, driven by the enforcement of increasingly stringent machinery safety regulations, is rapidly expanding the market for sophisticated machine safety solutions. This trend is coupled with the rising adoption of intelligent, networked technologies, including the Industrial Internet of Things (IIoT), computer vision, and programmable safety systems. These advancements enable predictive maintenance and improved performance monitoring of industrial assets, creating new demand for digitally connected safety products. These developments are compelling end-user industries (such as Automotive, Healthcare, and Power) to move beyond traditional, reactive safety measures toward holistic, smart safety systems. This shift is projected to create new and sustained revenue streams for machine safety hardware providers during the forecast period.
Source: Secondary Research, Interviews with Experts, MarketsandMarkets Analysis
MARKET DYNAMICS
Level
-
Mandatory safety standards for equipment and machinery

-
Automation to drive efficiency and productivity gains

Level
-
High costs associated with of automated machine safety system implementation

-
Complexity of machine safety system integration

Level
-
Rising workplace safety awareness in emerging economies

-
Growing adoption of IIoT to optimize industrial asset performance and lifespan

Level
-
Technological advancements complicate machine safety product design

-
Failing to assess potential risks in machine configuration

Source: Secondary Research, Interviews with Experts, MarketsandMarkets Analysis
Driver: Mandatory safety standards for equipment and machinery
Stringent safety regulations from governments and organizations like OSHA, IEC, ISO, and ANSI are driving machine safety market growth by mandating certified equipment such as explosion-proof sensors, safety interlocks, and light curtains in hazardous areas. In the US and Europe, proactive measures like OSHA standards and EU Machinery Directives enforce compliance to prevent workplace accidents. These regulations enhance industrial process efficiency and worker protection. Overall, regulatory enforcement creates sustained demand for advanced safety solutions.
Restraint: High costs associated with of automated machine safety system implementation
Machine safety systems are essential for protecting employees, machines, and production lines during emergencies, but their high installation, maintenance, and repair costs create a significant budget burden. Large organizations can absorb these expenses, while SMEs struggle, limiting adoption. Frequent updates to regulatory standards (e.g., IEC 61508) force costly system upgrades, and safety investments are often excluded from initial plant budgets. These financial challenges restrain overall market growth.
Opportunity: Growing adoption of IIoT to optimize industrial asset performance and lifespan
The Industrial Internet of Things (IIoT) enables real-time monitoring of industrial assets, supporting predictive maintenance, reducing downtime, and extending equipment lifespan. It enhances workplace safety by detecting hazards early through sensor data transmitted via wired or wireless networks for instant analysis and alerts. IIoT integrates safety systems with operational processes, enabling rapid response and compliance. Overall, it drives efficiency, safety, and performance in industrial environments.
Challenge: Technological advancements complicate machine safety product design
Advanced machines with complex systems and software complicate the integration of safety features, challenging uniform standards across industries and regions. Continuous technological evolution demands ongoing R&D, innovation, and collaboration between manufacturers and regulators. This ensures safe design and operation of modern equipment, protecting workers and preventing accidents.
Machine Safety Market: COMMERCIAL USE CASES ACROSS INDUSTRIES
| COMPANY | USE CASE DESCRIPTION | BENEFITS |
|---|---|---|
 |
Safety PLCs and interlock switches for robotic assembly lines and hazardous zone control in automotive manufacturing | Ensures SIL 3 compliance, real-time diagnostics via IIoT, and seamless integration with automation systems for enhanced worker protection and uptime |
 |
Modular safety relays and emergency stop systems for material handling and packaging machinery in food & beverage plants | Provides scalable, fail-safe responses, reducing downtime and ensuring regulatory adherence with easy retrofitting for cost-effective safety |
 |
Vision-based presence detection sensors and light curtains for metalworking and welding processes in electronics assembly | Delivers high-precision hazard detection, minimizing false alarms and enabling predictive maintenance for precise, efficient operations |
 |
GuardLogix safety controllers for human-robot collaboration and emergency shutdowns in aerospace production lines | Offers integrated redundancy and diagnostics, supporting Industry 40 connectivity to boost productivity while maintaining high safety integrity levels |
 |
PACSystems safety modules for process control and burner management in oil & gas facilities | Facilitates cybersecurity-protected, scalable SIL 2 solutions with real-time monitoring, extending asset life and preventing hazardous failures |
Logos and trademarks shown above are the property of their respective owners. Their use here is for informational and illustrative purposes only.
MACHINE SAFETY MARKET ECOSYSTEM
The machine safety ecosystem is structured across three tiers: component providers, who supply core safety devices like sensors, relays, and interlocks; system integrators who embed these components into programmable safety systems and PLCs for seamless industrial integration; and end users who deploy these solutions in high-risk environments such as automotive assembly and food processing. This layered model ensures compliance with standards like IEC 61508 while enabling scalability and predictive safety. Component providers dominate innovation, system integrators bridge technology with application, and end users drive demand through operational needs and regulatory adherence.
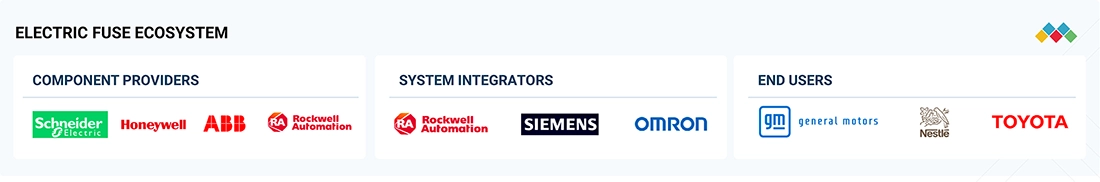
Logos and trademarks shown above are the property of their respective owners. Their use here is for informational and illustrative purposes only.
MACHINE SAFETY MARKET SEGMENTS
Source: Secondary Research, Interviews with Experts, MarketsandMarkets Analysis
Machine Safety Market, by Offering
Systems are estimated to account for the largest machine safety market share, primarily because these solutions form the backbone of industrial safety protocols. By integrating both hardware and software, they facilitate the comprehensive monitoring, control, and risk mitigation necessary in today’s complex manufacturing environments. The rising adoption of these systems can be attributed to their ability to seamlessly interface with programmable logic controllers (PLCs), safety relays, and various control networks, which enhances operational efficiency and safety. As manufacturing processes continue to grow in complexity, the need for robust systems that ensure workers' safety and compliance with regulatory standards becomes increasingly vital, driving further investment and integration of advanced safety solutions across diverse industries.
Machine Safety Market, by Component
Presence detection sensors have become essential in various industries, significantly enhancing safety protocols by enabling real-time monitoring of operator movement in hazardous zones. These advanced sensors are integral to applications in robotics, packaging, and assembly, where they not only help in preventing accidents but also optimize operational efficiency. By instantly detecting the presence of personnel, they facilitate a safer working environment, allowing for quick responses to potential dangers, which in turn fosters greater confidence among workers. This technology also contributes to productivity by ensuring that safety measures do not impede workflow, thus striking a balance between maintaining high operational standards and prioritizing employee well-being.
Machine Safety Market, by Implementation
The individual implementation segment plays a pivotal role in the machine safety market due to its versatile deployment options, which effectively cater to both legacy systems and standalone machinery. This adaptability makes it especially appealing to small and medium enterprises, as it provides a cost-effective solution that does not necessitate extensive modifications to existing equipment. Many businesses appreciate the straightforward installation process, which allows them to enhance safety protocols without the burden of significant redesign efforts or high capital expenditure. This has emerged as a preferred choice for companies seeking immediate improvements in workplace safety while maintaining operational efficiency.
Machine Safety Market, by Connectivity
Wired safety systems lead the market due to their reliability and robust performance, particularly in industries that prioritize safety and efficiency. These systems provide secure signal transmission, reducing the risk of interference that can compromise critical operations, making them ideal for high-load manufacturing environments. Their ability to maintain stable and continuous communication ensures that machinery operates smoothly and responds promptly to any safety triggers or emergencies. The durability of wired connections in harsh industrial settings adds to their appeal, reinforcing their status as the preferred choice for organizations committed to maintaining high safety standards and optimizing productivity.
Machine Safety Market, by Application
Assembly applications are essential in sectors like automotive and electronics, where operators work with automated systems to boost production efficiency. Safety mechanisms such as light curtains, interlocks, and emergency stops are vital for protecting workers and ensuring a safe environment. These measures not only prevent accidents but also reduce downtime from machinery issues. As demand in these industries rises, enhancing safety and productivity through advanced assembly applications becomes increasingly important, leading to innovation and investment in adaptable safety technologies.
Machine Safety Market, by Industry
The process industry segment is prominent due to the stringent safety regulations in sectors like oil and gas, chemicals, and pharmaceuticals, which are inherently risky. These industries utilize advanced technologies for continuous monitoring and fail-safe controls that intervene during abnormal conditions. Automatic shutdown systems play a vital role in quickly halting operations during emergencies, minimizing hazards and ensuring uninterrupted, safe operations. Consequently, compliance with safety regulations not only protects lives and the environment but also enhances operational efficiency across these critical sectors.
MACHINE SAFETY MARKET BY REGION
Asia Pacific to be fastest-growing region in global machine safety market during forecast period
The Asia Pacific (APAC) region is projected to grow at the highest CAGR in the machine safety market, driven by rapid industrialization and the expansion of manufacturing hubs in countries such as China, India, and South Korea. This surge is fueled by increasing adoption of automation and Industry 4.0 technologies, which heighten the need for advanced safety solutions to protect workers amid complex machinery deployments. Additionally, the region's economic dynamism, including FDI inflows and a growing focus on sectors like automotive and electronics, creates substantial opportunities for scalable, cost-effective safety innovations. These factors enable Asia Pacific to outpace mature markets like North America and Europe in machine safety adoption.
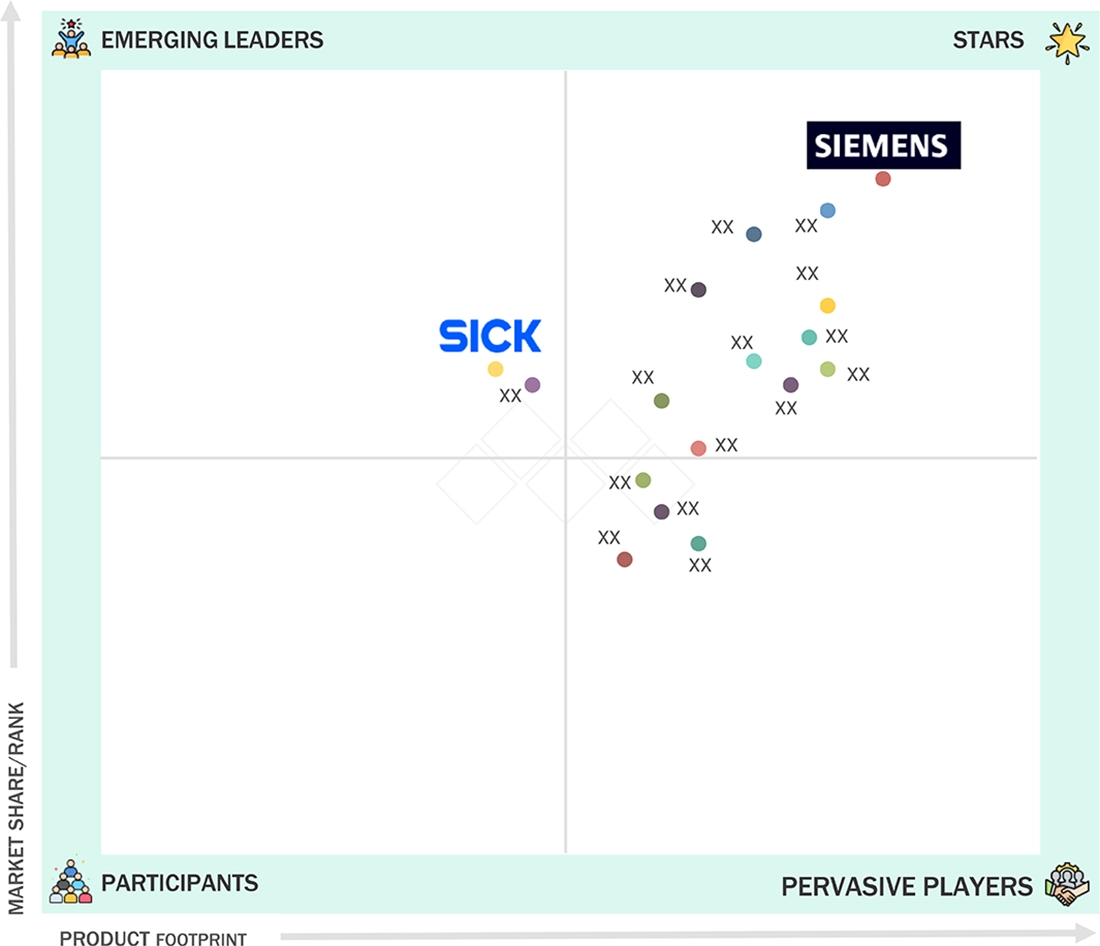
Machine Safety Market: COMPANY EVALUATION MATRIX
In the machine safety companies matrix, Siemens (Star) leads with a commanding market share, providing seamless compliance with global standards and robust diagnostics for high-risk industries such as automotive and oil & gas. SICK AG falls under the emerging leader category, driven by its innovative presence-sensing technologies, including AI-enhanced laser scanners and safety light curtains that enable real-time hazard detection in dynamic environments like robotics and material handling.
Source: Secondary Research, Interviews with Experts, MarketsandMarkets Analysis
MACHINE SAFETY MARKET KEY PLAYERS
MACHINE SAFETY MARKET SCOPE
| REPORT METRIC | DETAILS |
|---|---|
| Market Size, 2024 (Value) | USD 5.42 Billion |
| Market Forecast, 2030 (Value) | USD 7.45 Billion |
| Growth Rate | CAGR of 5.7% from 2025 to 2030 |
| Years Considered | 2021–2030 |
| Base Year | 2024 |
| Forecast Period | 2025–2030 |
| Units Considered | Value (USD Million/Billion), Volume (Thousand Units) |
| Report Coverage | Revenue Forecast, Company Ranking, Competitive Landscape, Growth Factors, and Trends |
| Segments Covered |
|
| Regions Covered | North America, Asia Pacific, Europe, RoW |
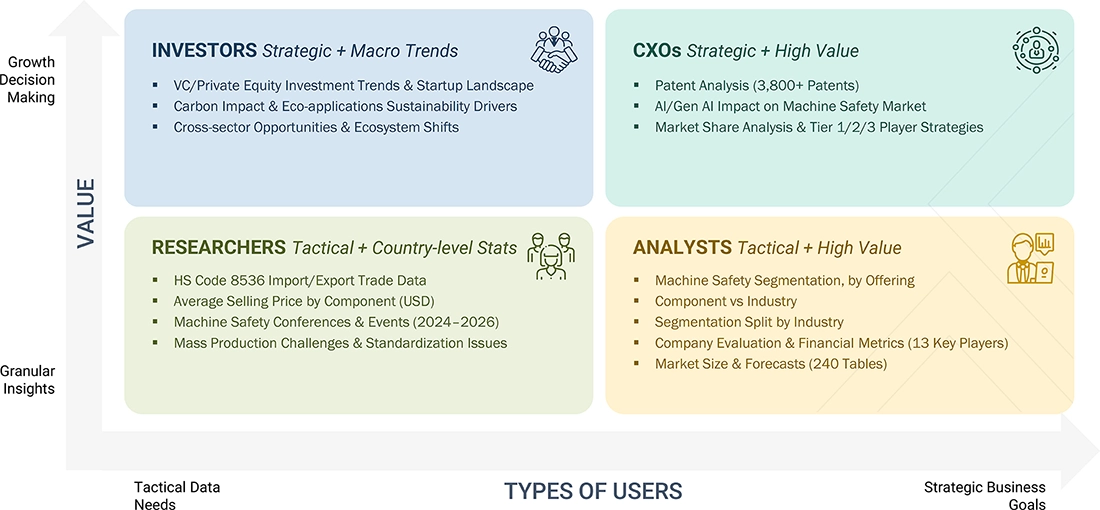
WHAT IS IN IT FOR YOU: Machine Safety Market REPORT CONTENT GUIDE
DELIVERED CUSTOMIZATIONS
We have successfully delivered the following deep-dive customizations:
| CLIENT REQUEST | CUSTOMIZATION DELIVERED | VALUE ADDS |
|---|---|---|
| European Automotive OEM |
|
|
| North American Industrial Automation Supplier |
|
|
| Asia Pacific Electronics Manufacturing Firm |
|
|
| Middle East Oil & Gas EPC Contractor |
|
|
RECENT DEVELOPMENTS
- June 2025 : KEYENCE CORPORATION recently introduced the GL-V series, a new small and robust safety light curtain designed for industrial applications. The announcement highlighted improvements in safety standards while preserving compactness and durability for varied manufacturing environments.
- June 2025 : Yokogawa Electric Corporation launched CENTUM VP Release 7.01, its 10th-generation distributed control system, on its 50th anniversary, introducing enhanced cybersecurity, OPC UA connectivity, and AI-driven autonomous operations. Targeting industries like oil & gas, it boosted efficiency and reliability under Yokogawa's OpreX brand for sustainable automation.
- September 2024 : Rockwell Automation launched Logix SIS, a next-generation safety instrumented system offering both SIL 2 and SIL 3 certifications for process and hybrid safety applications. The system integrated safety logic, I/O, and control on familiar Rockwell hardware (1756 controller, FLEX 5000 I/O), aiming for high availability, reduced engineering complexity, and seamless upgrades without downtime.
- COLUMN 'A' SHOULD BE IN TEXT FORMAT AND NOT DATE FORMAT :
Table of Contents
 Exclusive indicates content/data unique to MarketsandMarkets and not available with any competitors.
Methodology
The study involved four major activities in estimating the current size of the machine safety market. Exhaustive secondary research was conducted to gather information on the market, adjacent markets, and the overall machine safety landscape. These findings, along with assumptions and projections, were validated through primary research involving interviews with industry experts and key stakeholders across the value chain. Both top-down and bottom-up approaches were utilized to estimate the overall market size. Subsequently, market breakdown and data triangulation techniques were applied to determine the sizes of various segments and subsegments. Two key sources, secondary and primary, were leveraged to conduct a comprehensive technical and commercial assessment of the machine safety market.
Secondary Research
The secondary research process referred to various secondary sources to identify and collect necessary information for this study. The secondary sources included annual reports, press releases, and investor presentations of companies; white papers; journals and certified publications; and articles from recognized authors, websites, directories, and databases. Secondary research was conducted to obtain key information about the industry’s supply chain, the market’s value chain, the total pool of key players, market segmentation according to the industry trends (to the bottom-most level), regional markets, and key developments from market- and technology-oriented perspectives. The secondary data was collected and analyzed to determine the overall market size, which is further validated through primary research.
Primary Research
Extensive primary research was conducted after gaining knowledge about the current scenario of the machine safety market through secondary research. Several primary interviews were conducted with experts from the demand and supply sides across four major regions—North America, Europe, Asia Pacific, and RoW. This primary data was collected through questionnaires, emails, and telephonic interviews.

Note: Three tiers of companies have been defined based on their total revenue as of 2024; Tier 1: Greater than USD 100 million, Tier 2: USD 50 million–100 million, and Tier 3: Less than USD 50 million. Other designations include sales managers, marketing managers, and product managers.
To know about the assumptions considered for the study, download the pdf brochure
Market Size Estimation
Both top-down and bottom-up approaches were used to estimate and validate the total size of the machine safety market. These methods have also been used extensively to estimate the size of various subsegments in the market. The following research methodology was used to estimate the market size:
- Major players in the markets were identified through extensive secondary research.
- The industry’s value chain and market size (in terms of value) were determined through primary and secondary research processes.
- All percentage shares, splits, and breakdowns were determined using secondary sources and verified through primary sources.
Machine Safety Market : Top-Down and Bottom-Up Approach

Data Triangulation
After arriving at the overall size of the machine safety market using the market size estimation process explained above, the total market was split into several segments and subsegments. Data triangulation procedures were employed, wherever applicable, to complete the overall market engineering process and arrive at the exact statistics for all segments and subsegments of the market. The data was triangulated by studying various factors and trends from both the demand and supply sides. The market size was also validated using both the top-down and bottom-up approaches.
Market Definition
Machine safety systems are crucial for ensuring the safety of operators and other personnel working with or near machines. These systems encompass various components such as physical guards, safety interlocks, emergency stops, and warning signs to minimize the risk of injury or harm. The primary objective of a machine safety system is to prevent accidents and injuries by reducing or eliminating potential hazards associated with operating machines. This includes ensuring all components are correctly installed and maintained, workers are adequately trained and informed about potential hazards, and appropriate safety procedures are followed. Besides safeguarding workers, machine safety systems can help minimize downtime and reduce the risk of equipment damage or failure. By implementing appropriate safety measures, businesses can improve their overall productivity and profitability while ensuring the safety of their employees.
Key Stakeholders
- Government bodies, venture capitalists, and private equity firms
- Machine safety manufacturers
- Machine safety distributors
- Machine safety industry associations
- Professional service/solution providers
- Research institutions and organizations
- Standards organizations and regulatory authorities related to the machine safety market
- System integrators
- Technology consultants
- End users
Report Objectives
- To define, describe, and forecast the machine safety market, in terms of offering, component, implementation, connectivity, application, industry, and region, in terms of value
- To describe and forecast the market, in terms of value, with regard to four main regions: North America, Europe, Asia Pacific, and Rest of the World (RoW), along with their respective countries
- To provide detailed information regarding major factors such as drivers, restraints, opportunities, and challenges influencing the market growth
- To provide a detailed overview of the machine safety value chain
- To strategically analyze micromarkets with respect to individual growth trends, prospects, and contributions to the machine safety market
- To analyze opportunities in the market for stakeholders by identifying high-growth segments of the machine safety market
- To strategically profile key players and comprehensively analyze their market position in terms of ranking and core competencies, along with detailing the competitive landscape for market leaders
- To analyze competitive strategies, such as product launches, expansions, and mergers & acquisitions, adopted by key players in the machine safety market
Available Customizations:
With the given market data, MarketsandMarkets offers customizations according to the company’s specific needs. The following customization options are available for the report:
Company Information
- Detailed analysis and profiling of additional market players (up to five)
Key Questions Addressed by the Report
What is the Machine Safety Market?
The Machine Safety Market refers to the industry focused on technologies, systems, and solutions designed to protect workers and equipment from hazards in industrial environments. It includes safety sensors, switches, relays, controllers, and other protective devices used in manufacturing and automation.
What is the current Machine Safety Market size?
The Machine Safety Market size is expanding steadily due to increasing industrial automation and stricter safety regulations across industries such as manufacturing, automotive, food processing, and pharmaceuticals.
What factors are driving Machine Safety Market growth?
Key drivers of Machine Safety Market growth include rising workplace safety awareness, strict government regulations, increasing adoption of industrial automation, and the need to reduce workplace accidents.
What are the major Machine Safety Market trends?
Major Machine Safety Market trends include the integration of safety systems with Industry 4.0 technologies, adoption of smart sensors, increased use of robotics safety solutions, and growth of predictive maintenance systems.
Which industries contribute most to the Machine Safety Industry?
Industries such as automotive, semiconductor, food & beverage, pharmaceuticals, and heavy manufacturing are major contributors to the Machine Safety Industry due to their high automation levels and strict safety requirements.
What is the expected Machine Safety Market growth in the coming years?
The Machine Safety Market is expected to witness significant growth in the coming years as industries invest more in automation, worker protection technologies, and advanced safety monitoring systems.
Who are the key players in the Machine Safety Industry?
Key players in the Machine Safety Industry include companies such as Siemens, Rockwell Automation, Schneider Electric, ABB, Honeywell, and Omron, which provide a wide range of industrial safety solutions.
What technologies are commonly used in Machine Safety systems?
Common technologies used in Machine Safety systems include safety sensors, light curtains, safety PLCs, emergency stop devices, interlock switches, and presence sensing systems.
How do regulations impact the Machine Safety Market share?
Government regulations and international safety standards such as ISO, IEC, and OSHA significantly influence Machine Safety Market share by pushing industries to adopt certified safety systems and compliance solutions.
Why is Machine Safety important for modern manufacturing?
Machine Safety is crucial for modern manufacturing because it reduces workplace accidents, improves operational efficiency, ensures regulatory compliance, and protects both employees and industrial equipment.
Need a Tailored Report?
Customize this report to your needs
Get 10% FREE Customization
Customize This ReportPersonalize This Research
- Triangulate with your Own Data
- Get Data as per your Format and Definition
- Gain a Deeper Dive on a Specific Application, Geography, Customer or Competitor
- Any level of Personalization
Let Us Help You
- What are the Known and Unknown Adjacencies Impacting the Machine Safety Market
- What will your New Revenue Sources be?
- Who will be your Top Customer; what will make them switch?
- Defend your Market Share or Win Competitors
- Get a Scorecard for Target Partners

Custom Market Research Services
We Will Customise The Research For You, In Case The Report Listed Above Does Not Meet With Your Requirements
Get 10% Free CustomisationTESTIMONIALS

Tetsuya Ohhira
Business Development Manager-Technology Business
Nikon Corporation,
Leading Japanese MNC specializing in optics and imaging productswww.nikon.com
MarketsandMarkets™ response
is quick. Their attitude is flexible and positive. Analyst Insights are globally considered and
significant. Client Services quickly respond to our inquiry and demand. Their wide range of global
surveys help us make our strategic plan.
We hope Knowledge Store will be easier to search
for a report.
VP - Marketing & Business Development
Leading Provider of Process Control Solutions
We engaged with MarketsandMarkets on a study to perform an analysis and recommend a Go-To-Market strategy for metrology and process control in the semiconductor market. The study was tailored to our targets and needs with well-defined milestones. Our overall experience with the MarketsandMarkets team was very good throughout the project in all aspects including the analysis methodologies used, the quality and depth of primary and secondary data sets, the professionalism and flexibility of the team and the ability to meet the target schedule and milestones. We want to thank MarketsandMarkets team for a job well done.
- US Machine Safety Market
- Canada Machine Safety Market
- Mexico Machine Safety Market
- Germany Machine Safety Market
- UK Machine Safety Market
- France Machine Safety Market
- Italy Machine Safety Market
- Spain Machine Safety Market
- Nordics Machine Safety Market
- Rest Of Europe Machine Safety Market
- China Machine Safety Market
- Japan Machine Safety Market
- India Machine Safety Market
- South Korea Machine Safety Market
- Australia Machine Safety Market
- Rest Of Asia Pacific Machine Safety Market
- Saudi Arabia Machine Safety Market
- UAE Machine Safety Market
- Qatar Machine Safety Market
- Kuwait Machine Safety Market
- Bahrain Machine Safety Market
- Oman Machine Safety Market
- Rest Of The Middle East Machine Safety Market
- Brazil Machine Safety Market
- Argentina Machine Safety Market
- Rest Of South America Machine Safety Market
- South Africa Machine Safety Market
- Rest Of Africa Machine Safety Market
Growth opportunities and latent adjacency in Machine Safety Market


Evan
Apr, 2026
Can the report help identify high-growth opportunities in robotic safety and collaborative machine safety systems?.
Noah
Apr, 2026
How detailed is the report�s segmentation for safety components used in robotics, packaging, and heavy machinery applications?.