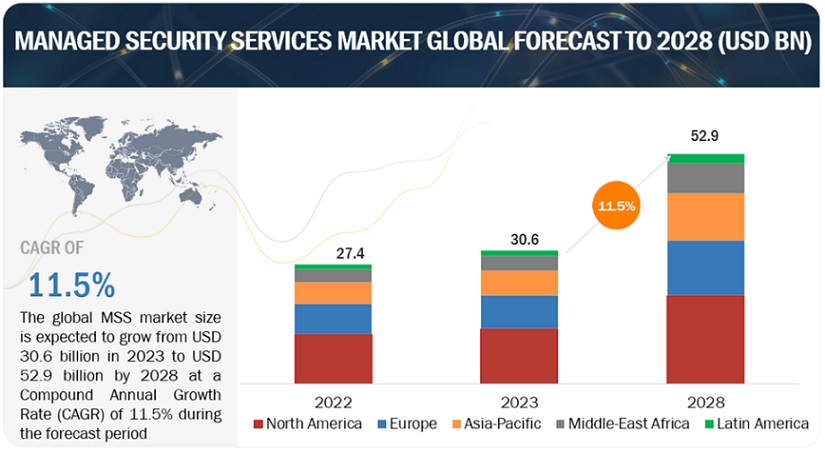
[318 Pages Report] The global MSS market size is projected to grow from USD 22.8 billion in 2021 to USD 43.7 billion by 2026, at a Compound Annual Growth Rate (CAGR) of 13.9% during the forecast period. The major factors that are expected to drive the growth of the MSS market include the stringent government regulations, surge in trends such as BYOD, CYOD, and WFH, the rising security breaches and sophisticated cyberattacks across enterprises, and the cost-effectiveness in implementing MSS. However, the lack of trust in third-party applications that handle enterprises’ sensitive data is expected to be a restraint for the growth of the MSS market. The lack of competent security professionals to handle challenging environments is also expected to be a major challenge for the growth of the MSS market. The rising adoption of cloud technology and IoT devices and the growing demand for robust and cost-effective security services among enterprises to monitor and manage security events are expected to open new avenue pockets for MSSPs.
Considering the sources and association’s or Forum’s views on MSS, MarketsandMarkets defines it as “MSS is the management of an organization security infrastructure from outside or third party location. Outsourced security services, third-party security services, and as-a-service are the terms associated with MSS.”
To know about the assumptions considered for the study, Request for Free Sample Report
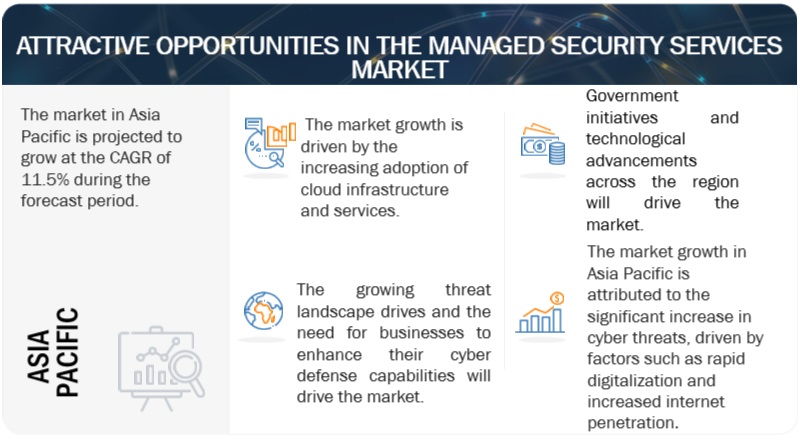
According to a cybersecurity research firm FireEye, APT41 attackers have exploited the vulnerabilities of Cisco routers, Citrix Netscaler traffic controllers, and Zoho's remote terminal management software. The total number of companies they have hacked is at least 75 across 20 countries, affecting critical fields of business such as finance, defense, and oil and gas. The lead scientist and chief scientist at security firm McAfee stated that the volume of COVID-19 themed lure campaigns are rising, and they found that the healthcare sector is the most targeted sector, followed by finance and then education.
MSS are deployed on an outsourcing contractual basis for a period of six months to two years or more. Major players in this marketplace, such as IBM, AT&T, Accenture, and Cognizant, are still offering security services to their existing clients. However, the acquisition of new clients and new contracts is a factor that is decelerating the growth in this market amid the outbreak. Even SMEs do not have the necessary budget and resources to adapt to security practices. Large organizations and critical industries, such as healthcare, IT firms, and banks, are collaborating with MSSP vendors for a more robust and secure infrastructure in this continuous surge of cyberattacks. Hence, there is a lot of potential for the growth of MSS with the ascending cyber threat landscape.
with the advent of digitalization and rapid changes in technology, organizations across the globe are adopting new trends, such as BYOD and CYOD, such as laptops, tablets, and smartphones, for their employees. These personal devices of employees, such as smartphones, laptops, and tablets, use private networks for connectivity which are easily intruded. These personal devices are used to access corporate information, increasing the chances of cyberattacks and posing a threat to the overall security posture of organizations. Another trend is WFH, in which employees are allowed to WFH from their devices. When employees WFH, they use private networks, such as mobile connections or broadband, whose security strength is not known by organizations. Since these devices are often used for personal business, they could be at risk of malware and other cybersecurity attacks that did not originate within the company. In case a breach occurs, it can result in the loss of sensitive and critical data. The increased risk of malware due to BYOD users is a major concern for cybersecurity professionals. To tackle security breaches, there is a growing need for these devices to be continuously monitored for 24x7x365 by the skilled expertise. To protect organizations from potential harms that could be caused due to these trends, enterprises are adopting MSS to reduce the threat landscape. Hence, the surge in trends, such as BYOD, CYOD, and WFH, is driving the MSS market.
Enterprises opt for Managed Security Service Provider (MSSP), a third-party service provider, when they do not have enough in-house security expertise or have budgetary constraints. Outsourcing security operations to a third-party service provider involves multiple considerations, such as the security of the third-party’s infrastructure itself, expertise, up-to-date cybersecurity technology, round-the-clock support, and the overall decision of migrating to security as a service. It is essential that the service provider’s infrastructure is secured and up to date enough to be able to combat the latest threats. Since the service provider’s infrastructure may hold vital data of multiple organizations, it is highly susceptible to repeated and complex attacks; this can be a deterrent for companies to hand over their data to these service providers. In certain cases, the top management of organizations might not be willing to let go of control over vital aspects of their infrastructure. Enterprises suspect that in case things go wrong between MSSPs and organizations, MSSPs having complete control of system architecture can prove to be disadvantageous for organizations. This is also one of the reasons that organizations are a little hesitant in giving full control of their system architecture to MSSPs.
With various advantages, such as cost-effectiveness, dynamic access to data, and reduced turnaround time for business processes, which come with the adoption of cloud services, a number of SMEs, as well as large enterprises, are inclined toward having the maximum control over their data and infrastructure in the cloud globally. For this, they are keen on utilizing the benefits of cloud security services for greater security and access to data. These services have distinctive features, such as security policy enforcement, various compliances, IAM, encryption, SIEM, and malware detection and prevention, which can be utilized by MSSPs. Owing to these benefits, several large enterprises and SMEs are moving their businesses to the cloud to deliver excellent services. With the reduced cost of implementation of these services, SMEs are becoming more inclined toward cloud-based security solutions, and this opportunity can be utilized by MSSPs for offering custom-based security services to enterprises.
IoT is going to be the future, but as the IoT becomes more widespread, even more important systems will be vulnerable to malware attacks and compromise for hefty sums of money. MSS will keep enterprises informed about the potential cyberattacks that could happen over IoT devices. Hence, the rising adoption of cloud technology as well as IoT devices among enterprises are expected to be a good opportunity for the MSS market during the forecast period.
The Banking, Financial Services, and Insurance (BFSI) vertical is estimated to dominate the MSS market with the largest market size, while the healthcare vertical is the fastest-growing vertical during the forecast period. MSS are expected to help the BFSI vertical in keeping the confidentiality of sensitive data, which will, in turn, help in maintaining the overall security posture. The biggest advantage of using MSS in the BFSI vertical is 24*7*365 monitoring, which results in immediate incident response and remediation in case of a security breach. The BFSI vertical is very careful about the security of the sensitive data of its customers. Hence, for enhancing the protection of online services from cyberattacks, companies are adopting MSS services at a large scale in the BFSI vertical. In the healthcare vertical, MSS such as Medical Device Penetration Testing, Network Segmentation for Medical Equipment, Device Inventory and Risk Analysis, Medical Device Risk Assessments, and continuous incident response will play an integral role in securing the entities related to patients as well as hospital data. Moreover, MSS also helps healthcare organizations comply with stringent Health Insurance Portability and Accountability Act (HIPAA) and Payment Card Industry Data Security Standard (PCI DSS) compliances.
To know about the assumptions considered for the study, download the pdf brochure
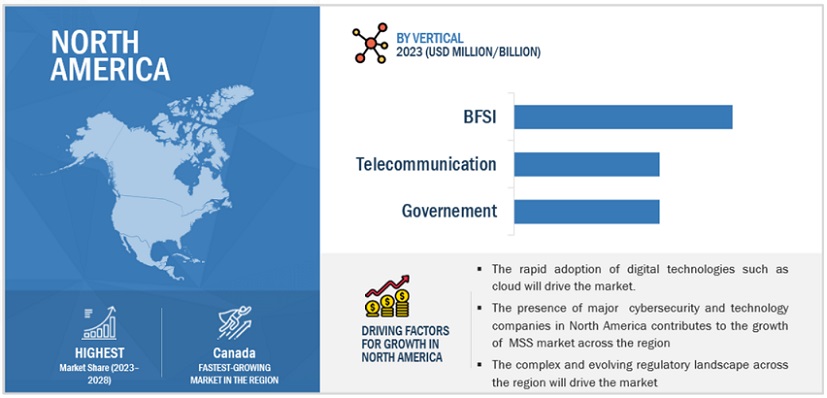
North America is estimated to account for the highest market share in the MSS market. Early adoption of MSS and the presence of several vendors that provide MSS solutions are expected to drive market growth in the region. The COVID-19 pandemic has intensified the rate of security breaches in the region, with hospitals, medical centers, and public institutes being the most targeted verticals. The US Department of Health and Human Services (HHS) was a victim of attacks on its servers amid the pandemic; this has created an urgency to secure the agency’s systems with strong security solutions. Carbon Black, a cybersecurity company, based in Massachusetts, conducted a survey of Canadian CIOs, and 82% of the respondents stated that the number of attacks on Canadian firms was increasing at a fast pace. Such security concerns have compelled organizations to deploy MSS to safeguard their assets against breaches.
This research study outlines the market potential, market dynamics, and key and innovative vendors in the MSS market include IBM (US), AT&T Inc. (US), NTT (Japan), SecureWorks, Inc. (US), DXC Technology Company (US), BT Group plc (UK), Atos SE (France), Infosys Limited (India), Verizon Communications Inc. (US), Cipher Security (US), Wipro Limited (India), Accenture (Ireland), Trustwave Holdings, Inc. (US), The Herjavec Group (Canada), Lumen Technologies (US), Kudelski Security (Switzerland), and Nuspire (US) and others.
The study includes an in-depth competitive analysis of these key players in the MSS market with their company profiles, recent developments, and key market strategies.
Report Metrics |
Details |
Market size available for years |
2016–2026 |
Base year considered |
2020 |
Forecast period |
2021–2026 |
Forecast units |
Value (USD) |
Segments covered |
Security type, service type, Organization Size, Vertical, and Regions. |
Geographies covered |
North America, Europe, APAC, Middle East and Africa (MEA), and Latin America. |
Major companies covered |
International Business Machines Corporation (IBM), AT&T Inc. (AT&T), NTT, SecureWorks, Inc. (SecureWorks), DXC Technology Company (DXC Technology), BT Group plc (BT), Atos SE (Atos), Infosys Limited (Infosys), Verizon Communications Inc. (Verizon), Cipher Security, Wipro Limited (Wipro), Accenture, Trustwave Holdings, Inc. (Trustwave), The Herjavec Group (Herjavec), Lumen Technologies, Kudelski Security, and Nuspire. |
This research report categorizes the MSS to forecast revenues and analyze trends in each of the following submarkets:
What is the projected market value of the global MSS market?
The global MSS market size is projected to grow from USD 22.8 billion in 2021 to USD 43.7 billion by 2026, at a Compound Annual Growth Rate (CAGR) of 13.9% during the forecast period.
Which region has the highest market share in the MSS market?
North America is estimated to hold the highest market share in the MSS market.
What is the definition of MSS?
MarketsandMarkets defines MSS as - “MSS is the management of an organization security infrastructure from outside or third party location. Outsourced security services, third-party security services, and as-a-service are the terms associated with MSS.” .
To speak to our analyst for a discussion on the above findings, click Speak to Analyst
TABLE OF CONTENTS
1 INTRODUCTION (Page No. - 47)
1.1 INTRODUCTION TO COVID-19
1.2 COVID-19 HEALTH ASSESSMENT
FIGURE 1 COVID-19: GLOBAL PROPAGATION
FIGURE 2 COVID-19 PROPAGATION: SELECT COUNTRIES
1.3 COVID-19 ECONOMIC ASSESSMENT
FIGURE 3 REVISED GROSS DOMESTIC PRODUCT FORECASTS FOR SELECT G20 COUNTRIES IN 2020
1.3.1 COVID-19 ECONOMIC IMPACT—SCENARIO ASSESSMENT
FIGURE 4 CRITERIA IMPACTING GLOBAL ECONOMY
FIGURE 5 SCENARIOS IN TERMS OF RECOVERY OF GLOBAL ECONOMY
1.4 OBJECTIVES OF THE STUDY
1.5 MARKET DEFINITION
1.5.1 INCLUSIONS AND EXCLUSIONS
1.6 MARKET SCOPE
1.6.1 MARKET SEGMENTATION
1.6.2 REGIONS COVERED
1.7 PERIODIZATION CONSIDERED FOR THE STUDY
1.8 CURRENCY CONSIDERED
TABLE 1 USD EXCHANGE RATES, 2016–2020
1.9 STAKEHOLDERS
1.10 SUMMARY OF CHANGES
2 RESEARCH METHODOLOGY (Page No. - 57)
2.1 RESEARCH DATA
FIGURE 6 MANAGED SECURITY SERVICES MARKET: RESEARCH DESIGN
2.1.1 SECONDARY DATA
2.1.2 PRIMARY DATA
2.1.2.1 Breakup of primary profiles
2.1.2.2 Key industry insights
2.2 DATA TRIANGULATION
FIGURE 7 MSS MARKET: DATA TRIANGULATION
2.3 MARKET SIZE ESTIMATION
FIGURE 8 MARKET SIZE ESTIMATION METHODOLOGY, APPROACH 1 (SUPPLY SIDE): REVENUE OF SERVICES IN THE MARKET
FIGURE 9 MARKET SIZE ESTIMATION METHODOLOGY—APPROACH 1, SUPPLY-SIDE ANALYSIS
FIGURE 10 MARKET: MARKET ESTIMATION APPROACH—SUPPLY-SIDE ANALYSIS [COMPANY REVENUE ESTIMATION (ILLUSTRATION OF REVENUE ESTIMATION FOR IBM)]
FIGURE 11 MARKET SIZE ESTIMATION METHODOLOGY—APPROACH 1—BOTTOM-UP (SUPPLY SIDE): COLLECTIVE REVENUE OF ALL SERVICES IN THE MANAGED SECURITY SERVICES MARKET
FIGURE 12 MARKET SIZE ESTIMATION METHODOLOGY—APPROACH 2—BOTTOM-UP (DEMAND SIDE) VERTICALS
2.4 MARKET FORECAST
TABLE 2 FACTOR ANALYSIS
2.5 COMPANY EVALUATION QUADRANT METHODOLOGY
FIGURE 13 COMPANY EVALUATION QUADRANT: CRITERIA WEIGHTAGE
2.6 STARTUPS EVALUATION QUADRANT METHODOLOGY
FIGURE 14 STARTUP EVALUATION QUADRANT: CRITERIA WEIGHTAGE
2.7 RESEARCH ASSUMPTIONS
2.8 LIMITATIONS OF THE STUDY
3 EXECUTIVE SUMMARY (Page No. - 69)
FIGURE 15 MSS MARKET TO WITNESS FAST GROWTH DURING THE FORECAST PERIOD
FIGURE 16 MSS MARKET: FASTEST-GROWING SEGMENTS, 2021–2026
FIGURE 17 ASIA PACIFIC TO GROW AT THE HIGHEST CAGR DURING THE FORECAST PERIOD
4 PREMIUM INSIGHTS (Page No. - 73)
4.1 BRIEF OVERVIEW OF THE MANAGED SECURITY SERVICES MARKET
FIGURE 18 INCREASING INSTANCES OF CYBER BREACHES AND INCREASING ADOPTION OF DIGITAL PLATFORMS BY ENTERPRISES TO DRIVE THE GROWTH OF THE MARKET
4.2 MARKET, BY SECURITY TYPE, 2021
FIGURE 19 MANAGED IAM SEGMENT TO HOLD THE LARGEST SHARE DURING THE FORECAST PERIOD
4.3 MARKET, BY SERVICE TYPE, 2021-2026
FIGURE 20 CO-MANAGED SECURITY SERVICE IS EXPECTED TO LEAD THE MSS MARKET BY REVENUE DURING THE FORECAST PERIOD
4.4 MARKET, BY ORGANIZATION SIZE, 2021
FIGURE 21 LARGE ENTERPRISES SEGMENT TO HOLD A LARGER MARKET SIZE DURING THE FORECAST PERIOD
4.5 TOP 3 VERTICALS AND REGIONS IN THE MANAGED SECURITY SERVICES MARKET, 2021
FIGURE 22 BANKING, FINANCIAL SERVICES, AND INSURANCE AND NORTH AMERICA TO HOLD THE LARGEST MARKET SHARES IN 2021
4.6 MARKET INVESTMENT SCENARIO
FIGURE 23 ASIA PACIFIC TO EMERGE AS THE BEST MARKET FOR INVESTMENTS IN THE NEXT SIX YEARS
5 MARKET OVERVIEW AND INDUSTRY TRENDS (Page No. - 76)
5.1 INTRODUCTION
5.2 MARKET DYNAMICS
FIGURE 24 DRIVERS, RESTRAINTS, OPPORTUNITIES, AND CHALLENGES: MANAGED SECURITY SERVICES MARKET
5.2.1 DRIVERS
5.2.1.1 Stringent government regulations to increase the adoption of MSS solutions
5.2.1.2 Surge in BYOD, CYOD, and WFH trends
5.2.1.3 Rising security breaches and sophisticated cyberattacks across enterprises, resulting in financial and reputational losses
5.2.2 RESTRAINTS
5.2.2.1 Lack of trust among enterprises in giving full control of their system architecture to MSS providers
5.2.3 OPPORTUNITIES
5.2.3.1 Rising adoption of cloud technology and IoT devices
5.2.3.2 Growing demand for robust and cost-effective security services among enterprises to monitor and manage security events
5.2.4 CHALLENGES
5.2.4.1 Lack of skilled security expertise
5.3 IMPACT OF COVID-19 ON MARKET DYNAMICS
TABLE 3 MANAGED SECURITY SERVICES MARKET: DRIVERS AND OPPORTUNITIES
TABLE 4 MARKET: RESTRAINTS AND CHALLENGES
5.3.1 CUMULATIVE GROWTH ANALYSIS
TABLE 5 MARKET: CUMULATIVE GROWTH AND IMPACT
5.4 REGULATORY IMPLICATIONS
5.4.1 GENERAL DATA PROTECTION REGULATION
5.4.2 PAYMENT CARD INDUSTRY DATA SECURITY STANDARD
5.4.3 HEALTH INSURANCE PORTABILITY AND ACCOUNTABILITY ACT
5.4.4 GRAMM-LEACH-BLILEY ACT
5.4.5 SARBANES-OXLEY ACT
5.4.6 SOC2
5.5 USE CASES
5.5.1 USE CASE: SCENARIO 1
5.5.2 USE CASE: SCENARIO 2
5.5.3 USE CASE: SCENARIO 3
5.6 PATENT ANALYSIS
FIGURE 25 NUMBER OF PATENTS PUBLISHED IN LAST 10 YEARS
FIGURE 26 TOP FIVE PATENT OWNERS (US)
5.7 ECOSYSTEM
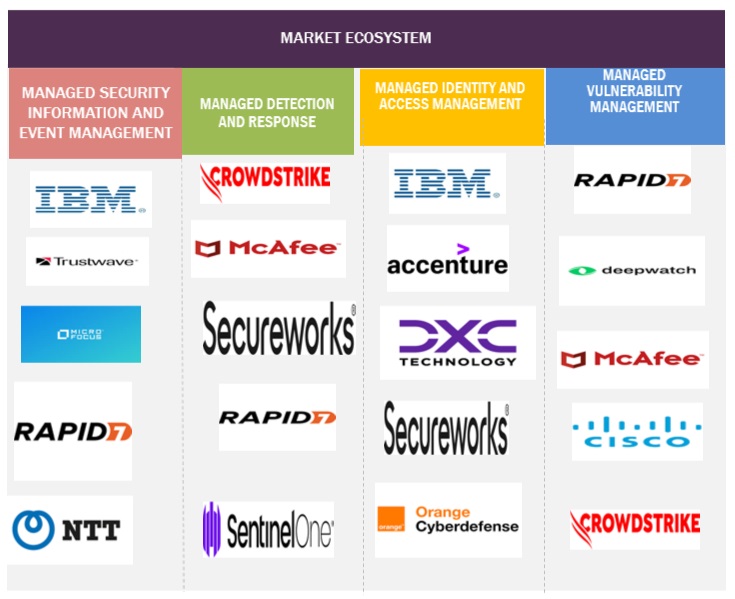
TABLE 6 MANAGED SECURITY SERVICES: MARKET ECOSYSTEM
5.8 VALUE CHAIN
FIGURE 27 VALUE CHAIN OF MANAGED SECURITY SERVICES:
5.9 AVERAGE SELLING PRICE
TABLE 7 SOME OF THE MANAGED SECURITY SERVICE VENDORS’ PRICING
5.10 PORTER’S FIVE FORCES ANALYSIS
FIGURE 28 MANAGED SECURITY SERVICES MARKET: PORTER’S FIVE FORCES ANALYSIS
TABLE 8 ENTERPRISE ASSET MANAGEMENT: PORTER’S FIVE FORCES ANALYSIS
5.10.1 THREAT OF NEW ENTRANTS
5.10.2 THREAT OF SUBSTITUTES
5.10.3 BARGAINING POWER OF SUPPLIERS
5.10.4 BARGAINING POWER OF BUYERS
5.10.5 INTENSITY OF COMPETITIVE RIVALRY
5.11 TRENDS AND DISRUPTIONS IMPACTING CUSTOMERS
FIGURE 29 MARKET: TRENDS AND DISRUPTIONS IMPACTING CUSTOMERS
5.12 TECHNOLOGY ANALYSIS
5.12.1 BIG DATA AND ANALYTICS
5.12.2 CLOUD COMPUTING
5.12.3 ARTIFICIAL INTELLIGENCE AND MACHINE LEARNING
6 MANAGED SECURITY SERVICES MARKET, BY SECURITY TYPE (Page No. - 93)
6.1 INTRODUCTION
FIGURE 30 MANAGED IDENTITY AND ACCESS MANAGEMENT SEGMENT TO RECORD THE LARGEST MARKET VALUE DURING THE FORECAST PERIOD
TABLE 9 MARKET SIZE, BY SECURITY TYPE, 2016–2020 (USD MILLION)
TABLE 10 MARKET SIZE, BY SECURITY TYPE, 2021–2026 (USD MILLION)
6.2 MANAGED IDENTITY AND ACCESS MANAGEMENT
6.2.1 MANAGED IDENTITY AND ACCESS MANAGEMENT: MARKET DRIVERS
6.2.2 COVID-19 IMPACT: MANAGED IDENTITY AND ACCESS MANAGEMENT
TABLE 11 MANAGED IDENTITY AND ACCESS MANAGEMENT: MARKET SIZE, BY REGION, 2016–2020 (USD MILLION)
TABLE 12 MANAGED IDENTITY AND ACCESS MANAGEMENT: MARKET SIZE, BY REGION, 2021–2026 (USD MILLION)
6.3 MANAGED VULNERABILITY MANAGEMENT
6.3.1 MANAGED VULNERABILITY MANAGEMENT: MARKET DRIVERS
6.3.2 COVID-19 IMPACT: MANAGED IDENTITY AND ACCESS MANAGEMENT
TABLE 13 MANAGED VULNERABILITY MANAGEMENT: MANAGED SECURITY SERVICES MARKET SIZE, BY REGION, 2016–2020 (USD MILLION)
TABLE 14 MANAGED VULNERABILITY MANAGEMENT: MARKET SIZE, BY REGION, 2021–2026 (USD MILLION)
6.4 MANAGED DETECTION AND RESPONSE (MDR)
6.4.1 MANAGED DETECTION AND RESPONSE: MARKET DRIVERS
6.4.2 COVID-19 IMPACT: MANAGED DETECTION AND RESPONSE
TABLE 15 MANAGED DETECTION AND RESPONSE: MARKET SIZE, BY REGION, 2016–2020 (USD MILLION)
TABLE 16 MANAGED DETECTION AND RESPONSE: MARKET SIZE, BY REGION, 2021–2026 (USD MILLION)
6.5 MANAGED FIREWALL
6.5.1 MANAGED FIREWALL: MARKET DRIVERS
6.5.2 COVID-19 IMPACT: MANAGED FIREWALL
TABLE 17 MANAGED FIREWALL: MANAGED SECURITY SERVICES MARKET SIZE, BY REGION, 2016–2020 (USD MILLION)
TABLE 18 MANAGED FIREWALL: MARKET SIZE, BY REGION, 2021–2026 (USD MILLION)
6.6 MANAGED RISK AND COMPLIANCE MANAGEMENT
6.6.1 MANAGED RISK AND COMPLIANCE MANAGEMENT: MARKET DRIVERS
6.6.2 COVID-19 IMPACT: MANAGED RISK AND COMPLIANCE MANAGEMENT
TABLE 19 MANAGED RISK AND COMPLIANCE MANAGEMENT: MARKET SIZE, BY REGION, 2016–2020 (USD MILLION)
TABLE 20 MANAGED RISK AND COMPLIANCE MANAGEMENT: MARKET SIZE, BY REGION, 2021–2026 (USD MILLION)
6.7 MANAGED SECURITY INFORMATION AND EVENT MANAGEMENT (SIEM)
6.7.1 MANAGED SECURITY INFORMATION AND EVENT MANAGEMENT: MARKET DRIVERS
6.7.2 COVID-19 IMPACT: MANAGED SECURITY INFORMATION AND EVENT MANAGEMENT
TABLE 21 MANAGED SECURITY INFORMATION AND EVENT MANAGEMENT: MANAGED SECURITY SERVICES MARKET SIZE, BY REGION, 2016–2020 (USD MILLION)
TABLE 22 MANAGED SECURITY INFORMATION AND EVENT MANAGEMENT: MARKET SIZE, BY REGION, 2021–2026 (USD MILLION)
6.8 MANAGED INTRUSION DETECTION SYSTEM/INTRUSION PREVENTION SYSTEM
6.8.1 MANAGED INTRUSION DETECTION SYSTEM/INTRUSION PREVENTION SYSTEM: MARKET DRIVERS
6.8.2 COVID-19 IMPACT: MANAGED INTRUSION DETECTION SYSTEM/INTRUSION PREVENTION SYSTEM
TABLE 23 MANAGED INTRUSION DETECTION SYSTEM/INTRUSION PREVENTION SYSTEM: MARKET SIZE, BY REGION, 2016–2020 (USD MILLION)
TABLE 24 MANAGED INTRUSION DETECTION SYSTEM/INTRUSION PREVENTION SYSTEM: MARKET SIZE, BY REGION, 2021–2026 (USD MILLION)
6.9 MANAGED ENCRYPTION
6.9.1 MANAGED ENCRYPTION: MARKET DRIVERS
6.9.2 COVID-19 IMPACT: MANAGED ENCRYPTION
TABLE 25 MANAGED ENCRYPTION: MANAGED SECURITY SERVICES MARKET SIZE, BY REGION, 2016–2020 (USD MILLION)
TABLE 26 MANAGED ENCRYPTION: MARKET SIZE, BY REGION, 2021–2026 (USD MILLION)
6.10 OTHER SECURITY TYPES
6.10.1 OTHER SECURITY TYPES: MARKET DRIVERS
6.10.2 COVID-19 IMPACT: OTHER SECURITY TYPES
TABLE 27 OTHER SECURITY TYPES: MARKET SIZE, BY REGION, 2016–2020 (USD MILLION)
TABLE 28 OTHER SECURITY TYPES: MARKET SIZE, BY REGION, 2021–2026 (USD MILLION)
7 MANAGED SECURITY SERVICES MARKET, BY SERVICE TYPE (Page No. - 110)
7.1 INTRODUCTION
FIGURE 31 FULLY MANAGED SEGMENT TO GROW AT A HIGHER CAGR DURING THE FORECAST PERIOD
TABLE 29 MARKET SIZE, BY SERVICE TYPE, 2016–2020 (USD MILLION)
TABLE 30 MARKET SIZE, BY SERVICE TYPE, 2021–2026 (USD MILLION)
7.2 FULLY MANAGED
7.2.1 FULLY MANAGED SECURITY SERVICES: MARKET DRIVERS
7.2.2 COVID-19 IMPACT: FULLY MANAGED SECURITY SERVICES
TABLE 31 FULLY MANAGED: MARKET SIZE, BY REGION, 2016–2020 (USD MILLION)
TABLE 32 FULLY MANAGED: MARKET SIZE, BY REGION, 2021–2026 (USD MILLION)
7.3 CO-MANAGED
7.3.1 CO-MANAGED SECURITY SERVICES: MARKET DRIVERS
7.3.2 COVID-19 IMPACT: CO-MANAGED SECURITY SERVICES
TABLE 33 CO-MANAGED: MARKET SIZE, BY REGION, 2016–2020 (USD MILLION)
TABLE 34 CO-MANAGED: MARKET SIZE, BY REGION, 2021–2026 (USD MILLION)
8 MANAGED SECURITY SERVICES MARKET, BY ORGANIZATION SIZE (Page No. - 115)
8.1 INTRODUCTION
FIGURE 32 SMALL AND MEDIUM-SIZED ENTERPRISES SEGMENT TO RECORD A HIGHER CAGR DURING THE FORECAST PERIOD
TABLE 35 MARKET SIZE, BY ORGANIZATION SIZE, 2016–2020 (USD MILLION)
TABLE 36 MARKET SIZE, BY ORGANIZATION SIZE, 2021–2026 (USD MILLION)
8.2 SMALL AND MEDIUM-SIZED ENTERPRISES
8.2.1 SMALL AND MEDIUM-SIZED ENTERPRISES: MARKET DRIVERS
8.2.2 COVID-19 IMPACT: SMALL AND MEDIUM-SIZED ENTERPRISES
TABLE 37 SMALL AND MEDIUM-SIZED ENTERPRISES: MARKET SIZE, BY REGION, 2016–2020 (USD MILLION)
TABLE 38 SMALL AND MEDIUM-SIZED ENTERPRISES: MARKET SIZE, BY REGION, 2021–2026 (USD MILLION)
8.3 LARGE ENTERPRISES
8.3.1 LARGE ENTERPRISES: MARKET DRIVERS
8.3.2 COVID-19 IMPACT: LARGE ENTERPRISES
TABLE 39 LARGE ENTERPRISES: MARKET SIZE, BY REGION, 2016–2020 (USD MILLION)
TABLE 40 LARGE ENTERPRISES: MARKET SIZE, BY REGION, 2021–2026 (USD MILLION)
9 MANAGED SECURITY SERVICES MARKET, BY VERTICAL (Page No. - 120)
9.1 INTRODUCTION
FIGURE 33 HEALTHCARE VERTICAL TO RECORD THE HIGHEST GROWTH RATE DURING THE FORECAST PERIOD
TABLE 41 MARKET SIZE, BY VERTICAL, 2016–2020 (USD MILLION)
TABLE 42 MARKET SIZE, BY VERTICAL, 2021–2026 (USD MILLION)
9.2 BANKING, FINANCIAL SERVICES, AND INSURANCE
9.2.1 BANKING, FINANCIAL SERVICES, AND INSURANCE: MARKET DRIVERS
9.2.2 COVID-19 IMPACT: BANKING, FINANCIAL SERVICES, AND INSURANCE
TABLE 43 BANKING, FINANCIAL SERVICES, AND INSURANCE: MARKET SIZE, BY REGION, 2016–2020 (USD MILLION)
TABLE 44 BANKING, FINANCIAL SERVICES. AND INSURANCE: MARKET SIZE, BY REGION, 2021–2026 (USD MILLION)
9.3 GOVERNMENT
9.3.1 GOVERNMENT: MARKET DRIVERS
9.3.2 COVID-19 IMPACT: GOVERNMENT
TABLE 45 GOVERNMENT: MANAGED SECURITY SERVICES MARKET SIZE, BY REGION, 2016–2020 (USD MILLION)
TABLE 46 GOVERNMENT: MARKET SIZE, BY REGION, 2021–2026 (USD MILLION)
9.4 RETAIL
9.4.1 RETAIL: MARKET DRIVERS
9.4.2 COVID-19 IMPACT: RETAIL
TABLE 47 RETAIL: MARKET SIZE, BY REGION, 2016–2020 (USD MILLION)
TABLE 48 RETAIL: MARKET SIZE, BY REGION, 2021–2026 (USD MILLION)
9.5 HEALTHCARE
9.5.1 HEALTHCARE: MARKET DRIVERS
9.5.2 COVID-19 IMPACT: HEALTHCARE
TABLE 49 HEALTHCARE: MARKET SIZE, BY REGION, 2016–2020 (USD MILLION)
TABLE 50 HEALTHCARE: MARKET SIZE, BY REGION, 2021–2026 (USD MILLION)
9.6 INFORMATION TECHNOLOGY (IT) AND ENTERPRISES
9.6.1 INFORMATION TECHNOLOGY AND ENTERPRISES: MARKET DRIVERS
9.6.2 COVID-19 IMPACT: INFORMATION TECHNOLOGY AND ENTERPRISES
TABLE 51 INFORMATION TECHNOLOGY AND ENTERPRISES: MANAGED SECURITY SERVICES MARKET SIZE, BY REGION, 2016–2020 (USD MILLION)
TABLE 52 INFORMATION TECHNOLOGY AND ENTERPRISES: MARKET SIZE, BY REGION, 2021–2026 (USD MILLION)
9.7 TELECOMMUNICATIONS
9.7.1 TELECOMMUNICATIONS: MARKET DRIVERS
9.7.2 COVID-19 IMPACT: TELECOMMUNICATIONS
TABLE 53 TELECOMMUNICATIONS: MARKET SIZE, BY REGION, 2016–2020 (USD MILLION)
TABLE 54 TELECOMMUNICATIONS: MARKET SIZE, BY REGION, 2021–2026 (USD MILLION)
9.8 ENERGY AND UTILITIES
9.8.1 ENERGY AND UTILITIES: MARKET DRIVERS
9.8.2 COVID-19 IMPACT: ENERGY AND UTILITIES
TABLE 55 ENERGY AND UTILITIES: MARKET SIZE, BY REGION, 2016–2020 (USD MILLION)
TABLE 56 ENERGY AND UTILITIES: MARKET SIZE, BY REGION, 2021–2026 (USD MILLION)
9.9 MANUFACTURING
9.9.1 MANUFACTURING: MARKET DRIVERS
9.9.2 COVID-19 IMPACT: MANUFACTURING
TABLE 57 MANUFACTURING: MANAGED SECURITY SERVICES MARKET SIZE, BY REGION, 2016–2020 (USD MILLION)
TABLE 58 MANUFACTURING: MARKET SIZE, BY REGION, 2021–2026 (USD MILLION)
9.10 OTHER VERTICALS
9.10.1 OTHER VERTICALS: MARKET DRIVERS
9.10.2 COVID-19 IMPACT: OTHER VERTICALS
TABLE 59 OTHER VERTICALS: MARKET SIZE, BY REGION, 2016–2020 (USD MILLION)
TABLE 60 OTHER VERTICALS: MARKET SIZE, BY REGION, 2021–2026 (USD MILLION)
10 MANAGED SECURITY SERVICES MARKET, BY REGION (Page No. - 138)
10.1 INTRODUCTION
FIGURE 34 MARKET IN ASIA PACIFIC TO GROW AT THE HIGHEST CAGR FROM 2021 TO 2026
TABLE 61 MARKET SIZE, BY REGION, 2016–2020 (USD MILLION)
TABLE 62 MARKET SIZE, BY REGION, 2021–2026 (USD MILLION)
FIGURE 35 MARKET IN INDIA TO GROW AT THE HIGHEST CAGR FROM 2021 TO 2026
10.2 NORTH AMERICA
FIGURE 36 NORTH AMERICA: MARKET SNAPSHOT
10.2.1 NORTH AMERICA: MARKET DRIVERS
10.2.2 NORTH AMERICA: COVID-19 IMPACT
10.2.3 NORTH AMERICA: REGULATORY LANDSCAPE
TABLE 63 NORTH AMERICA: REGULATIONS
TABLE 64 NORTH AMERICA: MANAGED SECURITY SERVICES MARKET SIZE, BY SECURITY TYPE, 2016–2020 (USD MILLION)
TABLE 65 NORTH AMERICA: MARKET SIZE, BY SECURITY TYPE, 2021–2026 (USD MILLION)
TABLE 66 NORTH AMERICA: MARKET SIZE, BY SERVICE TYPE, 2016–2020 (USD MILLION)
TABLE 67 NORTH AMERICA: MARKET SIZE, BY SERVICE TYPE, 2021–2026 (USD MILLION)
TABLE 68 NORTH AMERICA: MARKET SIZE, BY ORGANIZATION SIZE, 2016–2020 (USD MILLION)
TABLE 69 NORTH AMERICA: MARKET SIZE, BY ORGANIZATION SIZE, 2021–2026 (USD MILLION)
TABLE 70 NORTH AMERICA: MARKET SIZE, BY VERTICAL, 2016–2020 (USD MILLION)
TABLE 71 NORTH AMERICA: MARKET SIZE, BY VERTICAL, 2021–2026 (USD MILLION)
TABLE 72 NORTH AMERICA: MARKET SIZE, BY COUNTRY, 2016–2020 (USD MILLION)
TABLE 73 NORTH AMERICA: MARKET SIZE, BY COUNTRY, 2021–2026 (USD MILLION)
10.2.4 UNITED STATES
TABLE 74 UNITED STATES: MANAGED SECURITY SERVICES MARKET SIZE, BY SECURITY TYPE, 2016–2020 (USD MILLION)
TABLE 75 UNITED STATES: MARKET SIZE, BY SECURITY TYPE, 2021–2026 (USD MILLION)
TABLE 76 UNITED STATES: MARKET SIZE, BY SERVICE TYPE, 2016–2020 (USD MILLION)
TABLE 77 UNITED STATES: MARKET SIZE, BY SERVICE TYPE, 2021–2026 (USD MILLION)
TABLE 78 UNITED STATES: MARKET SIZE, BY ORGANIZATION SIZE, 2016–2020 (USD MILLION)
TABLE 79 UNITED STATES: MARKET SIZE, BY ORGANIZATION SIZE, 2021–2026 (USD MILLION)
TABLE 80 UNITED STATES: MARKET SIZE, BY VERTICAL, 2016–2020 (USD MILLION)
TABLE 81 UNITED STATES: MARKET SIZE, BY VERTICAL, 2021–2026 (USD MILLION)
10.2.5 CANADA
TABLE 82 CANADA: MANAGED SECURITY SERVICES MARKET SIZE, BY SECURITY TYPE, 2016–2020 (USD MILLION)
TABLE 83 CANADA: MARKET SIZE, BY SECURITY TYPE, 2021–2026 (USD MILLION)
TABLE 84 CANADA: MARKET SIZE, BY SERVICE TYPE, 2016–2020 (USD MILLION)
TABLE 85 CANADA: MARKET SIZE, BY SERVICE TYPE, 2021–2026 (USD MILLION)
TABLE 86 CANADA: MARKET SIZE, BY ORGANIZATION SIZE, 2016–2020 (USD MILLION)
TABLE 87 CANADA: MARKET SIZE, BY ORGANIZATION SIZE, 2021–2026 (USD MILLION)
TABLE 88 CANADA: MARKET SIZE, BY VERTICAL, 2016–2020 (USD MILLION)
TABLE 89 CANADA: MARKET SIZE, BY VERTICAL, 2021–2026 (USD MILLION)
10.3 EUROPE
10.3.1 EUROPE: MANAGED SECURITY SERVICES MARKET DRIVERS
10.3.2 EUROPE: COVID-19 IMPACT
10.3.3 EUROPE: REGULATORY LANDSCAPE
TABLE 90 EUROPE: MARKET ASSOCIATIONS/REGULATIONS
TABLE 91 EUROPE: MARKET SIZE, BY SECURITY TYPE, 2016–2020 (USD MILLION)
TABLE 92 EUROPE: MARKET SIZE, BY SECURITY TYPE, 2021–2026 (USD MILLION)
TABLE 93 EUROPE: MARKET SIZE, BY SERVICE TYPE, 2016–2020 (USD MILLION)
TABLE 94 EUROPE: MARKET SIZE, BY SERVICE TYPE, 2021–2026 (USD MILLION)
TABLE 95 EUROPE: MARKET SIZE, BY ORGANIZATION SIZE, 2016–2020 (USD MILLION)
TABLE 96 EUROPE: MARKET SIZE, BY ORGANIZATION SIZE, 2021–2026 (USD MILLION)
TABLE 97 EUROPE: MARKET SIZE, BY VERTICAL, 2016–2020 (USD MILLION)
TABLE 98 EUROPE: MARKET SIZE, BY VERTICAL, 2021–2026 (USD MILLION)
TABLE 99 EUROPE: MARKET SIZE, BY COUNTRY, 2016–2020 (USD MILLION)
TABLE 100 EUROPE: MARKET SIZE, BY COUNTRY, 2021–2026 (USD MILLION)
10.3.4 UNITED KINGDOM
TABLE 101 UNITED KINGDOM: MANAGED SECURITY SERVICES MARKET SIZE, BY SECURITY TYPE, 2016–2020 (USD MILLION)
TABLE 102 UNITED KINGDOM: MARKET SIZE, BY SECURITY TYPE, 2021–2026 (USD MILLION)
TABLE 103 UNITED KINGDOM: MARKET SIZE, BY SERVICE TYPE, 2016–2020 (USD MILLION)
TABLE 104 UNITED KINGDOM: MARKET SIZE, BY SERVICE TYPE, 2021–2026 (USD MILLION)
TABLE 105 UNITED KINGDOM: MARKET SIZE, BY ORGANIZATION SIZE, 2016–2020 (USD MILLION)
TABLE 106 UNITED KINGDOM: MARKET SIZE, BY ORGANIZATION SIZE, 2021–2026 (USD MILLION)
TABLE 107 UNITED KINGDOM: MARKET SIZE, BY VERTICAL, 2016–2020 (USD MILLION)
TABLE 108 UNITED KINGDOM: MARKET SIZE, BY VERTICAL, 2021–2026 (USD MILLION)
10.3.5 GERMANY
TABLE 109 GERMANY: MANAGED SECURITY SERVICES MARKET SIZE, BY SECURITY TYPE, 2016–2020 (USD MILLION)
TABLE 110 GERMANY: MARKET SIZE, BY SECURITY TYPE, 2021–2026 (USD MILLION)
TABLE 111 GERMANY: MARKET SIZE, BY SERVICE TYPE, 2016–2020 (USD MILLION)
TABLE 112 GERMANY: MARKET SIZE, BY SERVICE TYPE, 2021–2026 (USD MILLION)
TABLE 113 GERMANY: MARKET SIZE, BY ORGANIZATION SIZE, 2016–2020 (USD MILLION)
TABLE 114 GERMANY: MARKET SIZE, BY ORGANIZATION SIZE, 2021–2026 (USD MILLION)
TABLE 115 GERMANY: MARKET SIZE, BY VERTICAL, 2016–2020 (USD MILLION)
TABLE 116 GERMANY: MARKET SIZE, BY VERTICAL, 2021–2026 (USD MILLION)
10.3.6 FRANCE
TABLE 117 FRANCE: MANAGED SECURITY SERVICES MARKET SIZE, BY SECURITY TYPE, 2016–2020 (USD MILLION)
TABLE 118 FRANCE: MARKET SIZE, BY SECURITY TYPE, 2021–2026 (USD MILLION)
TABLE 119 FRANCE: MARKET SIZE, BY SERVICE TYPE, 2016–2020 (USD MILLION)
TABLE 120 FRANCE: MARKET SIZE, BY SERVICE TYPE, 2021–2026 (USD MILLION)
TABLE 121 FRANCE: MARKET SIZE, BY ORGANIZATION SIZE, 2016–2020 (USD MILLION)
TABLE 122 FRANCE: MARKET SIZE, BY ORGANIZATION SIZE, 2021–2026 (USD MILLION)
TABLE 123 FRANCE: MARKET SIZE, BY VERTICAL, 2016–2020 (USD MILLION)
TABLE 124 FRANCE: MARKET SIZE, BY VERTICAL, 2021–2026 (USD MILLION)
10.3.7 REST OF EUROPE
TABLE 125 REST OF EUROPE: MANAGED SECURITY SERVICES MARKET SIZE, BY SECURITY TYPE, 2016–2020 (USD MILLION)
TABLE 126 REST OF EUROPE: MARKET SIZE, BY SECURITY TYPE, 2021–2026 (USD MILLION)
TABLE 127 REST OF EUROPE: MARKET SIZE, BY SERVICE TYPE, 2016–2020 (USD MILLION)
TABLE 128 REST OF EUROPE: MARKET SIZE, BY SERVICE TYPE, 2021–2026 (USD MILLION)
TABLE 129 REST OF EUROPE: MARKET SIZE, BY ORGANIZATION SIZE, 2016–2020 (USD MILLION)
TABLE 130 REST OF EUROPE: MARKET SIZE, BY ORGANIZATION SIZE, 2021–2026 (USD MILLION)
TABLE 131 REST OF EUROPE: MARKET SIZE, BY VERTICAL, 2016–2020 (USD MILLION)
TABLE 132 REST OF EUROPE: MARKET SIZE, BY VERTICAL, 2021–2026 (USD MILLION)
10.4 ASIA PACIFIC
FIGURE 37 ASIA PACIFIC: MARKET SNAPSHOT
10.4.1 ASIA PACIFIC: MARKET DRIVERS
10.4.2 ASIA PACIFIC: COVID-19 IMPACT
10.4.3 ASIA PACIFIC: REGULATORY LANDSCAPE
TABLE 133 ASIA PACIFIC: REGULATIONS
TABLE 134 ASIA PACIFIC: MANAGED SECURITY SERVICES MARKET SIZE, BY SECURITY TYPE, 2016–2020 (USD MILLION)
TABLE 135 ASIA PACIFIC: MARKET SIZE, BY SECURITY TYPE, 2021–2026 (USD MILLION)
TABLE 136 ASIA PACIFIC: MARKET SIZE, BY SERVICE TYPE, 2016–2020 (USD MILLION)
TABLE 137 ASIA PACIFIC: MARKET SIZE, BY SERVICE TYPE, 2021–2026 (USD MILLION)
TABLE 138 ASIA PACIFIC: MARKET SIZE, BY ORGANIZATION SIZE, 2016–2020 (USD MILLION)
TABLE 139 ASIA PACIFIC: MARKET SIZE, BY ORGANIZATION SIZE, 2021–2026 (USD MILLION)
TABLE 140 ASIA PACIFIC: MARKET SIZE, BY VERTICAL, 2016–2020 (USD MILLION)
TABLE 141 ASIA PACIFIC: MARKET SIZE, BY VERTICAL, 2021–2026 (USD MILLION)
TABLE 142 ASIA PACIFIC: MARKET SIZE, BY COUNTRY, 2016–2020 (USD MILLION)
TABLE 143 ASIA PACIFIC: MARKET SIZE, BY COUNTRY, 2021–2026 (USD MILLION)
10.4.4 INDIA
TABLE 144 INDIA: MANAGED SECURITY SERVICES MARKET SIZE, BY SECURITY TYPE, 2016–2020 (USD MILLION)
TABLE 145 INDIA: MARKET SIZE, BY SECURITY TYPE, 2021–2026 (USD MILLION)
TABLE 146 INDIA: MARKET SIZE, BY SERVICE TYPE, 2016–2020 (USD MILLION)
TABLE 147 INDIA: MARKET SIZE, BY SERVICE TYPE, 2021–2026 (USD MILLION)
TABLE 148 INDIA: MARKET SIZE, BY ORGANIZATION SIZE, 2016–2020 (USD MILLION)
TABLE 149 INDIA: MARKET SIZE, BY ORGANIZATION SIZE, 2021–2026 (USD MILLION)
TABLE 150 INDIA: MARKET SIZE, BY VERTICAL, 2016–2020 (USD MILLION)
TABLE 151 INDIA: MARKET SIZE, BY VERTICAL, 2021–2026 (USD MILLION)
10.4.5 CHINA
TABLE 152 CHINA: MANAGED SECURITY SERVICES MARKET SIZE, BY SECURITY TYPE, 2016–2020 (USD MILLION)
TABLE 153 CHINA: MARKET SIZE, BY SECURITY TYPE, 2021–2026 (USD MILLION)
TABLE 154 CHINA: MARKET SIZE, BY SERVICE TYPE, 2016–2020 (USD MILLION)
TABLE 155 CHINA: MARKET SIZE, BY SERVICE TYPE, 2021–2026 (USD MILLION)
TABLE 156 CHINA: MARKET SIZE, BY ORGANIZATION SIZE, 2016–2020 (USD MILLION)
TABLE 157 CHINA: MARKET SIZE, BY ORGANIZATION SIZE, 2021–2026 (USD MILLION)
TABLE 158 CHINA: MARKET SIZE, BY VERTICAL, 2016–2020 (USD MILLION)
TABLE 159 CHINA: MARKET SIZE, BY VERTICAL, 2021–2026 (USD MILLION)
10.4.6 JAPAN
TABLE 160 JAPAN: MANAGED SECURITY SERVICES MARKET SIZE, BY SECURITY TYPE, 2016–2020 (USD MILLION)
TABLE 161 JAPAN: MARKET SIZE, BY SECURITY TYPE, 2021–2026 (USD MILLION)
TABLE 162 JAPAN: MARKET SIZE, BY SERVICE TYPE, 2016–2020 (USD MILLION)
TABLE 163 JAPAN: MARKET SIZE, BY SERVICE TYPE, 2021–2026 (USD MILLION)
TABLE 164 JAPAN: MARKET SIZE, BY ORGANIZATION SIZE, 2016–2020 (USD MILLION)
TABLE 165 JAPAN: MARKET SIZE, BY ORGANIZATION SIZE, 2021–2026 (USD MILLION)
TABLE 166 JAPAN: MARKET SIZE, BY VERTICAL, 2016–2020 (USD MILLION)
TABLE 167 JAPAN: MARKET SIZE, BY VERTICAL, 2021–2026 (USD MILLION)
10.4.7 REST OF ASIA PACIFIC
TABLE 168 REST OF ASIA PACIFIC: MANAGED SECURITY SERVICES MARKET SIZE, BY SECURITY TYPE, 2016–2020 (USD MILLION)
TABLE 169 REST OF ASIA PACIFIC: MARKET SIZE, BY SECURITY TYPE, 2021–2026 (USD MILLION)
TABLE 170 REST OF ASIA PACIFIC: MARKET SIZE, BY SERVICE TYPE, 2016–2020 (USD MILLION)
TABLE 171 REST OF ASIA PACIFIC: MARKET SIZE, BY SERVICE TYPE, 2021–2026 (USD MILLION)
TABLE 172 REST OF ASIA PACIFIC: MARKET SIZE, BY ORGANIZATION SIZE, 2016–2020 (USD MILLION)
TABLE 173 REST OF ASIA PACIFIC: MARKET SIZE, BY ORGANIZATION SIZE, 2021–2026 (USD MILLION)
TABLE 174 REST OF ASIA PACIFIC: MARKET SIZE, BY VERTICAL, 2016–2020 (USD MILLION)
TABLE 175 REST OF ASIA PACIFIC: MARKET SIZE, BY VERTICAL, 2021–2026 (USD MILLION)
10.5 MIDDLE EAST AND AFRICA
10.5.1 MIDDLE EAST AND AFRICA: MANAGED SECURITY SERVICES MARKET DRIVERS
10.5.2 MIDDLE EAST AND AFRICA: COVID-19 IMPACT
10.5.3 MIDDLE EAST AND AFRICA: REGULATORY LANDSCAPE
TABLE 176 MIDDLE EAST AND AFRICA: REGULATIONS
TABLE 177 MIDDLE EAST AND AFRICA: MARKET SIZE, BY SECURITY TYPE, 2016–2020 (USD MILLION)
TABLE 178 MIDDLE EAST AND AFRICA: MARKET SIZE, BY SECURITY TYPE, 2021–2026 (USD MILLION)
TABLE 179 MIDDLE EAST AND AFRICA: MARKET SIZE, BY SERVICE TYPE, 2016–2020 (USD MILLION)
TABLE 180 MIDDLE EAST AND AFRICA: MARKET SIZE, BY SERVICE TYPE, 2021–2026 (USD MILLION)
TABLE 181 MIDDLE EAST AND AFRICA: MARKET SIZE, BY ORGANIZATION SIZE, 2016–2020 (USD MILLION)
TABLE 182 MIDDLE EAST AND AFRICA: MARKET SIZE, BY ORGANIZATION SIZE, 2021–2026 (USD MILLION)
TABLE 183 MIDDLE EAST AND AFRICA: MARKET SIZE, BY VERTICAL, 2016–2020 (USD MILLION)
TABLE 184 MIDDLE EAST AND AFRICA: MARKET SIZE, BY VERTICAL, 2021–2026 (USD MILLION)
TABLE 185 MIDDLE EAST AND AFRICA: MARKET SIZE, BY COUNTRY, 2016–2020 (USD MILLION)
TABLE 186 MIDDLE EAST AND AFRICA: MARKET SIZE, BY COUNTRY, 2021–2026 (USD MILLION)
10.5.4 UNITED ARAB EMIRATES
TABLE 187 UNITED ARAB EMIRATES: MANAGED SECURITY SERVICES MARKET SIZE, BY SECURITY TYPE, 2016–2020 (USD MILLION)
TABLE 188 UNITED ARAB EMIRATES: MARKET SIZE, BY SECURITY TYPE, 2021–2026 (USD MILLION)
TABLE 189 UNITED ARAB EMIRATES: MARKET SIZE, BY SERVICE TYPE, 2016–2020 (USD MILLION)
TABLE 190 UNITED ARAB EMIRATES: MARKET SIZE, BY SERVICE TYPE, 2021–2026 (USD MILLION)
TABLE 191 UNITED ARAB EMIRATES: MARKET SIZE, BY ORGANIZATION SIZE, 2016–2020 (USD MILLION)
TABLE 192 UNITED ARAB EMIRATES: MARKET SIZE, BY ORGANIZATION SIZE, 2021–2026 (USD MILLION)
TABLE 193 UNITED ARAB EMIRATES: MARKET SIZE, BY VERTICAL, 2016–2020 (USD MILLION)
TABLE 194 UNITED ARAB EMIRATES: MARKET SIZE, BY VERTICAL, 2021–2026 (USD MILLION)
10.5.5 SOUTH AFRICA
TABLE 195 SOUTH AFRICA: MANAGED SECURITY SERVICES MARKET SIZE, BY SECURITY TYPE, 2016–2020 (USD MILLION)
TABLE 196 SOUTH AFRICA: MARKET SIZE, BY SECURITY TYPE, 2021–2026 (USD MILLION)
TABLE 197 SOUTH AFRICA: MARKET SIZE, BY SERVICE TYPE, 2016–2020 (USD MILLION)
TABLE 198 SOUTH AFRICA: MARKET SIZE, BY SERVICE TYPE, 2021–2026 (USD MILLION)
TABLE 199 SOUTH AFRICA: MARKET SIZE, BY ORGANIZATION SIZE, 2016–2020 (USD MILLION)
TABLE 200 SOUTH AFRICA: MARKET SIZE, BY ORGANIZATION SIZE, 2021–2026 (USD MILLION)
TABLE 201 SOUTH AFRICA: MARKET SIZE, BY VERTICAL, 2016–2020 (USD MILLION)
TABLE 202 SOUTH AFRICA: MARKET SIZE, BY VERTICAL, 2021–2026 (USD MILLION)
10.5.6 KENYA
TABLE 203 KENYA: MANAGED SECURITY SERVICES MARKET SIZE, BY SECURITY TYPE, 2016–2020 (USD MILLION)
TABLE 204 KENYA: MARKET SIZE, BY SECURITY TYPE, 2021–2026 (USD MILLION)
TABLE 205 KENYA: MARKET SIZE, BY SERVICE TYPE, 2016–2020 (USD MILLION)
TABLE 206 KENYA: MARKET SIZE, BY SERVICE TYPE, 2021–2026 (USD MILLION)
TABLE 207 KENYA: MARKET SIZE, BY ORGANIZATION SIZE, 2016–2020 (USD MILLION)
TABLE 208 KENYA: MARKET SIZE, BY ORGANIZATION SIZE, 2021–2026 (USD MILLION)
TABLE 209 KENYA: MARKET SIZE, BY VERTICAL, 2016–2020 (USD MILLION)
TABLE 210 KENYA: MARKET SIZE, BY VERTICAL, 2021–2026 (USD MILLION)
10.5.7 REST OF MIDDLE EAST AND AFRICA
TABLE 211 REST OF MIDDLE EAST AND AFRICA: MANAGED SECURITY SERVICES MARKET SIZE, BY SECURITY TYPE, 2016–2020 (USD MILLION)
TABLE 212 REST OF MIDDLE EAST AND AFRICA: MARKET SIZE, BY SECURITY TYPE, 2021–2026 (USD MILLION)
TABLE 213 REST OF MIDDLE EAST AND AFRICA: MARKET SIZE, BY SERVICE TYPE, 2016–2020 (USD MILLION)
TABLE 214 REST OF MIDDLE EAST AND AFRICA: MARKET SIZE, BY SERVICE TYPE, 2021–2026 (USD MILLION)
TABLE 215 REST OF MIDDLE EAST AND AFRICA: MARKET SIZE, BY ORGANIZATION SIZE, 2016–2020 (USD MILLION)
TABLE 216 REST OF MIDDLE EAST AND AFRICA: MARKET SIZE, BY ORGANIZATION SIZE, 2021–2026 (USD MILLION)
TABLE 217 REST OF MIDDLE EAST AND AFRICA: MARKET SIZE, BY VERTICAL, 2016–2020 (USD MILLION)
TABLE 218 REST OF MIDDLE EAST AND AFRICA: MARKET SIZE, BY VERTICAL, 2021–2026 (USD MILLION)
10.6 LATIN AMERICA
10.6.1 LATIN AMERICA: MANAGED SECURITY SERVICES MARKET DRIVERS
10.6.2 LATIN AMERICA: COVID-19 IMPACT
10.6.3 LATIN AMERICA: REGULATORY LANDSCAPE
TABLE 219 LATIN AMERICA: REGULATIONS
TABLE 220 LATIN AMERICA: MARKET SIZE, BY SECURITY TYPE, 2016–2020 (USD MILLION)
TABLE 221 LATIN AMERICA: MARKET SIZE, BY SECURITY TYPE, 2021–2026 (USD MILLION)
TABLE 222 LATIN AMERICA: MARKET SIZE, BY SERVICE TYPE, 2016–2020 (USD MILLION)
TABLE 223 LATIN AMERICA: MARKET SIZE, BY SERVICE TYPE, 2021–2026 (USD MILLION)
TABLE 224 LATIN AMERICA: MARKET SIZE, BY ORGANIZATION SIZE, 2016–2020 (USD MILLION)
TABLE 225 LATIN AMERICA: MARKET SIZE, BY ORGANIZATION SIZE, 2021–2026 (USD MILLION)
TABLE 226 LATIN AMERICA: MARKET SIZE, BY VERTICAL, 2016–2020 (USD MILLION)
TABLE 227 LATIN AMERICA: MARKET SIZE, BY VERTICAL, 2021–2026 (USD MILLION)
TABLE 228 LATIN AMERICA: MARKET SIZE, BY COUNTRY, 2016–2020 (USD MILLION)
TABLE 229 LATIN AMERICA: MARKET SIZE, BY COUNTRY, 2021–2026 (USD MILLION)
10.6.4 BRAZIL
TABLE 230 BRAZIL: MANAGED SECURITY SERVICES MARKET SIZE, BY SECURITY TYPE, 2016–2020 (USD MILLION)
TABLE 231 BRAZIL: MARKET SIZE, BY SECURITY TYPE, 2021–2026 (USD MILLION)
TABLE 232 BRAZIL: MARKET SIZE, BY SERVICE TYPE, 2016–2020 (USD MILLION)
TABLE 233 BRAZIL: MARKET SIZE, BY SERVICE TYPE, 2021–2026 (USD MILLION)
TABLE 234 BRAZIL: MARKET SIZE, BY ORGANIZATION SIZE, 2016–2020 (USD MILLION)
TABLE 235 BRAZIL: MARKET SIZE, BY ORGANIZATION SIZE, 2021–2026 (USD MILLION)
TABLE 236 BRAZIL: MARKET SIZE, BY VERTICAL, 2016–2020 (USD MILLION)
TABLE 237 BRAZIL: MARKET SIZE, BY VERTICAL, 2021–2026 (USD MILLION)
10.6.5 MEXICO
TABLE 238 MEXICO: MANAGED SECURITY SERVICES MARKET SIZE, BY SECURITY TYPE, 2016–2020 (USD MILLION)
TABLE 239 MEXICO: MARKET SIZE, BY SECURITY TYPE, 2021–2026 (USD MILLION)
TABLE 240 MEXICO: MARKET SIZE, BY SERVICE TYPE, 2016–2020 (USD MILLION)
TABLE 241 MEXICO: MARKET SIZE, BY SERVICE TYPE, 2021–2026 (USD MILLION)
TABLE 242 MEXICO: MARKET SIZE, BY ORGANIZATION SIZE, 2016–2020 (USD MILLION)
TABLE 243 MEXICO: MARKET SIZE, BY ORGANIZATION SIZE, 2021–2026 (USD MILLION)
TABLE 244 MEXICO: MARKET SIZE, BY VERTICAL, 2016–2020 (USD MILLION)
TABLE 245 MEXICO: MARKET SIZE, BY VERTICAL, 2021–2026 (USD MILLION)
10.6.6 REST OF LATIN AMERICA
TABLE 246 REST OF LATIN AMERICA: MANAGED SECURITY SERVICES MARKET SIZE, BY SECURITY TYPE, 2016–2020 (USD MILLION)
TABLE 247 REST OF LATIN AMERICA: MARKET SIZE, BY SECURITY TYPE, 2021–2026 (USD MILLION)
TABLE 248 REST OF LATIN AMERICA: MARKET SIZE, BY SERVICE TYPE, 2016–2020 (USD MILLION)
TABLE 249 REST OF LATIN AMERICA: MARKET SIZE, BY SERVICE TYPE, 2021–2026 (USD MILLION)
TABLE 250 REST OF LATIN AMERICA: MARKET SIZE, BY ORGANIZATION SIZE, 2016–2020 (USD MILLION)
TABLE 251 REST OF LATIN AMERICA: MARKET SIZE, BY ORGANIZATION SIZE, 2021–2026 (USD MILLION)
TABLE 252 REST OF LATIN AMERICA: MARKET SIZE, BY VERTICAL, 2016–2020 (USD MILLION)
TABLE 253 REST OF LATIN AMERICA: MARKET SIZE, BY VERTICAL, 2021–2026 (USD MILLION)
11 COMPETITIVE LANDSCAPE (Page No. - 227)
11.1 OVERVIEW
11.2 MARKET EVALUATION FRAMEWORK
FIGURE 38 MARKET EVALUATION FRAMEWORK: 2019, 2020, AND 2021 TO WITNESS THE MSS MARKET DEVELOPMENT AND CONSOLIDATION
11.3 COMPANY EVALUATION QUADRANT
11.3.1 OVERVIEW
11.3.2 PRODUCT FOOTPRINT
FIGURE 39 COMPANY EVALUATION QUADRANT: PRODUCT FOOTPRINT OF KEY COMPANIES
11.3.3 COMPANY EVALUATION QUADRANT
TABLE 254 EVALUATION CRITERIA
11.3.4 STAR
11.3.5 EMERGING LEADER
11.3.6 PERVASIVE
11.3.7 PARTICIPANTS
FIGURE 40 MANAGED SECURITY SERVICES MARKET (GLOBAL), COMPANY EVALUATION QUADRANT, 2020
11.4 STARTUP EVALUATION QUADRANT
11.4.1 PROGRESSIVE COMPANIES
11.4.2 RESPONSIVE COMPANIES
11.4.3 DYNAMIC COMPANIES
11.4.4 STARTING BLOCKS
FIGURE 41 MARKET (GLOBAL), STARTUP EVALUATION QUADRANT, 2020
11.5 REVENUE ANALYSIS
FIGURE 42 FIVE-YEAR REVENUE ANALYSIS OF KEY MANAGED SECURITY SERVICES VENDORS
TABLE 255 PRODUCT LAUNCHES
TABLE 256 DEALS
11.6 MARKET SHARE ANALYSIS
FIGURE 43 MANAGED SECURITY SERVICES MARKET (GLOBAL), MARKET SHARE, 2020
TABLE 257 DEGREE OF COMPETITION
12 COMPANY PROFILES (Page No. - 237)
12.1 INTRODUCTION
12.2 LARGE PLAYERS
(Business overview, Services offered, Recent developments, COVID-19 impact, MnM view, Key strengths/Right to win, Strategic choices made, and Weaknesses and competitive threats)*
12.2.1 IBM
TABLE 258 IBM: BUSINESS OVERVIEW
FIGURE 44 IBM: COMPANY SNAPSHOT
TABLE 259 IBM: SERVICES OFFERED
TABLE 260 IBM: PRODUCT LAUNCHES
TABLE 261 IBM: DEALS
12.2.2 ERNST & YOUNG
TABLE 262 ERNST & YOUNG: BUSINESS OVERVIEW
TABLE 263 ERNST & YOUNG: SERVICES OFFERED
TABLE 264 ERNST & YOUNG: PRODUCT LAUNCHES
TABLE 265 ERNST & YOUNG: DEALS
12.2.3 VERIZON
TABLE 266 VERIZON: BUSINESS OVERVIEW
FIGURE 45 VERIZON: COMPANY SNAPSHOT
TABLE 267 VERIZON: SERVICES OFFERED
TABLE 268 VERIZON: PRODUCT LAUNCHES AND ENHANCEMENTS
TABLE 269 VERIZON: DEALS
12.2.4 AT&T
TABLE 270 AT&T: BUSINESS OVERVIEW
FIGURE 46 AT&T: COMPANY SNAPSHOT
TABLE 271 AT&T: SERVICES OFFERED
TABLE 272 AT&T: PRODUCT LAUNCHES
TABLE 273 AT&T: DEALS
12.2.5 ACCENTURE
TABLE 274 ACCENTURE: BUSINESS OVERVIEW
FIGURE 47 ACCENTURE: COMPANY SNAPSHOT
TABLE 275 ACCENTURE: SERVICES OFFERED
TABLE 276 ACCENTURE: DEALS
12.2.6 SECUREWORKS
TABLE 277 SECUREWORKS: BUSINESS OVERVIEW
FIGURE 48 SECUREWORKS: COMPANY SNAPSHOT
TABLE 278 SECUREWORKS: SERVICES OFFERED
TABLE 279 SECUREWORKS: PRODUCT LAUNCHES
TABLE 280 SECUREWORKS: DEALS
12.2.7 DXC TECHNOLOGY
TABLE 281 DXC TECHNOLOGY: BUSINESS OVERVIEW
FIGURE 49 DXC TECHNOLOGY: COMPANY SNAPSHOT
TABLE 282 DXC TECHNOLOGY: SERVICES OFFERED
TABLE 283 DXC TECHNOLOGY: PRODUCT LAUNCHES
TABLE 284 DXC TECHNOLOGY: DEALS
12.2.8 ATOS
TABLE 285 ATOS: BUSINESS OVERVIEW
FIGURE 50 ATOS: COMPANY SNAPSHOT
TABLE 286 ATOS: SERVICES OFFERED
TABLE 287 ATOS: PRODUCT LAUNCHES
TABLE 288 ATOS: DEALS
12.2.9 FUJITSU
TABLE 289 FUJITSU: BUSINESS OVERVIEW
FIGURE 51 FUJITSU: COMPANY SNAPSHOT
TABLE 290 FUJITSU: SERVICES OFFERED
12.2.10 LUMEN TECHNOLOGIES
TABLE 291 LUMEN TECHNOLOGIES: BUSINESS OVERVIEW
FIGURE 52 LUMEN TECHNOLOGIES: COMPANY SNAPSHOT
TABLE 292 LUMEN TECHNOLOGIES: SERVICES OFFERED
TABLE 293 LUMEN TECHNOLOGIES: PRODUCT LAUNCHES
12.2.11 TCS
TABLE 294 TCS: BUSINESS OVERVIEW
FIGURE 53 TCS: COMPANY SNAPSHOT
TABLE 295 TCS: SERVICES OFFERED
12.2.12 INFOSYS
TABLE 296 INFOSYS: BUSINESS OVERVIEW
FIGURE 54 INFOSYS: COMPANY SNAPSHOT
TABLE 297 INFOSYS: SERVICES OFFERED
12.2.13 TRUSTWAVE
TABLE 298 TRUSTWAVE: BUSINESS OVERVIEW
TABLE 299 TRUSTWAVE SERVICES OFFERED
TABLE 300 TRUSTWAVE: PRODUCT LAUNCHES
TABLE 301 TRUSTWAVE: DEALS
12.2.14 NTT
TABLE 302 NTT: BUSINESS OVERVIEW
FIGURE 55 NTT: COMPANY SNAPSHOT
TABLE 303 NTT: SERVICES OFFERED
12.2.15 BT SECURITY
TABLE 304 BT SECURITY: BUSINESS OVERVIEW
FIGURE 56 BT SECURITY: COMPANY SNAPSHOT
TABLE 305 BT SECURITY: SERVICES OFFERED
TABLE 306 BT SECURITY: PRODUCT LAUNCHES
TABLE 307 BT SECURITY: DEALS
12.3 SMES
12.3.1 CIPHER SECURITY
12.3.2 THE HERJAVEC GROUP
12.3.3 DIGITAL GUARDIAN
12.3.4 LIGHTEDGE
12.3.5 NETTITUDE LTD
12.3.6 NUSPIRE
12.3.7 KUDELSKI SECURITY
12.3.8 ONE SOURCE COMMUNICATIONS
12.4 STARTUPS
12.4.1 TECEZE
12.4.2 RSI SECURITY
12.4.3 VIRTUALARMOUR
12.4.4 ODYSSEY CYBERSECURITY
12.4.5 ASCEND TECHNOLOGIES
12.4.6 CORSICA TECHNOLOGIES
*Details on Business overview, Services offered, Recent developments, COVID-19 impact, MnM view, Key strengths/Right to win, Strategic choices made, and Weaknesses and competitive threats might not be captured in case of unlisted companies.
13 ADJACENT MARKETS (Page No. - 294)
13.1 INTRODUCTION TO ADJACENT MARKETS
TABLE 308 ADJACENT MARKETS AND FORECASTS
13.1.1 LIMITATIONS
13.2 CYBERSECURITY MARKET
TABLE 309 CYBERSECURITY MARKET SIZE FOR MANAGED SERVICES, BY REGION, 2015–2020 (USD MILLION)
TABLE 310 CYBERSECURITY MARKET SIZE FOR MANAGED SERVICES, BY REGION, 2020–2026 (USD MILLION)
TABLE 311 NORTH AMERICA: CYBERSECURITY MARKET SIZE, BY SERVICE, 2015–2020 (USD MILLION)
TABLE 312 NORTH AMERICA: CYBERSECURITY MARKET SIZE, BY SERVICE, 2020–2026 (USD MILLION)
TABLE 313 EUROPE: CYBERSECURITY MARKET SIZE, BY SERVICE, 2015–2020 (USD MILLION)
TABLE 314 EUROPE: CYBERSECURITY MARKET SIZE, BY SERVICE, 2020–2026 (USD MILLION)
TABLE 315 ASIA PACIFIC: CYBERSECURITY MARKET SIZE, BY SERVICE, 2015–2020 (USD MILLION)
TABLE 316 ASIA PACIFIC: CYBERSECURITY MARKET SIZE, BY SERVICE, 2020–2026 (USD MILLION)
TABLE 317 MIDDLE EAST AND AFRICA: CYBERSECURITY MARKET SIZE, BY SERVICE, 2015–2020 (USD MILLION)
TABLE 318 MIDDLE EAST AND AFRICA: CYBERSECURITY MARKET SIZE, BY SERVICE, 2020–2026 (USD MILLION)
TABLE 319 LATIN AMERICA: CYBERSECURITY MARKET SIZE, BY SERVICE, 2015–2020 (USD MILLION)
TABLE 320 LATIN AMERICA: CYBERSECURITY MARKET SIZE, BY SERVICE, 2020–2026 (USD MILLION)
13.3 MANAGED SERVICES MARKET
TABLE 321 MANAGED SECURITY SERVICES MARKET SIZE, BY TYPE, 2016–2020 (USD MILLION)
TABLE 322 MARKET SIZE, BY TYPE, 2021–2026 (USD MILLION)
TABLE 323 MANAGED IDENTITY AND ACCESS MANAGEMENT MARKET SIZE, BY REGION, 2016–2020 (USD MILLION)
TABLE 324 MANAGED IDENTITY AND ACCESS MANAGEMENT MARKET SIZE, BY REGION, 2021–2026 (USD MILLION)
TABLE 325 MANAGED ANTIVIRUS/ANTIMALWARE MARKET SIZE, BY REGION, 2016–2020 (USD MILLION)
TABLE 326 MANAGED ANTIVIRUS/ANTIMALWARE: MANAGED SERVICES MARKET SIZE, BY REGION, 2021–2026 (USD MILLION)
TABLE 327 MANAGED FIREWALL SERVICES MARKET SIZE, BY REGION, 2016–2020 (USD MILLION)
TABLE 328 MANAGED FIREWALL SERVICES MARKET SIZE, BY REGION, 2021–2026 (USD MILLION)
TABLE 329 MANAGED RISK AND COMPLIANCE MANAGEMENT SERVICES MARKET SIZE, BY REGION, 2016–2020 (USD MILLION)
TABLE 330 MANAGED RISK AND COMPLIANCE MANAGEMENT SERVICES MARKET SIZE, BY REGION, 2021–2026 (USD MILLION)
TABLE 331 MANAGED VULNERABILITY MANAGEMENT SERVICES MARKET SIZE, BY REGION, 2016–2020 (USD MILLION)
TABLE 332 MANAGED VULNERABILITY MANAGEMENT SERVICES MARKET SIZE, BY REGION, 2021–2026 (USD MILLION)
TABLE 333 MANAGED SECURITY INFORMATION AND EVENT MANAGEMENT SERVICES MARKET SIZE, BY REGION, 2016–2020 (USD MILLION)
TABLE 334 MANAGED SECURITY INFORMATION AND EVENT MANAGEMENT SERVICES MARKET SIZE, BY REGION, 2021–2026 (USD MILLION)
TABLE 335 MANAGED INTRUSION DETECTION SYSTEMS/INTRUSION PREVENTION SYSTEMS MARKET SIZE, BY REGION, 2016–2020 (USD MILLION)
TABLE 336 MANAGED INTRUSION DETECTION SYSTEMS/INTRUSION PREVENTION SYSTEMS MARKET SIZE, BY REGION, 2021–2026 (USD MILLION)
TABLE 337 MANAGED UNIFIED THREAT MANAGEMENT SERVICES MARKET SIZE, BY REGION, 2016–2020 (USD MILLION)
TABLE 338 MANAGED UNIFIED THREAT MANAGEMENT SERVICES MARKET SIZE, BY REGION, 2021–2026 (USD MILLION)
TABLE 339 MANAGED ENCRYPTION SERVICES MARKET SIZE, BY REGION, 2016–2020 (USD MILLION)
TABLE 340 MANAGED ENCRYPTION SERVICES MARKET SIZE, BY REGION, 2021–2026 (USD MILLION)
TABLE 341 OTHER MANAGED SECURITY SERVICES MARKET SIZE, BY REGION, 2016–2020 (USD MILLION)
TABLE 342 OTHER MARKET SIZE, BY REGION, 2021–2026 (USD MILLION)
13.4 SOC AS A SERVICE MARKET
TABLE 343 PRE-COVID-19 SOC AS A SERVICE MARKET SIZE, BY OFFERING TYPE, 2018–2025 (USD MILLION)
TABLE 344 POST-COVID-19 SOC AS A SERVICE MARKET SIZE, BY OFFERING TYPE, 2020–2025 (USD MILLION)
TABLE 345 OFFERING TYPE: SOC AS A SERVICE MARKET SIZE, BY REGION, 2016–2019 (USD MILLION)
TABLE 346 OFFERING TYPE: SOC AS A SERVICE MARKET SIZE, BY REGION, 2020–2025 (USD MILLION)
TABLE 347 FULLY MANAGED: SOC AS A SERVICE MARKET SIZE, BY REGION, 2016–2019 (USD MILLION)
TABLE 348 FULLY MANAGED: SOC AS A SERVICE MARKET SIZE, BY REGION, 2020–2025 (USD MILLION)
TABLE 349 CO-MANAGED OR HYBRID: SOC AS A SERVICE MARKET SIZE, BY REGION, 2016–2019 (USD MILLION)
TABLE 350 CO-MANAGED OR HYBRID: SOC AS A SERVICE MARKET SIZE, BY REGION, 2020–2025 (USD MILLION)
TABLE 351 PRE-COVID-19 SOC AS A SERVICE MARKET SIZE, BY REGION, 2018–2025 (USD MILLION)
TABLE 352 POST-COVID-19 SOC AS A SERVICE MARKET SIZE, BY REGION, 2020–2025 (USD MILLION)
14 APPENDIX (Page No. - 310)
14.1 DISCUSSION GUIDE
14.2 KNOWLEDGE STORE: MARKETSANDMARKETS’ SUBSCRIPTION PORTAL
14.3 AVAILABLE CUSTOMIZATIONS
14.4 RELATED REPORTS
14.5 AUTHOR DETAILS
The study involved four major activities in estimating the current size of the MSS market. Exhaustive secondary research was done to collect information related to the MSS market. The next step was to validate these findings, assumptions, and sizing with industry experts across the value chain using primary research. Both top-down and bottom-up approaches were employed to estimate the complete market size. Thereafter, the market breakup and data triangulation procedures were used to estimate the size of the market segments and subsegments.
In the secondary research process, various secondary sources were referred to, for identifying and collecting information regarding the study. The secondary sources included annual reports, press releases, and investor presentations of MSS vendors, forums, certified publications, and whitepapers. The secondary research was mainly used to obtain key information about the industry’s value chain, the total pool of key players, market classification, and segmentation from both market and technology-oriented perspectives.
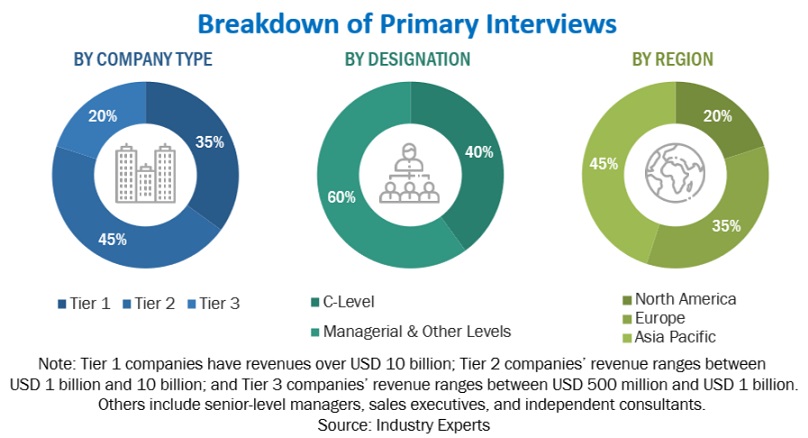
In the primary research process, various primary sources from both supply and demand sides were interviewed to obtain qualitative and quantitative information for this report. The primary sources from the supply side included various industry experts, including Chief Executive Officers (CEOs), Vice Presidents (VPs), marketing directors, technology and innovation directors, and related key executives from various key companies and organizations operating in the MSS market.
In the market engineering process, top-down and bottom-up approaches were extensively used, along with several data triangulation methods, to perform the market estimation and market forecasting for the overall market segments and subsegments listed in this report. Extensive qualitative and quantitative analysis was performed on the complete market engineering process to list key information/insights throughout the report.
After the complete market engineering process (including calculations for market statistics, market breakups, market size estimations, market forecasts, and data triangulation), extensive primary research was conducted to gather information, and verify and validate the critical numbers arrived at. The primary research was also conducted to identify the segmentation types; industry trends; the competitive landscape of MSS market players; and key market dynamics, such as drivers, restraints, opportunities, challenges, industry trends, and key strategies.
Following is the breakup of the primary respondent:
To know about the assumptions considered for the study, download the pdf brochure
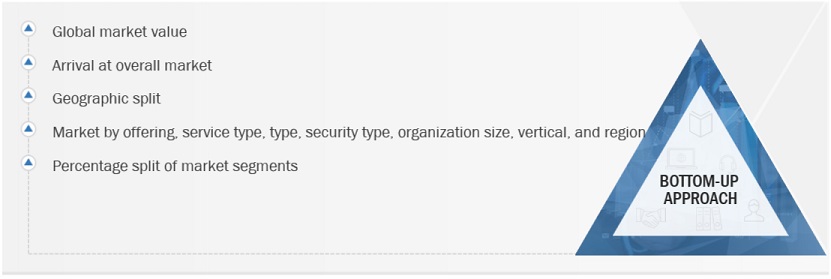
Both top-down and bottom-up approaches were used to estimate and validate the total size of the MSS. These methods were also used extensively to estimate the size of various segments in the market. The research methodology used to estimate the market size includes the following:
After arriving at the overall market size using the market size estimation processes as explained above, the market was split into several segments and subsegments. To complete the overall market engineering process and arrive at each market segment's exact statistics and subsegment, data triangulation, and market breakup procedures were employed, wherever applicable. The data was triangulated by studying various factors and trends from both the demand and supply sides.
With the given market data, MarketsandMarkets offers customizations as per the company’s specific needs. The following customization options are available for the report:
Publish Date | Managed Security Services (MSS) Market Updates |
---|---|
20-May-2022 | GUEST ESSAY: Here’s why managed security services — MSS and MSSP — are catching on |
25-Jan-2019 | MSS by Sangfor: Managed Security Services Revolutionized With Help of Information Security Consulting Leader |
This FREE sample includes market data points, ranging from trend analyses to market estimates & forecasts. See for yourself.
SEND ME A FREE SAMPLE
Growth opportunities and latent adjacency in Managed Security Services (MSS) Market
Interested in a percentage breakdown of the total managed security service market by type (Managed IAM, Managed Firewall, etc).
Valuation of Managed Security Services company
Information on Brazilian cybersecurity market overview specially regarding cyber services (consultancy).
Need country specific data points and list of major players in Managed Security segment across Middle East, Africa and Central Asia countries.
Need to know specifics on demographics covered i.e. how are organization types defined, which verticals are covered and specifically which countries
Information on the M&A activity (summary level data) for the managed security services industry
Market trend Search for Managed security Services, OEM comparisons, Service Providers Competitive Analysis , Service Analysis .