Data Loss Prevention Market

Data Loss Prevention Market by Offering (Solution, Services), Solution Type (Network DLP, Storage DLP, Endpoint DLP, Cloud DLP), Service (Consulting, Managed Security Service), Applications, Vertical and Regions - Global Forecast to 2028

Report Code: TC 1105 Oct, 2023, by marketsandmarkets.com

Data Loss Prevention (DLP) Market Size - Worldwide

[235 Pages Report] The Data Loss Prevention Market was valued at $3.4 billion in 2023. Over the course of projection period, the data loss prevention industry is anticipated to increase at a CAGR of 21.2% in between 2023-2028 to reach over $8.9 billion in 2028. The high rate of Internet penetration and increasing dependency on it for communication has gained the attention of criminals and hackers. Thus, there has been a surge in cases of data breaches. To mitigate these risks, the DLP vendors have started offering DLP as part of a more broadly constituted portfolio of products. The DLP market is thus expected to experience significant growth over the coming years.

Data Loss Prevention Market

To know about the assumptions considered for the study, Request for Free Sample Report

Data Loss Prevention Market

To know about the assumptions considered for the study, download the pdf brochure

Data Loss Prevention Market Growth Dynamics

Driver:  Shifting of data to public and private cloud by enterprises.

In this current era, there has been tremendous growth in the number of enterprises shifting their information from on-premises to the cloud, aiming to reduce costs and improve the efficiency of their organization. The enterprise uses public and private cloud opportunities such as Office 365, Box, and Amazon Web Services to enhance operational agility and mobile workforce productivity, lowering costs. This is due to the increase in digital content across the globe, which is creating the need to manage the constantly growing data files. Moreover, the data growth is highly costly in terms of storage capacity due to the high demand for power, management overheads, and cooling capacity in the physical data center. But as the information moves from in-house to cloud, it highlights security, privacy, and compliance concerns.

Restraint: Complex rules and doesn’t guarantee preventio

The proliferation of BYOD and cloud services has made organizations more porous and vulnerable. Sharing data and collaboration has become a must in today’s world of mobility and globalization. The challenge is that some documents must be shared, and some must be confined within the organization’s boundaries. The biggest threat is from insiders, and it has become challenging for any IT professional to define a policy that accurately describes the enterprise requirements without generating an unreasonable amount of “false positives.” Most organizations cannot afford a large team to configure and maintain the complex rules in a typical DLP deployment. Instead, companies fall back to a few basic, intrusive rules (e.g., “block all USB devices” and “no usage of Facebook”). As a result, many DLP deployments fail or never get started seriously.

Opportunity: Increased remote workforce security

As organizations increasingly embrace flexible work arrangements, the DLP market has many opportunities to enhance remote workforce security. Solutions that cater to endpoint security, cloud-based protection, and seamless integration with collaboration tools are in high demand. AI and machine learning-powered DLP systems promise real-time threat detection and policy enforcement. Additionally, focusing on user education, mobile device security, and adherence to zero trust principles is crucial. Compliance and reporting capabilities and managed DLP services provide holistic solutions to address the intricacies of data protection in remote work environments. Customization and flexibility are key considerations, allowing organizations to tailor DLP policies to their needs. Finally, robust incident response and remediation features round out the portfolio of opportunities in this dynamic and ever-evolving market.

Challenge: Deployment challenges

Data breaches are one of the biggest concerns for enterprises nowadays, and at times, data loss is mainly contributed by employees. Hence, enterprises turn toward DLP solutions to prevent data loss, but the enterprises need help with the deployment of DLP solutions. The enterprises first need to identify the data they plan to protect under DLP as the data remains at different levels, i.e., data in motion, data at rest, and data at endpoint, which can pose a significant challenge to the enterprise. Moreover, the enterprises need to formulate internal policies in line with the DLP framework but need more experience and a trained workforce that may be responsible for building the policies. The enterprises must also spend considerable time and money on training, workshops, and seminars to overcome these issues. Other factors, such as underestimated deployment costs and time, ignorance of legal framework, and regulation, may affect the deployment of DLP solutions.

Data Loss Prevention market Ecosystem

Prominent companies in this market include a well-established, financially stable provider of the Data Loss Prevention market. These companies have innovated their offerings and possess a diversified product portfolio, state-of-the-art technologies, and marketing networks. Prominent companies in this market include Broadcom (US), IBM (US), Microsoft (US), Trend Micro (Japan), McAfee (US), Palo Alto Networks (US), GTB Technologies (US), InfoWatch (Russia), Fortra (US), Cisco Systems (US), etc.

Data Loss Prevention Market

By service, the Managed Security Service segment is expected to grow with the highest CAGR during the forecast period

The increased complexity of threats and attacks and the emergence of sophisticated cyber criminals force companies to upgrade their security systems consistently. As a result, companies are rapidly outsourcing their network security concerns to specialized service providers known as mobile security service providers. Mobile security service offerings exist in many forms, from pure system management to sophisticated log analysis, from on-premises device monitoring and management services to SaaS and cloud services. The global mobile security service market is highly fragmented and comprises players from diverse backgrounds, ranging from specialized mobile security service providers to telecommunication companies, system integrators, and VARs.

Based on region, Asia Pacific is expected to grow with the highest CAGR during the forecast period

Due to the ever-growing threat landscape, the Asia Pacific region is highly concerned with increasing security spending. This region, which includes emerging economies such as China, India, Australia, Hong Kong, and Japan, has many small and medium-sized businesses (SMBs) providing significant employment opportunities. However, the high cost of cybersecurity projects prevents many SMBs from implementing strong security practices, making them more vulnerable to cyberattacks. Countries such as Japan, China, and Singapore have launched new national cybersecurity policies to address the sophisticated cyber threats. Organizations in the Asia Pacific region are spending significant resources to deal with cybersecurity breaches. Australia and Malaysia are currently better positioned than other countries to face cybersecurity challenges.

Data Loss Prevention Market Size, and Share

Market Players:

The major players in the Data Loss Prevention market are Broadcom (US), IBM (US), Microsoft (US), Trend Micro (Japan), McAfee (US), Palo Alto Networks (US), GTB Technologies (US), InfoWatch (Russia), Fortra (US), Cisco Systems (US), etc. These players have adopted various growth strategies, such as partnerships, agreements and collaborations, new product launches, enhancements, and acquisitions to expand their footprint in the Data Loss Prevention market.

Get online access to the report on the World's First Market Intelligence Cloud

  • Easy to Download Historical Data & Forecast Numbers
  • Company Analysis Dashboard for high growth potential opportunities
  • Research Analyst Access for customization & queries
  • Competitor Analysis with Interactive dashboard
  • Latest News, Updates & Trend analysis
Request Sample

Scope of the Report

Report Metrics

Details

Market size available for years

2018-2028

Base year considered

2022

Forecast period

2023–2028

Forecast units

Value (USD) Million/Billion

Segments Covered

Data Loss Prevention Market by Offering (Solution, Services), Solution Type (Network DLP, Storage DLP, Endpoint DLP, Cloud DLP), Service(Consulting, System Integration and Installation, Managed Security Service, Education and Training, Risk and Threat Assessment) Applications(Encryption, Centralized Management, Policy, Standards, and Procedures, Web and Email Protection, Cloud Storage, Incident Response and Workflow Management, Others), Vertical (IT and Telecommunication, Government, BFSI, Aerospace, Defence and Intelligence, Healthcare, Retail and Logistics, Manufacturing, Energy and Utilities, and Other Verticals)

Region covered

North America, Europe, Asia Pacific, Middle East & Africa, Latin America

Companies covered

Broadcom (US), IBM (US), Microsoft (US), Trend Micro (Japan), McAfee (US), Palo Alto Networks (US), GTB Technologies (US), InfoWatch (Russia), Fortra (US), Cisco Systems (US), etc.

This research report categorizes the Data Loss Prevention Market based on offering, solution type, service, applications, vertical, and regions.

DLP Market Based on Offering:
  • Solution
  • Services
DLP Market Based on Solution:
  • Network DLP
  • Storage/Datacenter DLP
  • Endpoint DLP
  • Cloud DLP
DLP Market Based on Service:
  • Consulting
  • System Integration and Installation
  • Managed Security Service
  • Education and Training
  • Risk and Threat Assessment
DLP Market Based on Application:
  • Encryption
  • Centralized Management
  • Policy, Standards, and Procedures
  • Web and Email Protection
  • Cloud Storage
  • Incident Response and Workflow management
  • Others
DLP Market Based on Vertical:
  • IT and Telecommunication
  • Government
  • BFSI
  • Aerospace, Defence and Intelligence
  • Healthcare
  • Retail and Logistics
  • Manufacturing
  • Energy and Utilities
  • Other Verticals
DLP Market Based on the Region:
  • North America
    • US
    • Canada
  • Europe
    • UK
    • Germany
    • France
    • Italy
    • Spain
    • Nordics
    • Rest of Europe
  • Asia Pacific
    • China
    • Japan
    • India
    • Australia and New Zealand (ANZ)
    • Rest of Asia Pacific
  • Middle East & Africa
    • UAE
    • KSA
    • Rest of Middle East and Africa
  • Latin America
    • Brazil
    • Mexico
    • Rest of Latin America

Recent Developments in Data Loss Prevention (DLP) Market

  • In September 2023, McAfee announced the launch of AI-powered Scam Protection to proactively spot and block scams in real-time.
  • In September 2023, McAfee announced the launch of its new McAfee Privacy & Identity Guard product to proactively monitor and remove data online to help prevent potential identity theft and fraud.
  • In June 2023, McAfee announced McAfee Business Protection, a new comprehensive security solution for small business owners in collaboration with Dell Technologies. McAfee Business Protection helps Dell small business customers avoid cyber threats and vulnerabilities with award-winning security, identity and dark web data monitoring, VPN, web protection for safe browsing, and more.
  • In February 2023, Trend Micro announced the signing of a definitive agreement to acquire Anlyz, a leading provider of security operations center (SOC) technology. The acquisition will extend Trend's orchestration, automation, and integration capabilities and enable enterprises and Managed Security Service Providers (MSSPs) to improve operational efficiencies, cost-effectiveness, and security outcomes.
  • In May 2022, Broadcom acquired VMware, a leading innovator in enterprise software, under which Broadcom will acquire all of the outstanding shares of VMware in a cash-and-stock transaction.

Frequently Asked Questions (FAQ):

To speak to our analyst for a discussion on the above findings, click Speak to Analyst

TABLE OF CONTENTS
 
1 INTRODUCTION (Page No. - 32)
    1.1 STUDY OBJECTIVES 
    1.2 MARKET DEFINITION 
    1.3 STUDY SCOPE 
           1.3.1 MARKET SEGMENTATION
           1.3.2 INCLUSIONS & EXCLUSIONS
           1.3.3 REGIONS COVERED
    1.4 YEARS CONSIDERED 
    1.5 CURRENCY CONSIDERED 
           TABLE 1 USD EXCHANGE RATES, 2020–2022
    1.6 STAKEHOLDERS 
    1.7 RECESSION IMPACT 
    1.8 SUMMARY OF CHANGES 
 
2 RESEARCH METHODOLOGY (Page No. - 37)
    2.1 RESEARCH DATA 
           FIGURE 1 RESEARCH DESIGN
           2.1.1 SECONDARY DATA
                    2.1.1.1 Key data from secondary sources
           2.1.2 PRIMARY DATA
                    2.1.2.1 Primary interviews with experts
                    2.1.2.2 List of key primary interview participants
                    2.1.2.3 Breakup of primary profiles
                               FIGURE 2 BREAKUP OF PRIMARY INTERVIEWS: BY COMPANY TYPE, DESIGNATION,  AND REGION
                    2.1.2.4 Key data from primary sources
                    2.1.2.5 Key industry insights
    2.2 DATA TRIANGULATION 
    2.3 MARKET SIZE ESTIMATION 
           FIGURE 3 DATA LOSS PREVENTION MARKET: TOP-DOWN AND BOTTOM-UP APPROACHES
           FIGURE 4 MARKET SIZE ESTIMATION METHODOLOGY – APPROACH 1 (SUPPLY-SIDE): REVENUE FROM DATA LOSS PREVENTION SERVICE VENDORS
    2.4 RESEARCH ASSUMPTIONS 
    2.5 LIMITATIONS AND RISK ASSESSMENT 
    2.6 IMPLICATION OF RECESSION 
 
3 EXECUTIVE SUMMARY (Page No. - 47)
    FIGURE 5 MARKET, 2021–2028 (USD MILLION) 
    FIGURE 6 MARKET: REGIONAL SHARE, 2023 
    FIGURE 7 ASIA PACIFIC TO BE BEST MARKET FOR INVESTMENTS DURING FORECAST PERIOD 
 
4 PREMIUM INSIGHTS (Page No. - 51)
    4.1 BRIEF OVERVIEW OF MARKET 
           FIGURE 8 RISING GOVERNMENT INITIATIVES FOR DIGITAL PAYMENTS TO ACT AS OPPORTUNITY IN MARKET
    4.2 NORTH AMERICA: MARKET,  BY TOP 2 SOLUTIONS AND TOP 3 VERTICALS 
           FIGURE 9 ENDPOINT AND AEROSPACE, DEFENSE, AND INTELLIGENCE TO ACCOUNT FOR LARGER SHARES IN NORTH AMERICA
    4.3 ASIA PACIFIC: MARKET,  BY TOP 3 VERTICALS & TOP 3 COUNTRIES 
           FIGURE 10 AEROSPACE, DEFENSE, AND INTELLIGENCE AND CHINA TO ACCOUNT FOR LARGER SHARES IN ASIA PACIFIC
    4.4 MARKET, BY OFFERING 
           FIGURE 11 SERVICES SEGMENT TO RECORD HIGHER CAGR
    4.5 MARKET, BY SERVICE 
           FIGURE 12 SYSTEM INTEGRATION AND INSTALLATION TO HOLD LARGEST SHARE IN 2023
    4.6 MARKET, BY APPLICATION 
           FIGURE 13 ENCRYPTION SEGMENT TO HOLD LARGEST SHARE IN 2023
 
5 DATA LOSS PREVENTION MARKET OVERVIEW AND INDUSTRY TRENDS (Page No. - 54)
    5.1 MARKET OVERVIEW 
    5.2 MARKET DYNAMICS 
           FIGURE 14 MARKET: DRIVERS, RESTRAINTS, OPPORTUNITIES,  AND CHALLENGES
           5.2.1 DRIVERS
                    5.2.1.1 Shift in data storage to public and private cloud
                    5.2.1.2 Global increase in data theft
                    5.2.1.3 Regulatory and compliance requirements
                    5.2.1.4 Use of AI and machine learning
           5.2.2 RESTRAINTS
                    5.2.2.1 Complex rules and little guarantee for data loss prevention
                    5.2.2.2 Lack of awareness
                    5.2.2.3 High operational costs
           5.2.3 OPPORTUNITIES
                    5.2.3.1 Growing need for small and medium-sized businesses to increase market penetration
                    5.2.3.2 Concerns related to insecure endpoints
                    5.2.3.3 Rapid adoption of flexible work models
           5.2.4 CHALLENGES
                    5.2.4.1 Issues related to deployment of DLP solutions
                    5.2.4.2 Growing need for enterprises to maintain compliance with data localization laws
    5.3 INDUSTRY TRENDS 
    5.4 BEST PRACTICES IN MARKET 
    5.5 VALUE CHAIN ANALYSIS 
           FIGURE 15 VALUE CHAIN FOR DATA LOSS PREVENTION WITH RESPECT TO SMALL & MEDIUM-SIZED BUSINESSES AND CONSUMERS
           5.5.1 ECOSYSTEM ANALYSIS
                    FIGURE 16 ECOSYSTEM MAP
                    TABLE 2 ROLE OF PLAYERS IN MARKET ECOSYSTEM
           5.5.2 HISTORY OF MARKET
                    FIGURE 17 HISTORY OF MARKET
                    5.5.2.1 2000s–2010s
                    5.5.2.2 2010s–2020s
                    5.5.2.3 2020s–Present
           5.5.3 REGULATORY LANDSCAPE
                    5.5.3.1 Regulatory bodies, government agencies, and other organizations
                               TABLE 3 LIST OF REGULATORY BODIES, GOVERNMENT AGENCIES, AND OTHER ORGANIZATIONS
           5.5.4 KEY CONFERENCES & EVENTS
                    TABLE 4 LIST OF CONFERENCES & EVENTS, 2023–2024
    5.6 CASE STUDY ANALYSIS 
           5.6.1 F5 HELPED ASIAN PAINTS ENHANCE ITS CUSTOMER EXPERIENCE AND DRIVE SCALABILITY
           5.6.2 ALGOSEC HELPED NCR CORPORATION ACHIEVE ZERO TRUST SECURITY
           5.6.3 MICRO FOCUS HELPED SWISSCOM AG PROTECT SENSITIVE CUSTOMER DATA IN COMPLEX ENVIRONMENT
           5.6.4 IMPERVA HELPED DISCOVERY INC. TACKLE DATA COMPLIANCE IN PUBLIC CLOUD
           5.6.5 QCON ADOPTED VERITAS’ DATA SECURITY FEATURES TO ENSURE DATA SECURITY OF ITS APPLICATIONS
           5.6.6 COHESITY HELPED TXT E-SOLUTIONS MINIMIZE DOWNTIME ISSUES RESULTING FROM SEVERAL MERGERS AND ACQUISITIONS
           5.6.7 PRICING ANALYSIS
                    TABLE 5 AVERAGE SELLING PRICE OF MARKET SOLUTIONS
                    5.6.7.1 Pricing models and trends
           5.6.8 PORTER’S FIVE FORCES ANALYSIS
                    TABLE 6 IMPACT OF PORTER’S FIVE FORCES ON MARKET
                    5.6.8.1 Threat of new entrants
                    5.6.8.2 Threat of substitutes
                    5.6.8.3 Bargaining power of buyers
                    5.6.8.4 Bargaining power of suppliers
                    5.6.8.5 Intensity of competitive rivalry
    5.7 IMPACT OF MARKET ON ADJACENT TECHNOLOGIES 
           5.7.1 TECHNOLOGY ANALYSIS
                    5.7.1.1 Content discovery and classification
                    5.7.1.2 Data encryption
                    5.7.1.3 Endpoint, cloud, and network DLP
                    5.7.1.4 Data masking and redaction
                    5.7.1.5 User and Entity Behavior Analytics (UEBA)
                    5.7.1.6 Data Activity Monitoring (DAM)
                    5.7.1.7 Machine Learning and AI
           5.7.2 PATENT ANALYSIS
                    5.7.2.1 Methodology
                    5.7.2.2 Document types
                               TABLE 7 PATENTS FILED, 2020–2023
                    5.7.2.3 Innovation and patent applications
                               FIGURE 18 NUMBER OF PATENTS GRANTED ANNUALLY, 2020–2023
                               5.7.2.3.1 Top applicants
                               FIGURE 19 TOP TEN PATENT APPLICANTS WITH HIGHEST NUMBER OF PATENT APPLICATIONS, 2020–2023
           5.7.3 DISRUPTIVE TRENDS IMPACTING BUYERS/CUSTOMERS
                    FIGURE 20 DISRUPTIVE TRENDS IMPACTING BUYERS/CUSTOMERS
           5.7.4 KEY STAKEHOLDERS & BUYING CRITERIA
                    5.7.4.1 Key stakeholders in buying process
                               FIGURE 21 INFLUENCE OF STAKEHOLDERS ON BUYING PROCESS FOR TOP THREE VERTICALS
                               TABLE 8 INFLUENCE OF STAKEHOLDERS ON BUYING PROCESS FOR TOP THREE VERTICALS
                    5.7.4.2 Buying criteria
                               FIGURE 22 KEY BUYING CRITERIA FOR TOP THREE VERTICALS
                               TABLE 9 KEY BUYING CRITERIA FOR TOP THREE VERTICALS
           5.7.5 FUTURE OF MARKET
 
6 DATA LOSS PREVENTION MARKET, BY OFFERING (Page No. - 75)
    6.1 INTRODUCTION 
           6.1.1 OFFERINGS: MARKET DRIVERS
                    FIGURE 23 SERVICES SEGMENT TO GROW AT HIGHER CAGR DURING FORECAST PERIOD
                    TABLE 10 MARKET, BY OFFERING, 2018–2022 (USD MILLION)
                    TABLE 11 MARKET, BY OFFERING, 2023–2028 (USD MILLION)
    6.2 SOLUTIONS 
           6.2.1 RISING DATA BREACHES TO DRIVE MARKET GROWTH
                    TABLE 12 SOLUTIONS: MARKET, BY REGION, 2018–2022 (USD MILLION)
                    TABLE 13 SOLUTIONS: MARKET, BY REGION, 2023–2028 (USD MILLION)
    6.3 SERVICES 
           6.3.1 GROWING NEED TO SECURE SENSITIVE INFORMATION TO DRIVE MARKET
                    TABLE 14 SERVICES: MARKET, BY REGION, 2018–2022 (USD MILLION)
                    TABLE 15 SERVICES: MARKET, BY REGION, 2023–2028 (USD MILLION)
 
7 DATA LOSS PREVENTION MARKET, BY SOLUTION (Page No. - 80)
    7.1 INTRODUCTION 
           7.1.1 SOLUTIONS: MARKET DRIVERS
                    FIGURE 24 ENDPOINT DLP TO GROW AT HIGHEST CAGR DURING FORECAST PERIOD
                    TABLE 16 MARKET, BY SOLUTION, 2018–2022 (USD MILLION)
                    TABLE 17 MARKET, BY SOLUTION, 2023–2028 (USD MILLION)
    7.2 NETWORK DLP 
           7.2.1 NEED TO PREVENT DATA LOSS TO LEAD TO ADOPTION OF DLP SOLUTIONS
                    TABLE 18 NETWORK DLP: DATA LOSS PREVENTION MARKET, BY REGION,  2018–2022 (USD MILLION)
                    TABLE 19 NETWORK DLP: MARKET, BY REGION,  2023–2028 (USD MILLION)
    7.3 STORAGE/DATA CENTER DLP 
           7.3.1 INCREASING INSIDER THREATS TO DRIVE ADOPTION OF DLP
                    TABLE 20 STORAGE/DATA CENTER DLP: MARKET, BY REGION,  2018–2022 (USD MILLION)
                    TABLE 21 STORAGE/DATA CENTER DLP: MARKET, BY REGION,  2023–2028 (USD MILLION)
    7.4 ENDPOINT DLP 
           7.4.1 RISING NEED FOR ENDPOINT SECURITY TO DRIVE MARKET GROWTH
                    TABLE 22 ENDPOINT DLP: MARKET, BY REGION,  2018–2022 (USD MILLION)
                    TABLE 23 ENDPOINT DLP: MARKET, BY REGION,  2023–2028 (USD MILLION)
    7.5 CLOUD DLP 
           7.5.1 GROWING NEED TO SECURE SENSITIVE DATA ON CLOUD FROM UNAUTHORIZED ACCESS TO DRIVE MARKET GROWTH
                    TABLE 24 CLOUD DLP: MARKET, BY REGION, 2018–2022 (USD MILLION)
                    TABLE 25 CLOUD DLP: MARKET, BY REGION, 2023–2028 (USD MILLION)
 
8 DATA LOSS PREVENTION MARKET, BY APPLICATION (Page No. - 86)
    8.1 INTRODUCTION 
           FIGURE 25 CLOUD STORAGE TO GROW AT HIGHEST CAGR FROM 2023 TO 2028
           TABLE 26 MARKET, BY APPLICATION, 2018–2022 (USD MILLION)
           TABLE 27 MARKET, BY APPLICATION, 2023–2028 (USD MILLION)
    8.2 ENCRYPTION 
           8.2.1 GROWING NEED TO ENCRYPT DATA AND PROTECT IT TO DRIVE DLP MARKET
                    TABLE 28 ENCRYPTION: MARKET, BY REGION, 2018–2022 (USD MILLION)
                    TABLE 29 ENCRYPTION: MARKET, BY REGION, 2023–2028 (USD MILLION)
    8.3 CENTRALIZED MANAGEMENT 
           8.3.1 RISING NEED TO MANAGE AND PROTECT DATA TO DRIVE MARKET
                    TABLE 30 CENTRALIZED MANAGEMENT: DATA LOSS PREVENTION MARKET, BY REGION,  2018–2022 (USD MILLION)
                    TABLE 31 CENTRALIZED MANAGEMENT: MARKET, BY REGION,  2023–2028 (USD MILLION)
    8.4 POLICIES, STANDARDS, AND PROCEDURES 
           8.4.1 RISING NEED FOR ENTERPRISES TO ENFORCE POLICIES EFFECTIVELY FOR DATA LOSS PREVENTION TO DRIVE MARKET
                    TABLE 32 POLICIES, STANDARDS, AND PROCEDURES: MARKET,  BY REGION, 2018–2022 (USD MILLION)
                    TABLE 33 POLICIES, STANDARDS, AND PROCEDURES: MARKET,  BY REGION, 2023–2028 (USD MILLION)
    8.5 WEB AND EMAIL PROTECTION 
           8.5.1 INCREASING NEED TO PROTECT DATA DIGITALLY TO DRIVE MARKET GROWTH
                    TABLE 34 WEB AND EMAIL PROTECTION: DATA LOSS PREVENTION MARKET, BY REGION,  2018–2022 (USD MILLION)
                    TABLE 35 WEB AND EMAIL PROTECTION: MARKET, BY REGION,  2023–2028 (USD MILLION)
    8.6 CLOUD STORAGE 
           8.6.1 INCREASING CLOUD STORAGE APPS AND DATA INVOLVED TO LEAD TO SIGNIFICANT MARKET GROWTH
                    TABLE 36 CLOUD STORAGE: MARKET, BY REGION,  2018–2022 (USD MILLION)
                    TABLE 37 CLOUD STORAGE: MARKET, BY REGION,  2023–2028 (USD MILLION)
    8.7 INCIDENT RESPONSE AND WORKFLOW MANAGEMENT 
           8.7.1 RISING NEED TO PREVENT DATA LEAKAGE TO DRIVE MARKET
                    TABLE 38 INCIDENT RESPONSE AND WORKFLOW MANAGEMENT: MARKET, BY REGION, 2018–2022 (USD MILLION)
                    TABLE 39 INCIDENT RESPONSE AND WORKFLOW MANAGEMENT: MARKET, BY REGION, 2023–2028 (USD MILLION)
    8.8 OTHER APPLICATIONS 
           TABLE 40 OTHER APPLICATIONS: MARKET, BY REGION,  2018–2022 (USD MILLION)
           TABLE 41 OTHER APPLICATIONS: MARKET, BY REGION,  2023–2028 (USD MILLION)
 
9 DATA LOSS PREVENTION MARKET ANALYSIS, BY SERVICE (Page No. - 95)
    9.1 INTRODUCTION 
           9.1.1 SERVICES: MARKET DRIVERS
                    FIGURE 26 SYSTEM INTEGRATION AND INSTALLATION SERVICE TO ACCOUNT FOR LARGEST MARKET SIZE IN 2028
                    TABLE 42 MARKET, BY SERVICE, 2018–2022 (USD MILLION)
                    TABLE 43 MARKET, BY SERVICE, 2023–2028 (USD MILLION)
    9.2 CONSULTING 
           9.2.1 INCREASING DATA THREATS TO BUSINESSES AND CUSTOMERS TO DRIVE MARKET
                    TABLE 44 CONSULTING: DATA LOSS PREVENTION MARKET, BY REGION, 2018–2022 (USD MILLION)
                    TABLE 45 CONSULTING: MARKET, BY REGION, 2023–2028 (USD MILLION)
    9.3 SYSTEM INTEGRATION AND INSTALLATION 
           9.3.1 GROWING CYBER ATTACKS ACROSS INDUSTRIES TO DRIVE MARKET
                    TABLE 46 SYSTEM INTEGRATION AND INSTALLATION: MARKET, BY REGION, 2018–2022 (USD MILLION)
                    TABLE 47 SYSTEM INTEGRATION AND INSTALLATION: MARKET, BY REGION, 2023–2028 (USD MILLION)
    9.4 MANAGED SECURITY SERVICE 
           9.4.1 RISING NEED TO SECURE CRITICAL DATA TO DRIVE MARKET GROWTH
                    TABLE 48 MANAGED SECURITY SERVICE: MARKET, BY REGION,  2018–2022 (USD MILLION)
                    TABLE 49 MANAGED SECURITY SERVICE: MARKET, BY REGION,  2023–2028 (USD MILLION)
    9.5 EDUCATION AND TRAINING 
           9.5.1 NEED TO IMPLEMENT DATA SECURITY AWARENESS PROGRAMS TO DRIVE DLP MARKET
                    TABLE 50 EDUCATION AND TRAINING: MARKET, BY REGION,  2018–2022 (USD MILLION)
                    TABLE 51 EDUCATION AND TRAINING: MARKET, BY REGION,  2023–2028 (USD MILLION)
    9.6 RISK AND THREAT ASSESSMENT 
           9.6.1 GROWING DATA SECURITY MANAGEMENT TO DRIVE MARKET
                    TABLE 52 RISK AND THREAT ASSESSMENT: MARKET, BY REGION,  2018–2022 (USD MILLION)
                    TABLE 53 RISK AND THREAT ASSESSMENT: MARKET, BY REGION,  2023–2028 (USD MILLION)
 
10 DATA LOSS PREVENTION MARKET, BY VERTICAL (Page No. - 102)
     10.1 INTRODUCTION 
             10.1.1 VERTICALS: MARKET DRIVERS
                       FIGURE 27 DATA LOSS PREVENTION TO WITNESS HIGH ADOPTION RATE FROM AEROSPACE, DEFENSE, AND INTELLIGENCE SECTOR IN NEXT 5 YEARS
                       TABLE 54 MARKET, BY VERTICAL, 2018–2022 (USD MILLION)
                       TABLE 55 MARKET, BY VERTICAL, 2023–2028 (USD MILLION)
     10.2 AEROSPACE, DEFENSE, AND INTELLIGENCE 
             10.2.1 INCREASING DATA BREACHES TO SUPPORT MARKET GROWTH
                       TABLE 56 AEROSPACE, DEFENSE, AND INTELLIGENCE: MARKET,  BY REGION, 2018–2022 (USD MILLION)
                       TABLE 57 AEROSPACE, DEFENSE, AND INTELLIGENCE: MARKET,  BY REGION, 2023–2028 (USD MILLION)
             10.2.2 CASE STUDY
                       10.2.2.1 United Airlines detected and blocked evolving threats
     10.3 GOVERNMENT (EXCLUDING DEFENSE) 
             10.3.1 INCREASING DATA THREATS AND CYBER ATTACKS TO DRIVE MARKET
                       TABLE 58 GOVERNMENT: DATA LOSS PREVENTION MARKET, BY REGION,  2018–2022 (USD MILLION)
                       TABLE 59 GOVERNMENT: MARKET, BY REGION,  2023–2028 (USD MILLION)
             10.3.2 CASE STUDY
                       10.3.2.1 Elche city council improved email security to protect local citizens and businesses
     10.4 BFSI (BANKING, FINANCIAL SERVICES, AND INSURANCE) 
             10.4.1 TECHNOLOGICAL ADVANCEMENTS TO SUPPORT MARKET GROWTH
                       TABLE 60 BFSI: MARKET, BY REGION, 2018–2022 (USD MILLION)
                       TABLE 61 BFSI: MARKET, BY REGION, 2023–2028 (USD MILLION)
             10.4.2 CASE STUDY
                       10.4.2.1 Lake Trust Credit Union chose Cisco SecureX
     10.5 TELECOMMUNICATION & IT 
             10.5.1 DEVELOPMENT OF INNOVATIVE TECHNOLOGIES TO DRIVE MARKET GROWTH
                       TABLE 62 TELECOMMUNICATION & IT: MARKET, BY REGION,  2018–2022 (USD MILLION)
                       TABLE 63 TELECOMMUNICATION & IT: MARKET, BY REGION,  2023–2028 (USD MILLION)
             10.5.2 CASE STUDY
                       10.5.2.1 Whispir kept internal and customer communications data secure with Proofpoint
     10.6 HEALTHCARE 
             10.6.1 INCREASING INSTANCES OF MEDICAL RECORD THEFTS TO DRIVE ADOPTION OF DLP SOLUTIONS
                       TABLE 64 HEALTHCARE: MARKET, BY REGION, 2018–2022 (USD MILLION)
                       TABLE 65 HEALTHCARE: MARKET, BY REGION, 2023–2028 (USD MILLION)
             10.6.2 CASE STUDY
                       10.6.2.1 Adventist Health consolidated multivendor firewalls for Cisco
     10.7 RETAIL & LOGISTICS 
             10.7.1 ADVANCEMENTS IN MOBILE TECHNOLOGY TO BOOST DLP MARKET
                       TABLE 66 RETAIL & LOGISTICS: DATA LOSS PREVENTION MARKET, BY REGION,  2018–2022 (USD MILLION)
                       TABLE 67 RETAIL & LOGISTICS: MARKET, BY REGION,  2023–2028 (USD MILLION)
             10.7.2 CASE STUDY
                       10.7.2.1 Matas achieved secured digital transformation and online sales expansion
     10.8 MANUFACTURING 
             10.8.1 AUTOMATION OF MANUFACTURING PROCESSES TO PROPEL ADOPTION OF DLP SOLUTIONS AND SERVICES
                       TABLE 68 MANUFACTURING: MARKET, BY REGION,  2018–2022 (USD MILLION)
                       TABLE 69 MANUFACTURING: MARKET, BY REGION,  2023–2028 (USD MILLION)
             10.8.2 CASE STUDY
                       10.8.2.1 Streamlined security accelerated manufacturing digital transformation
     10.9 ENERGY & UTILITIES 
             10.9.1 NEED TO PROTECT CUSTOMER DATA TO DRIVE MARKET GROWTH
                       TABLE 70 ENERGY & UTILITIES: MARKET, BY REGION,  2018–2022 (USD MILLION)
                       TABLE 71 ENERGY & UTILITIES: MARKET, BY REGION,  2023–2028 (USD MILLION)
             10.9.2 CASE STUDY
                       10.9.2.1 Cisco helped Albuquerque Water Authority modernize and protect critical infrastructure
     10.10 OTHER VERTICALS 
               TABLE 72 OTHER VERTICALS: MARKET, BY REGION,  2018–2022 (USD MILLION)
               TABLE 73 OTHER VERTICALS: MARKET, BY REGION,  2023–2028 (USD MILLION)
 
11 DATA LOSS PREVENTION MARKET, BY REGION (Page No. - 117)
     11.1 INTRODUCTION 
               FIGURE 28 MARKET: REGIONAL SNAPSHOT, 2023
               FIGURE 29 MARKET, BY REGION, 2023 VS. 2028 (USD MILLION)
               TABLE 74 MARKET, BY REGION, 2018–2022 (USD MILLION)
               TABLE 75 MARKET, BY REGION, 2023–2028 (USD MILLION)
     11.2 NORTH AMERICA 
             11.2.1 NORTH AMERICA: MARKET DRIVERS
             11.2.2 NORTH AMERICA: RECESSION IMPACT
                       FIGURE 30 NORTH AMERICA: MARKET SNAPSHOT
                       TABLE 76 NORTH AMERICA: DATA LOSS PREVENTION MARKET, BY OFFERING,  2018–2022 (USD MILLION)
                       TABLE 77 NORTH AMERICA: MARKET, BY OFFERING,  2023–2028 (USD MILLION)
                       TABLE 78 NORTH AMERICA: MARKET, BY SOLUTION,  2018–2022 (USD MILLION)
                       TABLE 79 NORTH AMERICA: MARKET, BY SOLUTION,  2023–2028 (USD MILLION)
                       TABLE 80 NORTH AMERICA: MARKET, BY SERVICE,  2018–2022 (USD MILLION)
                       TABLE 81 NORTH AMERICA: MARKET, BY SERVICE,  2023–2028 (USD MILLION)
                       TABLE 82 NORTH AMERICA: MARKET, BY APPLICATION,  2018–2022 (USD MILLION)
                       TABLE 83 NORTH AMERICA: MARKET, BY APPLICATION,  2023–2028 (USD MILLION)
                       TABLE 84 NORTH AMERICA: MARKET, BY VERTICAL,  2018–2022 (USD MILLION)
                       TABLE 85 NORTH AMERICA: MARKET, BY VERTICAL,  2023–2028 (USD MILLION)
                       TABLE 86 NORTH AMERICA: MARKET, BY COUNTRY,  2018–2022 (USD MILLION)
                       TABLE 87 NORTH AMERICA: MARKET, BY COUNTRY,  2023–2028 (USD MILLION)
             11.2.3 US
                       11.2.3.1 Presence of eminent companies offering DLP solutions to drive market
             11.2.4 CANADA
                       11.2.4.1 Increased adoption of DLP technologies to support market growth
     11.3 EUROPE 
             11.3.1 EUROPE: MARKET DRIVERS
             11.3.2 EUROPE: RECESSION IMPACT
                       TABLE 88 EUROPE: DATA LOSS PREVENTION MARKET, BY OFFERING, 2018–2022 (USD MILLION)
                       TABLE 89 EUROPE: MARKET, BY OFFERING, 2023–2028 (USD MILLION)
                       TABLE 90 EUROPE: MARKET, BY SOLUTION, 2018–2022 (USD MILLION)
                       TABLE 91 EUROPE: MARKET, BY SOLUTION, 2023–2028 (USD MILLION)
                       TABLE 92 EUROPE: MARKET, BY SERVICE, 2018–2022 (USD MILLION)
                       TABLE 93 EUROPE: MARKET, BY SERVICE, 2023–2028 (USD MILLION)
                       TABLE 94 EUROPE: MARKET, BY APPLICATION,  2018–2022 (USD MILLION)
                       TABLE 95 EUROPE: MARKET, BY APPLICATION,  2023–2028 (USD MILLION)
                       TABLE 96 EUROPE: MARKET, BY VERTICAL, 2018–2022 (USD MILLION)
                       TABLE 97 EUROPE: MARKET, BY VERTICAL, 2023–2028 (USD MILLION)
                       TABLE 98 EUROPE: MARKET, BY COUNTRY, 2018–2022 (USD MILLION)
                       TABLE 99 EUROPE: MARKET, BY COUNTRY, 2023–2028 (USD MILLION)
             11.3.3 UK
                       11.3.3.1 Increase in cybercrimes and thefts to propel market growth
             11.3.4 GERMANY
                       11.3.4.1 Increasing investments in DLP landscape to propel adoption of solutions and services
             11.3.5 FRANCE
                       11.3.5.1 Increasing government initiatives to strengthen adoption of DLP solutions
             11.3.6 SPAIN
                       11.3.6.1 Growing need to secure data to boost market
             11.3.7 ITALY
                       11.3.7.1 Thriving telecom sector to create opportunities for DLP solutions
             11.3.8 NORDICS
                       11.3.8.1 Increasing awareness of data security and privacy regulations to fuel market growth
             11.3.9 REST OF EUROPE
     11.4 ASIA PACIFIC 
             11.4.1 ASIA PACIFIC: MARKET DRIVERS
             11.4.2 ASIA PACIFIC: RECESSION IMPACT
                       FIGURE 31 ASIA PACIFIC: DATA LOSS PREVENTION MARKET SNAPSHOT
                       TABLE 100 ASIA PACIFIC: MARKET, BY OFFERING,  2018–2022 (USD MILLION)
                       TABLE 101 ASIA PACIFIC: MARKET, BY OFFERING,  2023–2028 (USD MILLION)
                       TABLE 102 ASIA PACIFIC: MARKET, BY SOLUTION,  2018–2022 (USD MILLION)
                       TABLE 103 ASIA PACIFIC: MARKET, BY SOLUTION,  2023–2028 (USD MILLION)
                       TABLE 104 ASIA PACIFIC: MARKET, BY SERVICE,  2018–2022 (USD MILLION)
                       TABLE 105 ASIA PACIFIC: MARKET, BY SERVICE,  2023–2028 (USD MILLION)
                       TABLE 106 ASIA PACIFIC: MARKET, BY APPLICATION,  2018–2022 (USD MILLION)
                       TABLE 107 ASIA PACIFIC: MARKET, BY APPLICATION,  2023–2028 (USD MILLION)
                       TABLE 108 ASIA PACIFIC: MARKET, BY VERTICAL,  2018–2022 (USD MILLION)
                       TABLE 109 ASIA PACIFIC: MARKET, BY VERTICAL,  2023–2028 (USD MILLION)
                       TABLE 110 ASIA PACIFIC: MARKET, BY COUNTRY,  2018–2022 (USD MILLION)
                       TABLE 111 ASIA PACIFIC: MARKET, BY COUNTRY,  2023–2028 (USD MILLION)
             11.4.3 CHINA
                       11.4.3.1 Intensive usage of internet to strengthen adoption of DLP solutions
             11.4.4 INDIA
                       11.4.4.1 Rise in adoption of DLP solutions for securing confidential data
             11.4.5 JAPAN
                       11.4.5.1 Increased cyber-attacks and need to secure data to accelerate market growth
             11.4.6 AUSTRALIA & NEW ZEALAND
                       11.4.6.1 Need to protect sensitive data and ensure compliance to drive market
             11.4.7 REST OF ASIA PACIFIC
     11.5 MIDDLE EAST & AFRICA 
             11.5.1 MIDDLE EAST & AFRICA: MARKET DRIVERS
             11.5.2 MIDDLE EAST & AFRICA: RECESSION IMPACT
                       TABLE 112 MIDDLE EAST & AFRICA: DATA LOSS PREVENTION MARKET, BY OFFERING,  2018–2022 (USD MILLION)
                       TABLE 113 MIDDLE EAST & AFRICA: MARKET, BY OFFERING,  2023–2028 (USD MILLION)
                       TABLE 114 MIDDLE EAST & AFRICA: MARKET, BY SOLUTION,  2018–2022 (USD MILLION)
                       TABLE 115 MIDDLE EAST & AFRICA: MARKET, BY SOLUTION,  2023–2028 (USD MILLION)
                       TABLE 116 MIDDLE EAST & AFRICA: MARKET, BY SERVICE,  2018–2022 (USD MILLION)
                       TABLE 117 MIDDLE EAST & AFRICA: MARKET, BY SERVICE,  2023–2028 (USD MILLION)
                       TABLE 118 MIDDLE EAST & AFRICA: MARKET, BY APPLICATION,  2018–2022 (USD MILLION)
                       TABLE 119 MIDDLE EAST & AFRICA: MARKET, BY APPLICATION,  2023–2028 (USD MILLION)
                       TABLE 120 MIDDLE EAST & AFRICA: MARKET, BY VERTICAL,  2018–2022 (USD MILLION)
                       TABLE 121 MIDDLE EAST & AFRICA: MARKET, BY VERTICAL,  2023–2028 (USD MILLION)
                       TABLE 122 MIDDLE EAST & AFRICA: MARKET, BY COUNTRY,  2018–2022 (USD MILLION)
                       TABLE 123 MIDDLE EAST & AFRICA: MARKET, BY COUNTRY,  2023–2028 (USD MILLION)
             11.5.3 UAE
                       11.5.3.1 Increasing digitalization to boost adoption of DLP solutions
             11.5.4 KINGDOM OF SAUDI ARABIA
                       11.5.4.1 Growing businesses and need to gain customer trust to propel market growth
             11.5.5 REST OF MIDDLE EAST & AFRICA
     11.6 LATIN AMERICA 
             11.6.1 LATIN AMERICA: MARKET DRIVERS
             11.6.2 LATIN AMERICA: RECESSION IMPACT
                       TABLE 124 LATIN AMERICA: DATA LOSS PREVENTION MARKET, BY OFFERING,  2018–2022 (USD MILLION)
                       TABLE 125 LATIN AMERICA: MARKET, BY OFFERING,  2023–2028 (USD MILLION)
                       TABLE 126 LATIN AMERICA: MARKET, BY SOLUTION,  2018–2022 (USD MILLION)
                       TABLE 127 LATIN AMERICA: MARKET, BY SOLUTION,  2023–2028 (USD MILLION)
                       TABLE 128 LATIN AMERICA: MARKET, BY SERVICE,  2018–2022 (USD MILLION)
                       TABLE 129 LATIN AMERICA: MARKET, BY SERVICE,  2023–2028 (USD MILLION)
                       TABLE 130 LATIN AMERICA: MARKET, BY APPLICATION,  2018–2022 (USD MILLION)
                       TABLE 131 LATIN AMERICA: MARKET, BY APPLICATION,  2023–2028 (USD MILLION)
                       TABLE 132 LATIN AMERICA: MARKET, BY VERTICAL,  2018–2022 (USD MILLION)
                       TABLE 133 LATIN AMERICA: MARKET, BY VERTICAL,  2023–2028 (USD MILLION)
                       TABLE 134 LATIN AMERICA: MARKET, BY COUNTRY,  2018–2022 (USD MILLION)
                       TABLE 135 LATIN AMERICA: MARKET, BY COUNTRY  2023–2028 (USD MILLION)
             11.6.3 BRAZIL
                       11.6.3.1 Increasing penetration of mobiles and internet to drive market
             11.6.4 MEXICO
                       11.6.4.1 Rising incidences of data crimes to propel market
             11.6.5 REST OF LATIN AMERICA
 
12 COMPETITIVE LANDSCAPE (Page No. - 154)
     12.1 INTRODUCTION 
     12.2 STRATEGIES ADOPTED BY KEY PLAYERS 
               TABLE 136 OVERVIEW OF STRATEGIES ADOPTED BY KEY PLAYERS
     12.3 HISTORICAL REVENUE ANALYSIS 
               FIGURE 32 HISTORICAL REVENUE ANALYSIS OF KEY PLAYERS, 2020–2022 (USD MILLION)
     12.4 MARKET SHARE ANALYSIS 
               TABLE 137 MARKET: INTENSITY OF COMPETITIVE RIVALRY
     12.5 COMPANY EVALUATION MATRIX 
             12.5.1 STARS
             12.5.2 EMERGING LEADERS
             12.5.3 PERVASIVE PLAYERS
             12.5.4 PARTICIPANTS
                       FIGURE 33 DATA LOSS PREVENTION MARKET: COMPANY EVALUATION MATRIX, 2023
             12.5.5 COMPANY FOOTPRINT
                       TABLE 138 COMPANY FOOTPRINT
     12.6 STARTUP/SME EVALUATION MATRIX 
             12.6.1 PROGRESSIVE COMPANIES
             12.6.2 RESPONSIVE COMPANIES
             12.6.3 DYNAMIC COMPANIES
             12.6.4 STARTING BLOCKS
                       FIGURE 34 MARKET: STARTUP/SME EVALUATION MATRIX, 2023
             12.6.5 COMPETITIVE BENCHMARKING
                       TABLE 139 DETAILED LIST OF STARTUPS/SMES
                       TABLE 140 COMPETITIVE BENCHMARKING OF STARTUPS/SMES
     12.7 COMPETITIVE SCENARIO AND TRENDS 
             12.7.1 PRODUCT LAUNCHES
                       TABLE 141 MARKET: PRODUCT LAUNCHES, FEBRUARY 2021–SEPTEMBER 2023
             12.7.2 DEALS
                       TABLE 142 DATA LOSS PREVENTION MARKET: DEALS, APRIL 2021–SEPTEMBER 2023
 
13 COMPANY PROFILES (Page No. - 169)
     13.1 KEY PLAYERS 
(Business overview, Products/Solutions/Services offered, Recent developments, MnM view, Right to win, Strategic choices, and Weaknesses and Competitive threats)*
             13.1.1 BROADCOM INC.
                       TABLE 143 BROADCOM INC.: COMPANY OVERVIEW
                       FIGURE 35 BROADCOM INC.: COMPANY SNAPSHOT
                       TABLE 144 BROADCOM INC.: PRODUCTS/SOLUTIONS/SERVICES OFFERED
                       TABLE 145 BROADCOM INC.: DEALS
             13.1.2 TREND MICRO
                       TABLE 146 TREND MICRO: COMPANY OVERVIEW
                       FIGURE 36 TREND MICRO: COMPANY SNAPSHOT
                       TABLE 147 TREND MICRO: PRODUCTS/SOLUTIONS/SERVICES OFFERED
                       TABLE 148 TREND MICRO: DEALS
             13.1.3 MCAFEE
                       TABLE 149 MCAFEE: COMPANY OVERVIEW
                       TABLE 150 MCAFEE: PRODUCTS/SOLUTIONS/SERVICES OFFERED
                       TABLE 151 MCAFEE: PRODUCT LAUNCHES AND ENHANCEMENTS
                       TABLE 152 MCAFEE: DEALS
             13.1.4 CISCO
                       TABLE 153 CISCO: BUSINESS OVERVIEW
                       FIGURE 37 CISCO: COMPANY SNAPSHOT
                       TABLE 154 CISCO: PRODUCTS/SOLUTIONS/SERVICES OFFERED
                       TABLE 155 CISCO: PRODUCT LAUNCHES AND ENHANCEMENTS
                       TABLE 156 CISCO: DEALS
             13.1.5 IBM
                       TABLE 157 IBM: COMPANY OVERVIEW
                       FIGURE 38 IBM: COMPANY SNAPSHOT
                       TABLE 158 IBM: PRODUCTS/SOLUTIONS/SERVICES OFFERED
                       TABLE 159 IBM: PRODUCT LAUNCHES
                       TABLE 160 IBM: DEALS
             13.1.6 MICROSOFT
                       TABLE 161 MICROSOFT: COMPANY OVERVIEW
                       FIGURE 39 MICROSOFT: COMPANY SNAPSHOT
                       TABLE 162 MICROSOFT: PRODUCTS/SOLUTIONS/SERVICES OFFERED
                       TABLE 163 MICROSOFT: PRODUCT LAUNCHES AND ENHANCEMENTS
                       TABLE 164 MICROSOFT: DEALS
             13.1.7 FORTRA
                       TABLE 165 FORTRA: COMPANY OVERVIEW
                       TABLE 166 FORTRA: PRODUCTS/SOLUTIONS/SERVICES OFFERED
                       TABLE 167 FORTRA: PRODUCT LAUNCHES AND ENHANCEMENTS
                       TABLE 168 FORTRA: DEALS
             13.1.8 GTB TECHNOLOGIES
                       TABLE 169 GTB TECHNOLOGIES: COMPANY OVERVIEW
                       TABLE 170 GTB TECHNOLOGIES: PRODUCTS/SOLUTIONS/SERVICES OFFERED
                       TABLE 171 GTB TECHNOLOGIES: PRODUCT LAUNCHES AND ENHANCEMENTS
                       TABLE 172 GTB TECHNOLOGIES: DEALS
             13.1.9 INFOWATCH
                       TABLE 173 INFOWATCH: COMPANY OVERVIEW
                       TABLE 174 INFOWATCH: PRODUCTS/SOLUTIONS/SERVICES OFFERED
             13.1.10 PALO ALTO NETWORKS
                       TABLE 175 PALO ALTO NETWORKS: COMPANY OVERVIEW
                       FIGURE 40 PALO ALTO NETWORKS: COMPANY SNAPSHOT
                       TABLE 176 PALO ALTO NETWORKS: PRODUCTS/SOLUTIONS/SERVICES OFFERED
                       TABLE 177 PALO ALTO NETWORKS: PRODUCT LAUNCHES AND ENHANCEMENTS
                       TABLE 178 PALO ALTO NETWORKS: DEALS
     13.2 MAJOR PLAYERS 
             13.2.1 ZSCALER
             13.2.2 NETSKOPE
             13.2.3 CROWDSTRIKE
             13.2.4 ZECURION
             13.2.5 SOPHOS
             13.2.6 PROOFPOINT
     13.3 OTHER PLAYERS/STARTUPS 
             13.3.1 SPIRION
             13.3.2 COSOSYS (ENDPOINT PROTECTOR)
             13.3.3 CHECK POINT SOFTWARE TECHNOLOGIES LTD.
             13.3.4 SECURETRUST
             13.3.5 PERIMETER 81
             13.3.6 MIMECAST
             13.3.7 TESSIAN
             13.3.8 DOCONTROL
             13.3.9 SAFETICA
             13.3.10 CYBERHAVEN
             13.3.11 TERAMIND
*Details on Business overview, Products/Solutions/Services offered, Recent developments, MnM view, Right to win, Strategic choices, and Weaknesses and Competitive threats might not be captured in case of unlisted companies.
 
14 ADJACENT/RELATED MARKETS (Page No. - 219)
     14.1 INTRODUCTION TO ADJACENT MARKETS 
               TABLE 179 ADJACENT MARKETS AND FORECASTS
     14.2 LIMITATIONS 
     14.3 CYBERSECURITY MARKET 
               TABLE 180 CYBERSECURITY MARKET, BY COMPONENT, 2016–2021 (USD MILLION)
               TABLE 181 CYBERSECURITY MARKET, BY COMPONENT, 2022–2027 (USD MILLION)
               TABLE 182 CYBERSECURITY MARKET, BY SOFTWARE, 2016–2021 (USD MILLION)
               TABLE 183 CYBERSECURITY MARKET, BY SOFTWARE, 2022–2027 (USD MILLION)
               TABLE 184 CYBERSECURITY MARKET, BY SERVICE, 2016–2021 (USD MILLION)
               TABLE 185 CYBERSECURITY MARKET, BY SERVICE, 2022–2027 (USD MILLION)
               TABLE 186 CYBERSECURITY MARKET, BY SECURITY TYPE, 2016–2021 (USD MILLION)
               TABLE 187 CYBERSECURITY MARKET, BY SECURITY TYPE, 2022–2027 (USD MILLION)
               TABLE 188 CYBERSECURITY MARKET, BY DEPLOYMENT MODE, 2016–2021 (USD MILLION)
               TABLE 189 CYBERSECURITY MARKET, BY DEPLOYMENT MODE, 2022–2027 (USD MILLION)
               TABLE 190 CYBERSECURITY MARKET, BY ORGANIZATION SIZE, 2016–2021 (USD MILLION)
               TABLE 191 CYBERSECURITY MARKET, BY ORGANIZATION SIZE, 2022–2027 (USD MILLION)
               TABLE 192 CYBERSECURITY MARKET, BY VERTICAL, 2016–2021 (USD MILLION)
               TABLE 193 CYBERSECURITY MARKET, BY VERTICAL, 2022–2027 (USD MILLION)
               TABLE 194 CYBERSECURITY MARKET, BY REGION, 2016–2021 (USD MILLION)
               TABLE 195 CYBERSECURITY MARKET, BY REGION, 2022–2027 (USD MILLION)
     14.4 FRAUD DETECTION AND PREVENTION MARKET 
               TABLE 196 FRAUD DETECTION AND PREVENTION MARKET, BY FRAUD TYPE,  2017–2022 (USD MILLION)
               TABLE 197 FRAUD DETECTION AND PREVENTION MARKET, BY FRAUD TYPE,  2023–2028 (USD MILLION)
               TABLE 198 FRAUD DETECTION AND PREVENTION MARKET, BY OFFERING,  2017–2022 (USD MILLION)
               TABLE 199 FRAUD DETECTION AND PREVENTION MARKET, BY OFFERING,  2023–2028 (USD MILLION)
               TABLE 200 FRAUD DETECTION AND PREVENTION MARKET, BY DEPLOYMENT MODE,  2017–2022 (USD MILLION)
               TABLE 201 FRAUD DETECTION AND PREVENTION MARKET, BY DEPLOYMENT MODE,  2023–2028 (USD MILLION)
               TABLE 202 FRAUD DETECTION AND PREVENTION MARKET, BY ORGANIZATION SIZE,  2017–2022 (USD MILLION)
               TABLE 203 FRAUD DETECTION AND PREVENTION MARKET, BY ORGANIZATION SIZE,  2023–2028 (USD MILLION)
               TABLE 204 FRAUD DETECTION AND PREVENTION MARKET, BY VERTICAL, 2017–2022 (USD MILLION)
               TABLE 205 FRAUD DETECTION AND PREVENTION MARKET, BY VERTICAL, 2023–2028 (USD MILLION)
               TABLE 206 FRAUD DETECTION AND PREVENTION MARKET, BY REGION, 2017–2022 (USD MILLION)
               TABLE 207 FRAUD DETECTION AND PREVENTION MARKET, BY REGION, 2023–2028 (USD MILLION)
 
15 APPENDIX (Page No. - 229)
     15.1 DISCUSSION GUIDE 
     15.2 KNOWLEDGESTORE: MARKETSANDMARKETS’  SUBSCRIPTION PORTAL 
     15.3 CUSTOMIZATION OPTIONS 
     15.4 RELATED REPORTS 
     15.5 AUTHOR DETAILS 

The study involved four major activities in estimating the current size of the global Data Loss Prevention market. In the first step, exhaustive secondary research collected information on the market, peer, and parent markets. The next step was to validate these findings, assumptions, and sizing with industry experts across the value chain through primary research. Both top-down and bottom-up approaches were employed to estimate the total Data Loss Prevention market size. After that, the market breakup and data triangulation techniques were used to estimate the market size of segments and subsegments.

Secondary Research

In the secondary research process, various secondary sources, such as Bloomberg and BusinessWeek, have been referred to identify and collect information for this study. The secondary sources included annual reports, press releases, investor presentations of companies, white papers, journals, such as Linux Journal and Container Journal, and articles from recognized authors, directories, and databases.

Primary Research

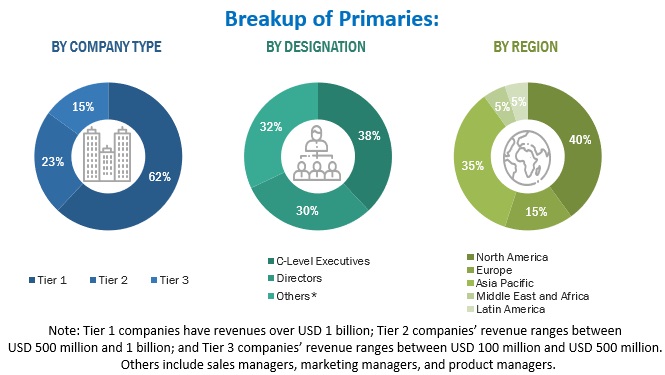
Various primary sources from the supply and demand sides were interviewed to obtain qualitative and quantitative information for this report. The primary sources from the supply side included industry experts, such as Chief Executive Officers (CEOs), Chief Marketing Officers (CMO), Vice Presidents (VPs), Managing Directors (MDs), technology and innovation directors, and related key executives from various key companies and organizations operating in the Data Loss Prevention market along with the associated service providers, and system integrators working in the targeted regions. All possible parameters that affect the market covered in this research study have been accounted for, viewed in extensive detail, verified through primary research, and analyzed to get the final quantitative and qualitative data. Following is the breakup of primary respondents.
Data Loss Prevention Market Size, and Share

To know about the assumptions considered for the study, download the pdf brochure

Market Size Estimation

The top-down and bottom-up approaches were used to estimate and forecast the Data Loss Prevention market and other dependent submarkets. The bottom-up procedure was used to arrive at the overall market size of the global market using key companies’ revenue and their offerings in the market. The research methodology used to estimate the market size includes the following:

  • The key players in the Data Loss Prevention market have been identified through extensive secondary research.
  • Regarding value, the market size has been determined through primary and secondary research processes.
  • All percentage shares, splits, and breakups have been determined using secondary sources and verified through primary sources.

Data Loss Prevention Market Size: Bottom-Up Approach

Data Loss Prevention Market Size, and Share

To know about the assumptions considered for the study, Request for Free Sample Report

Data Loss Prevention Market Size: Top-Down Approach

Data Loss Prevention Market Size, and Share

Data Triangulation

With data triangulation and validation through primary interviews, this study determined and confirmed the exact value of the overall parent market size. The overall market size was then used in the top-down procedure to estimate the size of other individual markets via percentage splits of the market segmentation.

Market Definition

DLP is a set of technologies that help prevent data breaches of sensitive information that may occur in enterprises across the globe. The DLP solutions mainly focus on the classification and monitoring of data that may be in motion, at rest, or an endpoint, as these solutions provide enterprises with the leverage to stop the numerous leaks of information that occur each day. In other words, the main aim of the DLP solutions is to detect potential data breaches that may occur at different levels. The DLP market is mainly classified based on its applications into network DLP, storage/data center DLP, and endpoint DLP. The applications together constitute the global DLP market.

Key Stakeholders

  • DLP vendors
  • Solution providers
  • System integrators
  • Value-Added Resellers (VARs)
  • Service providers and distributors
  • Government agencies
  • Large enterprises

Report Objectives

  • To determine, segment, and forecast the global Data Loss Prevention market by offering solution types, services, applications, verticals, and regions in terms of value.
  • To forecast the size of the market segments to five main regions: North America, Europe, Asia Pacific, Middle East and Africa, and Latin America 
  • To provide detailed information about the major factors (drivers, opportunities, threats, and challenges) influencing the growth of the market
  • To study the complete value chain and related industry segments and perform a value chain analysis of the market landscape.
  • To strategically analyze the macro and micro markets to individual growth trends, prospects, and contributions to the total market
  • To analyze the industry trends, pricing data, patents, and innovations related to the market.
  • To analyze the opportunities for stakeholders by identifying the high-growth segments of the Data Loss Prevention market
  • To profile the key players in the market and comprehensively analyze their market share/ranking and core competencies.
  • Track and analyze competitive developments, such as mergers and acquisitions, product launches and developments, partnerships, agreements, collaborations, business expansions, and Research & Development (R&D) activities.

Available Customizations

With the given market data, MarketsandMarkets offers customizations per the company’s specific needs. The following customization options are available for the report:

Company Information

  • Detailed analysis and profiling of an additional two market players
Custom Market Research Services

We will customize the research for you, in case the report listed above does not meet with your exact requirements. Our custom research will comprehensively cover the business information you require to help you arrive at strategic and profitable business decisions.

Request Customization
Report Code
TC 1105
Published ON
Oct, 2023
Choose License Type
BUY NOW
  • SHARE
X
Request Customization
Speak to Analyst
Speak to Analyst
OR FACE-TO-FACE MEETING
PERSONALIZE THIS RESEARCH
  • Triangulate with your Own Data
  • Get Data as per your Format and Definition
  • Gain a Deeper Dive on a Specific Application, Geography, Customer or Competitor
  • Any level of Personalization
REQUEST A FREE CUSTOMIZATION
LET US HELP YOU!
  • What are the Known and Unknown Adjacencies Impacting the Data Loss Prevention Market
  • What will your New Revenue Sources be?
  • Who will be your Top Customer; what will make them switch?
  • Defend your Market Share or Win Competitors
  • Get a Scorecard for Target Partners
CUSTOMIZED WORKSHOP REQUEST
  • Call Us
  • +1-888-600-6441 (Corporate office hours)
  • +1-888-600-6441 (US/Can toll free)
  • +44-800-368-9399 (UK office hours)
CONNECT WITH US
ABOUT TRUST ONLINE
©2024 MarketsandMarkets Research Private Ltd. All rights reserved
DMCA.com Protection Status Website Feedback