Metabolic Testing Market by Product (CPET, Body Composition Analysis, ECG, Portable System), by Application (Critical Care, Lifestyle Diseases), by Technology (REE, Body Composition Analysis), by End User (Gym, Sports, Hospital) - Global Forecast to 2019


The global metabolic testing market is expected to reach $475.75 million by 2019 from $332.78 million in 2014, growing at a CAGR of 7.41% between 2014 and 2019. Rising prevalence of lifestyle diseases is the primary growth driver for this market during the forecast period (2014�2019). Moreover, technological advancements and increasing healthcare expenditure are also expected to drive market growth. However, high cost of equipment and software and reimbursement issues may hinder the growth of this market.
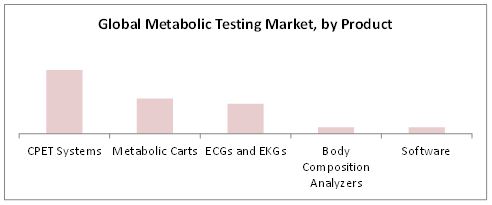
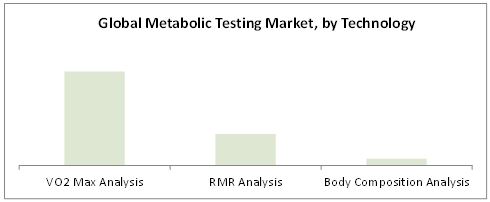
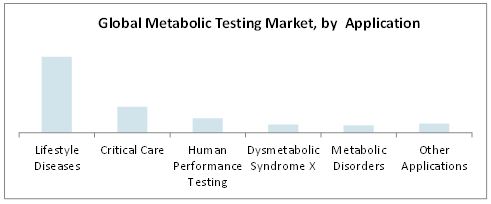
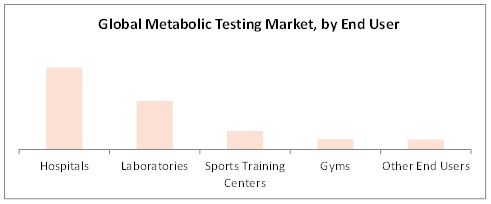
The global metabolic testing market is segmented on the basis of products, technologies, applications, end users, and regions. On the basis of products, the market is segmented into CPET systems, metabolic carts, ECGs and EKGs, body composition analyzers, and software. By technology, the market is divided into VO2 max analysis, RMR analysis, and body composition analysis. By application, the market is divided into lifestyle diseases, critical care, human performance testing, dysmetabolic syndrome X, metabolic disorders, and other applications. By end user, the market is segmented into hospitals, laboratories, sports training centers, gyms, and other end users.
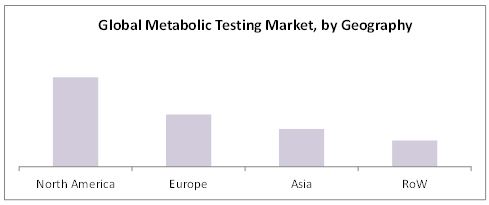
The geographic segments included in the report are Asia, Europe, North America, and the Rest of the World (RoW). Geographic analysis reveals that North America accounted for the largest share of the global metabolic market in 2014. Growth in this market can be attributed to the rising prevalence of lifestyle diseases. The Asian regional segment, on the other hand, is expected to register a higher growth rate from 2014 to 2019, owing to the rising standard of living, growing demand for quality medical care, increasing healthcare spending, government initiatives, and enhanced awareness about healthcare in this region.
The major players of this Metabolic Testing Market are CareFusion Corporation (U.S.), MGC Diagnostics Corporation (U.S.), COSMED (Italy), CORTEX Biophysik GmbH (Germany), Geratherm Medical AG (Germany), General Electric Company (U.S.), OSI Systems, Inc. (U.S.), KORR Medical Technologies, Inc. (U.S.), AEI Technologies, Inc. (U.S.), Parvo Medics (U.S.), and Microlife Medical Home Solutions, Inc. (U.S.).
Metabolic Testing Market : Scope of the Report
This research report categorizes the global metabolic testing market into the following segments and subsegments:
Global Metabolic Testing Market, by Product
- CPET Systems
- Portable Systems
- Bench-top Systems
- Metabolic Carts
- Portable Systems
- Bench-top Systems
- Body Composition Analyzers
- Portable Systems
- Bench-top Systems
- ECGs/EKGs Attachable to CPET Systems
- Portable Systems
- Bench-top Systems
- Software
Global Metabolic Testing Market, by Application
- Lifestyle Diseases
- Critical Care
- Human Performance Testing
- Dysmetabolic Syndrome X
- Metabolic Disorders
- Other Applications
Global Metabolic Testing Market, by Technology
- VO2 Max Analysis
- RMR Analysis
- Body Composition Analysis
Global Metabolic Testing Market, by End User
- Hospitals
- Laboratories
- Sports Training Centers
- Gyms
- Other End Users
Global Metabolic Testing Market, by Geography
- Asia
- Europe
- North America
- RoW
Customization Options for Metabolic Testing Report
- Option 1 Additional Geographic Segments
- North America
- Canada
- U.S.
- Europe
- France
- Germany
- Italy
- Spain
- U.K
- Rest of Europe
- Asia
- China
- India
- Japan
- Rest of Asia
- Japan
- Rest of Asia
- RoW
- Latin America
- Middle East and Africa
- Pacific and Oceania
- North America
- Option 2 Additional Company Profiles
- Lode Holding BV (Netherlands)
- Qubit Systems Inc. (Canada)
- Monark Exercise AB (Sweden)
- Ganshorn Medizin Electronic GmbH (Germany)
- Option 3 Additional Sub-segment in Products Segments
- Other Products
- Ergometers
- Treadmills
- Accessories
The global metabolic testing market is expected to reach $475.75 million by 2019 from $332.78 million in 2014, at a CAGR of 7.41% during the forecast period of 2014 to 2019.
Metabolic testing equipment estimate the metabolic potential of an individual to determine their health and wellness. Metabolic testing equipment and software assist physicians and exercise physiologists to identify the risks of lifestyle disorders at an early stage and aid in the critical care of ICU patients. These equipments are also utilized in human performance testing for athletes and for commercial weight management programs. The lifestyle diseases segment accounted for the largest application segment of the metabolic testing market in 2014.
The report provides a granular understanding of the metabolic testing market. This report segments the global market on the basis of products, technologies, applications, and end users. In 2014, the CPET systems product segment accounted for the largest share of the market. The VO2 max analysis, lifestyle diseases, and hospitals segments accounted for the largest shares of this market, by technology, application, and user, respectively.
The major players of this market are CareFusion Corporation (U.S.), MGC Diagnostics Corporation (U.S.), COSMED (Italy), CORTEX Biophysik GmbH (Germany), Geratherm Medical AG (Germany), General Electric Company (U.S.), OSI Systems, Inc. (U.S.), KORR Medical Technologies, Inc. (U.S.), AEI Technologies, Inc. (U.S.), Parvo Medics (U.S.), and Microlife Medical Home Solutions, Inc. (U.S.).
Global Metabolic Testing Market Snapshot, 2014 ($Million)
Source: MarketsandMarkets Analysis
 Exclusive indicates content/data unique to MarketsandMarkets and not available with any competitors.
Table of Contents
1 Introduction (Page No. - 14)
1.1 Objectives of the Study
1.2 Market Definition
1.3 Market Scope
1.3.1 Markets Covered
1.3.2 Years Considered for the Study
1.4 Currency
1.5 Stakeholders
2 Research Methodology (Page No. - 16)
2.1 Market Size Estimation
2.2 Market Breakdown and Data Triangulation
2.3 Market Share Estimation
2.3.1 Key Data From Secondary Sources
2.3.2 Key Data From Primary Sources
2.3.3 Assumptions for the Study
3 Executive Summary (Page No. - 22)
4 Premium Insights (Page No. - 27)
4.1 Metabolic Testing Market to Experience Significant Growth
4.2 Life Cycle Analysis, By Region
5 Market Overview (Page No. - 31)
5.1 Introduction
5.2 Market Segmentation
5.2.1 Metabolic Testing Market, By Product
5.2.2 Market, By Application
5.2.3 Market, By Test
5.2.4 Market, By End User
5.3 Market Dynamics
5.3.1 Drivers
5.3.1.1 Increasing Healthcare Expenditure
5.3.1.2 Rising Incidence of Lifestyle Diseases
5.3.1.3 Technological Advancements
5.3.2 Restraints
5.3.2.1 High Cost of Equipment and Software
5.3.2.2 Reimbursement Issues
5.3.3 Opportunities
5.3.3.1 Emerging Economies
6 Industry Insights (Page No. - 37)
6.1 Introduction
6.2 Porter�s Five Forces Analysis
6.2.1 Threat From New Entrants
6.2.2 Threat of Substitutes
6.2.3 Bargaining Power of Buyers
6.2.4 Bargaining Power of Suppliers
6.2.5 Intensity of Rivalry
6.3 Strategic Benchmarking
6.4 Supply Chain Analysis
6.4.1 Key Influencer
7 Metabolic Testing Market, By Product (Page No. - 41)
7.1 Introduction
7.2 CPET Systems
7.3 Metabolic Carts
7.4 ECG and EKG Systems
7.5 Body Composition Analyzers
7.6 Software
8 Metabolic Testing Market, By Application (Page No. - 52)
8.1 Introduction
8.2 Lifestyle Diseases
8.3 Critical Care
8.4 Human Performance Testing
8.5 Dysmetabolic Syndrome X
8.6 Metabolic Disorders
8.7 Other Applications
9 Metabolic Testing Market, By Technology (Page No. - 63)
9.1 Introduction
9.2 VO2 Max Analysis
9.3 RMR Analysis
9.4 Body Composition Analysis
10 Metabolic Testing Market, By End User (Page No. - 70)
10.1 Introduction
10.2 Hospitals
10.3 Laboratories
10.4 Sports Training Centers
10.5 GYMS
10.6 Other End Users
11 Geographic Analysis (Page No. - 79)
11.1 Introduction
11.2 North America
11.3 Europe
11.4 Asia
11.5 Rest of the World
12 Competitive Landscape (Page No. - 111)
12.1 Overview
12.2 Leading Players in the Metabolic Testing Market
12.3 Competitive Situation and Trends
12.3.1 New Product Launches
12.3.2 Agreements and Partnerships
12.3.3 Acquisitions
12.3.4 Expansions
12.3.5 Other Developments
13 Company Profiles (Page No. - 121)
13.1 Introduction
13.2 Carefusion Corporation
13.2.1 Business Overview
13.2.2 Product Portfolio
13.2.3 Recent Developments
13.2.4 MNM View
13.2.4.1 Financial Analysis
13.2.4.2 Strategic Analysis
13.3 General Electric Company
13.3.1 Business Overview
13.3.2 Product Portfolio
13.3.3 Recent Developments
13.3.4 MNM View
13.3.4.1 Financial Analysis
13.4 Geratherm Medical AG
13.4.1 Business Overview
13.4.2 Product Portfolio
13.4.3 Recent Developments
13.4.4 MNM View
13.4.4.1 Financial Analysis
13.5 MGC Diagnostics Corporation
13.5.1 Business Overview
13.5.2 Product Portfolio
13.5.3 Recent Developments
13.5.4 MNM View
13.5.4.1 Financial Analysis
13.5.4.2 Strategic Analysis
13.6 OSI Systems, Inc.
13.6.1 Business Overview
13.6.2 Product Portfolio
13.6.3 Recent Developments
13.6.4 MNM View
13.6.4.1 Financial Analysis
13.6.4.2 Strategic Analysis
13.7 AEI Technologies, Inc.
13.7.1 Business Overview
13.7.2 Product Portfolio
13.7.3 Recent Developments
13.7.4 Key Strategy
13.8 Cortex Biophysik GMBH
13.8.1 Business Overview
13.8.2 Product Portfolio
13.8.3 Recent Developments
13.8.4 Key Strategy
13.9 Cosmed
13.9.1 Business Overview
13.9.2 Product Portfolio
13.9.3 Recent Developments
13.9.4 Key Strategy
13.1 Korr Medical Technologies, Inc.
13.10.1 Business Overview
13.10.2 Product Portfolio
13.10.3 Recent Developments
13.10.4 Key Strategy
13.11 Microlife Medical Home Solutions, Inc.
13.11.1 Business Overview
13.11.2 Product Portfolio
13.11.3 Recent Developments
13.11.4 Key Strategy
13.12 Parvo Medics
13.12.1 Business Overview
13.12.2 Product Portfolio
13.12.3 Recent Developments
13.12.4 Key Strategy
14 Appendix (Page No. - 144)
14.1 Insights of Industry Experts
14.2 Discussion Guide
14.3 Introducing RT: Real-Time Market Intelligence
14.4 Available Customizations
14.5 Related Reports
List of Tables (68 Tables)
Table 1 Metabolic Testing Market Summary
Table 2 Market Developments Between 2010 and 2014
Table 3 Global Metabolic Testing Market Size, By Product, 2012�2019 ($Million)
Table 4 Market Size for CPET Systems, By Region, 2012-2019 ($Million)
Table 5 Market Size for CPET Systems, By Type, 2012-2019 ($Million)
Table 6 Metabolic Carts Market Size, By Region, 2012-2019 ($Million)
Table 7 Metabolic Carts Market Size, By Type, 2012-2019 ($Million)
Table 8 Market Size for ECG and EKG Systems, By Region, 2012-2019 ($Million)
Table 9 Market Size for ECG and EKG Systems, By Type, 2012-2019 ($Million)
Table 10 Market Size for Body Composition Analyzers, By Region, 2012-2019 ($Million)
Table 11 Market Size for Body Composition Analyzers, By Type, 2012-2019 ($Million)
Table 12 Market Size for Software, By Region, 2012-2019 ($Million)
Table 13 Market Size, By Application, 2012�2019 ($Million)
Table 14 Market Size for Lifestyle Diseases, By Region, 2012�2019 ($Million)
Table 15 Market Size for Critical Care, By Region, 2012�2019 ($Million)
Table 16 Market Size for Human Performance Testing, By Region, 2012�2019 ($Million)
Table 17 Market Size for Dysmetabolic Syndrome X , By Region, 2012�2019 ($Million)
Table 18 Market Size for Metabolic Disorders, By Region, 2012�2019 ($Million)
Table 19 Market Size for Other Applications, By Region, 2012�2019 ($Million)
Table 20 Market Size, By Technology, 2012�2019 ($Million)
Table 21 VO2 Max Analysis Market Size, By Region, 2012�2019 ($Million)
Table 22 RMR Analysis Market Size, By Region, 2012�2019 ($Million)
Table 23 Body Composition Analysis Market Size, By Region, 2012�2019 ($Million)
Table 24 Market Size, By End User, 2012�2019 ($Million)
Table 25 Market Size for Hospitals, By Region, 2012�2019 ($Million)
Table 26 Market Size for Laboratories, By Region, 2012�2019 ($Million)
Table 27 Market Size for Sports Training Centers, By Region, 2012�2019 ($Million)
Table 28 Market Size for GYMS, By Region, 2012�2019 ($Million)
Table 29 Market Size for Other End Users, By Region, 2012�2019 ($Million)
Table 30 Market, By Region, 2012�2019 ($Million)
Table 31 North America: Market Size, By Product, 2012�2019 ($Million)
Table 32 North America: CPET Systems Market, By Type, 2012�2019 ($Million)
Table 33 North America: Metabolic Carts Market, By Type, 2012�2019 ($Million)
Table 34 North America: ECG and EKG Systems Market, By Type, 2012�2019 ($Million)
Table 35 North America: Body Composition Analyzers Market, By Type, 2012�2019 ($Million)
Table 36 North America: Market, By Application, 2012�2019 ($Million)
Table 37 North America: Market, By Technology, 2012�2019 ($Million)
Table 38 North America: Market, By End User, 2012�2019 ($Million)
Table 39 Europe: Market, By Products, 2012�2019 ($Million)
Table 40 Europe: CPET Systems Market, By Type, 2012�2019 ($Million))
Table 41 Europe: Metabolic Carts Market, By Type, 2012�2019 ($Million)
Table 42 Europe: ECG and EKG Systems Market, By Type, 2012�2019 ($Million)
Table 43 Europe: Body Composition Analyzers Market, By Type, 2012�2019 ($Million)
Table 44 Europe: Market, By Application, 2012�2019 ($Million)
Table 45 Europe: Market, By Technology, 2012�2019 ($Million)
Table 46 Europe: Market, By End User, 2012�2019 ($Million)
Table 47 Asia: Market, By Product, 2012�2019 ($Million)
Table 48 Asia: CPET Systems Market, By Type, 2012�2019 ($Million))
Table 49 Asia: Metabolic Carts Market, By Type, 2012�2019 ($Million)
Table 50 Asia: ECG and EKG Systems Market, By Type, 2012�2019 ($Million)
Table 51 Asia: Body Composition Analyzers Market, By Type, 2012�2019 ($Million)
Table 52 Asia: Metabolic Testing Market, By Application, 2012�2019 ($Million)
Table 53 Asia: Metabolic Testing Market, By Technology, 2012�2019 ($Million)
Table 54 Asia: Metabolic Testing Market, By End User, 2012�2019 ($Million)
Table 55 ROW: Market, By Product, 2012�2019 ($Million)
Table 56 ROW: CPET Systems Market, By Type, 2012�2019 ($Million)
Table 57 ROW: Metabolic Carts Market, By Type, 2012�2019 ($Million)
Table 58 ROW: ECG and EKG Systems Market, By Type, 2012�2019 ($Million)
Table 59 ROW: Body Composition Analyzers Market, By Type, 2012�2019 ($Million)
Table 60 ROW: Metabolic Testing Market, By Application, 2012�2019 ($Million)
Table 61 ROW: Metabolic Testing Market, By Technology, 2012�2019 ($Million)
Table 62 ROW: Metabolic Testing Market, By End User, 2012�2019 ($Million)
Table 63 Rank of Companies in the Global Metabolic Testing Market
Table 64 New Product Launches, 2011�2014
Table 65 Agreements and Partnerships, 2011�2014
Table 66 Acquisitions, 2011�2014
Table 67 Expansions, 2011�2014
Table 68 Other Developments, 2011�2014
List of Figures (88 Figures)
Figure 1 Metabolic Testing Market
Figure 2 Research Methodology
Figure 3 Market Size Estimation Methodology: Bottom-Up Approach
Figure 4 Market Size Estimation Methodology: Top-Down Approach
Figure 5 Break Down of Primary Interviews: By Company Type, Designation, and Region
Figure 6 Data Triangulation Methodology
Figure 7 CPET Systems Was the Largest Product Segment of the Metabolic Testing Market in 2014
Figure 8 Lifestyle Diseases Was the Largest and Fastest-Growing Application Segment of the Metabolic Testing Market
Figure 9 VO2 Max Analysis Was the Largest and Fastest-Growing Test Segment of the Metabolic Testing Market
Figure 10 Hospitals Are the Largest and Fastest-Growing End User Segment of the Metabolic Testing Market
Figure 11 North America Was the Largest Regional Segment of the Metabolic Testing Market in 2014
Figure 12 The Market Will Grow Over 40% in the Forecast Period
Figure 13 VO2 Max Analysis to Dominate the Metabolic Testing Market
Figure 14 Asia to Grow at the Highest Rate During the Forecast Period
Figure 15 Asian Offers Lucrative Growth Opportunities
Figure 16 Metabolic Testing Market, By Product
Figure 17 Market, By Application
Figure 18 Market, By Test
Figure 19 Market, By End User
Figure 20 Market Dynamics
Figure 21 Increasing Healthcare Expenditure is the Most Important Growth Driver for the Metabolic Testing Market
Figure 22 Growth in Healthcare Expenditure in Asia and ROW Outpacing That in Europe and North America
Figure 23 High Capital Investments and Stringent Regulatory Policies to Restrict Entry of New Players
Figure 24 Direct Distribution, the Preferred Strategy By Prominent Companies
Figure 25 Market Segmentation, By Product
Figure 26 Market Size, By Product, 2014 ($Million)
Figure 27 North America Dominated CPET Systems Segment in 2014
Figure 28 North America Will Be the Fastest-Growing Regional Market for Metabolic Carts By 2019
Figure 29 North America Commanded Largest Share of ECG and EKG Systems Market in 2014
Figure 30 North America Commands Largest Share of Body Composition Analyzer System Market in 2014
Figure 31 North America Commands Largest Share of Software Market in 2014
Figure 32 Market Segmentation, By Application
Figure 33 Market, By Application, 2014 vs. 2019 ($Million)
Figure 34 North America to Command the Largest Share of Lifestyle Diseases Applications in 2019
Figure 35 Increasing Incidence of Lifestyle Diseases is Expected to Drive the Critical Care Application Segment in North America
Figure 36 North America Was the Fastest-Growing Market for Human Performance Testing in 2014
Figure 37 North America Was the Fastest-Growing Market for Dysmetabolic Syndrome X, in 2014
Figure 38 North America to Dominate the Metabolic Disorders Market in 2019
Figure 39 North America Commanded Largest Share of the Other Applications Market in 2014
Figure 40 Market, By Technology
Figure 41 Market, By Technology, 2011�2019 ($Million)
Figure 42 North America to Command the Largest Share of the VO2 Max Analysis Segment in 2019
Figure 43 North America to Dominate the RMR Analysis Segment in 2019
Figure 44 North America Was the Biggest Market for Body Composition Analysis in 2014
Figure 45 Market, By End User
Figure 46 Market, By End User, 2014 vs. 2019 ($Million)
Figure 47 North America to Command the Largest Share of the Hospitals End-User Segment in 2019
Figure 48 North America to Dominate the Laboratories End-User Segment in 2019
Figure 49 North America Was the Fastest-Growing Region for Sports Training Centers in 2014
Figure 50 North America Was the Fastest-Growing Region for the GYMS Segment in 2014
Figure 51 North America to Dominate the Metabolic Testing Market for Other End Users in 2019
Figure 52 Asia Expected to Grow at the Highest Rate From 2014 to 2019
Figure 53 Global Market Indicators
Figure 54 Metabolic Testing Market, By Region, 2014�2019 ($Million)
Figure 55 North America: Market Indicators
Figure 56 North America: Market Snapshot
Figure 57 North America: Metabolic Testing Market, By Product, 2012�2019 ($Million)
Figure 58 North America: Market, By Application, 2012�2019 ($Million)
Figure 59 North America: Market, By Technology, 2014 ($Million)
Figure 60 North America: Market, By End User, 2012�2019 ($Million)
Figure 61 Europe: Market Indicators
Figure 62 Europe: Metabolic Testing Market, By Product, 2014 ($Million)
Figure 63 Europe: Metabolic Market, By Application, 2014-2019 ($Million)
Figure 64 Europe: Metabolic Market, By Technology, 2014 ($Million)
Figure 65 Europe: Metabolic Market, By End Users, 2014-2019 ($Million)
Figure 66 Asia: Market Indicators
Figure 67 Asia: Market Snapshot
Figure 68 Asia: Metabolic Testing Market, By Product, 2014 ($Million)
Figure 69 Asia: Market, By Application, 2014-2019 ($Million)
Figure 70 Asia: Market, By Technology, 2014 ($Million)
Figure 71 Asia: Market, By End User, 2014-2019 ($Million)
Figure 72 ROW: Market Indicators
Figure 73 ROW: Metabolic Testing Market, By Product, 2014 ($Million)
Figure 74 ROW: Market, By Application, 2014-2019 ($Million)
Figure 75 ROW: Market, By Technology, 2014 ($Million)
Figure 76 ROW: Market, By End User, 2014-2019 ($Million)
Figure 77 New Product Launches Are the Key Strategy Adopted By Players
Figure 78 Battle for Market Share: New Product Launches Was the Key Strategy
Figure 79 Agreements and Partnerships, 2011�2014
Figure 80 Acquisitions, 2011�2014
Figure 81 Expansions, 2011�2014
Figure 82 Other Developments, 2011�2014
Figure 83 Geographic Revenue Mix of the Top 5 Market Players
Figure 84 Company Snapshot: Carefusion Corporation
Figure 85 Company Snapshot: General Electric Company
Figure 86 Company Snapshot: Geratherm Medical AG
Figure 87 Company Snapshot: MGC Diagnostics Corporation
Figure 88 Company Snapshot: OSI Systems, Inc.

 Generating Response ...


Growth opportunities and latent adjacency in Metabolic Testing Market