Body Composition Analyzers Market

Report Code MD 3631
Published in Jun, 2024, By MarketsandMarkets™
Download PDF

Choose License Type

Buy Report Now Inquire Before Buying

Body Composition Analyzers Market Size, Share & Trends by Products (Bioimpedance analyzers, DEXA, Skinfold Calipers, ADP), Modality (Portable, Stationary), Application (Segmental, Whole Body Measurement), Distribution Channel (E-commerce, Offline) - Global Forecasts to 2029

Overview

The global body composition analyzers market in terms of revenue was estimated to be worth $0.8 billion in 2024 and is poised to reach $1.2 billion by 2029, growing at a CAGR of 9.3% from 2024 to 2029. The new research study consists of an industry trend analysis of the market. The new research study consists of industry trends, pricing analysis, patent analysis, conference and webinar materials, key stakeholders, and buying behaviour in the market. Growth in the body composition analyzers market is largely driven by the rising cases of obesity across the globe, growth in fitness industry and growing penetration of bioimpedance analyzers among sports and athletics. Body composition analyzers have medical application which includes diagnosing and managing conditions like sarcopenia, malnutrition, and chronic diseases.

Attractive Opportunities in the Body Composition Analyzers Market

Asia Pacific

The Asia Pacific market is expected to register the highest CAGR during the forecast period, primarily due to the rise of gyms, fitness clubs, and wellness centers.

The growth of this market is driven by the rising health consciousness, technological advancements, and rising aging population

Professional athletes and sports teams are increasingly using body composition analysis to enhance performance and tailor training programs.

Emerging markets are expected to offer lucrative growth opportunities for players in the body composition analyzers market.

Product launches and acquisitions were the most widely adopted growth strategies by market players.

Global Body Composition Analyzers Market Dynamics

DRIVER: Increasing obesity linked disorders

The growing prevalence of obesity and the subsequent rise in metabolic disorders are driving the demand for body composition analyzers. Body composition devices provide detailed insights, helping to diagnose and manage conditions like diabetes and cardiovascular diseases. As health consciousness increases, more individuals and healthcare providers are turning to body composition analysis for effective health management. This trend is expected to significantly boost the growth of the body composition analyzers market.

RESTRAINT: Availability of alternative methods to analyze body composition

The growth of the body composition analyzers market is restrained by the availability of alternative methods, such as traditional BMI calculations and weighing scales. These alternatives are often perceived as more cost-effective or convenient which can deter the adoption of more advanced body composition analyzers. Despite being less precise, their widespread use and familiarity among consumers and professionals pose a significant challenge to the market's expansion.


OPPORTUNITY: Growing number of fitness clubs and wellness centers across the globe

The rising number of fitness clubs and wellness centers is creating significant growth opportunities for the body composition analyzers market. These centers are increasingly adopting advanced body composition analysis tools to offer personalized fitness and nutrition plans, which enhance their service offerings. With more people joining fitness and wellness programs, the demand for precise body composition measurement continues to rise, driving market expansion.

CHALLENGE: Limited awareness in developing countries

Limited awareness of body composition analysis creates a significant challenge to the growth of the body composition analyzers market. Many consumers and healthcare professionals do not fully understand its benefits compared to traditional metrics like BMI. This lack of knowledge results in lower adoption rates, as people continue to rely on familiar but less accurate methods. Consequently, the market's expansion is hindered by the need for increased education and awareness about its advantages.

Global Body Composition Analyzers Market Ecosystem Analysis

Bioimpedance analyzers segment accounted for the largest share of the body composition analyzers industry in 2023, by product. The body composition analyzers market is categorized into bioimpedance analyzers, dual-energy x-ray absorptiometry equipment, skindfold calipers, air displacement plethysmography equipment and hydrostatic weighing equipment, based on the product. In 2023, the bioimpedance analyzers segment emerged as the leading sector in the body composition analyzers market. The large share of this segment can majorly be attributed to the use of bioimpedance analyzers in clinical settings for monitoring hydration, body composition, and diagnosing conditions like lymphedema.


The largest share in the body composition analyzers industry in 2023 was held by the fitness clubs and wellness centers segment, by end user.

Categorized by its various end users, the body composition analyzers market includes hospitals & clinics, fitness clubs and wellness centers, academic & research centers and home users. As of 2023, the largest portion of the market was dominated by the fitness clubs and wellness centers segment. This dominance is largely attributed to rising consumer interest in health and fitness encouraging fitness clubs and wellness centers to invest in the body composition analyzers.


North America region holds the largest share of the Body Composition Analyzers Market.

Categorized into six primary regions, namely North America, Europe, Asia Pacific, Latin America, the Middle East & Africa, and GCC countries, the body composition analyzers market witnessed North America taking the forefront in 2023. The prevalence of obesity and related health concerns in the region leading to individuals to monitoring their body composition more closely, fueling market growth.


Recent Developments of Body Composition Analyzers Market industry

  • In March 2024, InBody (South Korea) Unveils Next-Generation Body Composition Analyzers: The InBody 380 and InBody 580 in US. In July 2023, Omron Corporation (Japan) has begun the construction of its new plant in Chennai, India which aims to enhance its position in the domestic market for home healthcare devices and expand its international manufacturing footprint, which includes sites in Japan, China, Vietnam, Italy, and Brazil.
  • In October 2022, InBody Co., Ltd. (South Korea) partnered with iLoveKickboxing (US) and offered iLoveKickboxing members access to high-quality data about their body fat percentage, muscle mass, and other biometrics. It enabled them to monitor changes over time via the InBody App. In April 2022, InBody (South Korea) launched its BWA 2.0 body water analyzer which is a professional-grade device that expands upon the outputs measured by the InBody S10 in US.

Key Market Players

Want to explore hidden markets that can drive new revenue in Body Composition Analyzers Market?

Scope of the Report

Report Attribute Details
Market Revenue in 2024 $0.8 billion
Projected Revenue by 2029 $1.2 billion
Revenue Rate Poised to Grow at a CAGR of 9.3%
Market Driver Increasing obesity linked disorders
Market Opportunity Growing number of fitness clubs and wellness centers across the globe

Key Questions Addressed by the Report

What is the projected market revenue value of the global body composition analyzers market?
The global body composition analyzers market is projected to reach a total revenue value of $1.2 billion by 2029.
What is the estimated growth rate (CAGR) of the global body composition analyzers market?
The global body composition analyzers market is estimated to grow at a Compound Annual Growth Rate (CAGR) of 9.3%, with a revenue size of approximately $0.8 billion in 2024.

Personalize This Research

  • Triangulate with your Own Data
  • Get Data as per your Format and Definition
  • Gain a Deeper Dive on a Specific Application, Geography, Customer or Competitor
  • Any level of Personalization
Request A Free Customisation

Let Us Help You

  • What are the Known and Unknown Adjacencies Impacting the Body Composition Analyzers Market
  • What will your New Revenue Sources be?
  • Who will be your Top Customer; what will make them switch?
  • Defend your Market Share or Win Competitors
  • Get a Scorecard for Target Partners
Customized Workshop Request

Table of Contents

Exclusive indicates content/data unique to MarketsandMarkets and not available with any competitors.

TITLE
PAGE NO
INTRODUCTION
29
RESEARCH METHODOLOGY
35
EXECUTIVE SUMMARY
49
PREMIUM INSIGHTS
54
MARKET OVERVIEW
57
  • 5.1 INTRODUCTION
  • 5.2 MARKET DYNAMICS
    DRIVERS
    - Growing prevalence of obesity and subsequent rise in metabolic disorders
    - Supportive government initiatives for healthcare awareness
    RESTRAINTS
    - High cost of equipment
    - Availability of alternative products
    OPPORTUNITIES
    - Increasing establishment of fitness clubs and healthcare centers
    - Integration of wearable healthcare devices with bioimpedance analyzers
    - Growing adoption of self-monitoring devices
    CHALLENGES
    - Accuracy concerns associated with analyzers
    - Limited awareness in emerging markets
  • 5.3 PRICING ANALYSIS
    AVERAGE SELLING PRICE TREND OF KEY PLAYERS, BY REGION
    AVERAGE SELLING PRICE TREND, BY PRODUCT TYPE
  • 5.4 VALUE CHAIN ANALYSIS
  • 5.5 SUPPLY CHAIN ANALYSIS
  • 5.6 PORTER’S FIVE FORCES ANALYSIS
    INTENSITY OF COMPETITIVE RIVALRY
    BARGAINING POWER OF SUPPLIERS
    BARGAINING POWER OF BUYERS
    THREAT OF NEW ENTRANTS
    THREAT OF SUBSTITUTES
  • 5.7 ECOSYSTEM ANALYSIS
    BODY COMPOSITION ANALYZERS MARKET: ROLE IN ECOSYSTEM
  • 5.8 REGULATORY BODIES, GOVERNMENT AGENCIES, AND OTHER ORGANIZATIONS
  • 5.9 REGULATORY ANALYSIS
    NORTH AMERICA
    - US
    - Canada
    EUROPE
    ASIA PACIFIC
    - Japan
    - China
    - India
  • 5.10 PATENT ANALYSIS
  • 5.11 TRENDS/DISRUPTIONS IMPACTING CUSTOMERS’ BUSINESSES
  • 5.12 KEY CONFERENCES & EVENTS, 2024−2025
  • 5.13 TECHNOLOGY ANALYSIS
    KEY TECHNOLOGIES
    - Bioimpedance analyzers market
    ADJACENT TECHNOLOGIES
    - Dual-energy X-ray absorptiometry
  • 5.14 KEY STAKEHOLDERS & BUYING CRITERIA
    KEY STAKEHOLDERS ON BUYING PROCESS
    BUYING CRITERIA
  • 5.15 TRADE ANALYSIS
  • 5.16 INVESTMENT AND FUNDING SCENARIO
  • 5.17 IMPACT OF GENERATIVE AI ON BODY COMPOSITION ANALYZERS MARKET
BODY COMPOSITION ANALYZERS MARKET, BY PRODUCT
81
  • 6.1 INTRODUCTION
  • 6.2 BIOIMPEDANCE ANALYZERS
    MULTI-FREQUENCY BIOIMPEDANCE ANALYZERS
    - High accuracy and precision to boost demand
    SINGLE-FREQUENCY BIOIMPEDANCE ANALYZERS
    - Low cost and easy accessibility to fuel market
    DUAL-FREQUENCY BIOIMPEDANCE ANALYZERS
    - Advanced clinical & research capabilities to support market growth
  • 6.3 DUAL-ENERGY X-RAY ABSORPTIOMETRY EQUIPMENT
    ABILITY TO MEASURE BONE MINERAL DENSITY TO DRIVE MARKET
  • 6.4 SKINFOLD CALIPERS
    EQUIPMENT MEASURES BODY FAT AND SKIN THICKNESS
  • 6.5 AIR DISPLACEMENT PLETHYSMOGRAPHY EQUIPMENT
    RAPID RESULTS AND HIGH UPTAKE IN HEALTHCARE FACILITIES TO DRIVE MARKET
  • 6.6 HYDROSTATIC WEIGHING EQUIPMENT
    HIGH MAINTENANCE AND LONG TESTING TIMES TO RESTRAIN MARKET
BODY COMPOSITION ANALYZERS MARKET, BY MODALITY
104
  • 7.1 INTRODUCTION
  • 7.2 PORTABLE BODY COMPOSITION ANALYZERS
    REAL-TIME DATA TRANSMISSION AND ENHANCED CONNECTIVITY TO PROPEL MARKET
  • 7.3 STATIONARY/BENCHTOP BODY COMPOSITION ANALYZERS
    MINIMAL REQUIREMENTS AND LOW MAINTENANCE TO BOOST DEMAND
BODY COMPOSITION ANALYZERS MARKET, BY USAGE TYPE
111
  • 8.1 INTRODUCTION
  • 8.2 PROFESSIONAL-GRADE BODY COMPOSITION ANALYZERS
    RISING ESTABLISHMENT OF WELLNESS & FITNESS CENTERS TO BOOST DEMAND
  • 8.3 CONSUMER-GRADE BODY COMPOSITION ANALYZERS
    RISING TECHNOLOGICAL ADVANCEMENTS TO SUPPORT MARKET GROWTH
BODY COMPOSITION ANALYZERS MARKET, BY APPLICATION
118
  • 9.1 INTRODUCTION
  • 9.2 SEGMENTAL BODY MEASUREMENT
    ABILITY TO IDENTIFY MUSCLE IMBALANCES AND ENABLE PERSONALIZED TRAINING TO BOOST DEMAND
  • 9.3 WHOLE-BODY MEASUREMENT
    GROWING UPTAKE OF DEXA AND BIOIMPEDANCE ANALYZERS TO DRIVE MARKET
BODY COMPOSITION ANALYZERS MARKET, BY DISTRIBUTION CHANNEL
125
  • 10.1 INTRODUCTION
  • 10.2 OFFLINE/RETAIL STORES
    BENEFITS INCLUDE CONVENIENCE AND ACCESSIBILITY
  • 10.3 E-COMMERCE
    GROWING PREFERENCE FOR DIRECT DISTRIBUTION CHANNELS TO DRIVE MARKET
BODY COMPOSITION ANALYZERS MARKET, BY END USER
131
  • 11.1 INTRODUCTION
  • 11.2 FITNESS CLUBS AND WELLNESS CENTERS
    GROWING AWARENESS OF ACTIVE LIFESTYLES TO BOOST DEMAND
  • 11.3 HOSPITALS AND CLINICS
    GROWING UPTAKE OF DEXA IN OSTEOPOROSIS DETECTION TO BOOST DEMAND
  • 11.4 ACADEMIC & RESEARCH CENTERS
    RISING GRANTS AND FUNDING INVESTMENTS TO SUPPORT MARKET GROWTH
  • 11.5 HOME USERS
    GROWING UPTAKE OF PORTABLE ANALYZERS TO DRIVE MARKET
BODY COMPOSITION ANALYZERS MARKET, BY REGION
143
  • 12.1 INTRODUCTION
  • 12.2 NORTH AMERICA
    NORTH AMERICA: RECESSION IMPACT
    US
    - Increasing prevalence of diabetes and CVD to drive market
    CANADA
    - High prevalence of obesity to support market growth
  • 12.3 EUROPE
    EUROPE: RECESSION IMPACT
    GERMANY
    - High healthcare expenditure to drive market
    FRANCE
    - Growing uptake of bioimpedance analyzers to boost demand
    UK
    - Growing incidence of CKD to drive market
    ITALY
    - Growing demand for diagnostic & monitoring devices to drive market
    SPAIN
    - Increasing cases of osteoporosis to support market growth
    REST OF EUROPE
  • 12.4 ASIA PACIFIC
    ASIA PACIFIC: RECESSION IMPACT
    JAPAN
    - Supportive government initiatives and universal reimbursement coverage to boost demand
    CHINA
    - Rising cases of obesity in children to propel market
    INDIA
    - Growing awareness of nutrition and healthcare to boost demand
    REST OF ASIA PACIFIC
  • 12.5 LATIN AMERICA
    LATIN AMERICA: RECESSION IMPACT
    BRAZIL
    - Stringent regulatory requirements to boost demand
    MEXICO
    - Increasing healthcare expenditure to support market growth
    REST OF LATIN AMERICA
  • 12.6 MIDDLE EAST & AFRICA
    LOW AVAILABILITY OF ADVANCED ANALYZERS TO RESTRAIN MARKET
    MIDDLE EAST & AFRICA: RECESSION IMPACT
  • 12.7 GCC COUNTRIES
    GCC COUNTRIES: RECESSION IMPACT
    KINGDOM OF SAUDI ARABIA (KSA)
    - increasing focus on preventive care to boost demand
    UNITED ARAB EMIRATES (UAE)
    - Surge in fitness clubs to support market growth
    OTHER GCC COUNTRIES
COMPETITIVE LANDSCAPE
222
  • 13.1 OVERVIEW
  • 13.2 KEY PLAYER STRATEGIES/RIGHT TO WIN
    OVERVIEW OF STRATEGIES ADOPTED BY KEY PLAYERS IN BODY COMPOSITION ANALYZERS MARKET
  • 13.3 REVENUE ANALYSIS
  • 13.4 MARKET SHARE ANALYSIS
  • 13.5 COMPANY EVALUATION MATRIX: KEY PLAYERS, 2023
    STARS
    EMERGING LEADERS
    PERVASIVE PLAYERS
    PARTICIPANTS
    COMPANY FOOTPRINT: KEY PLAYERS, 2023
    - Company footprint
    - Product footprint
    - Modality footprint
    - Application footprint
    - Region footprint
  • 13.6 COMPANY EVALUATION MATRIX: START-UPS/SMES, 2023
    PROGRESSIVE COMPANIES
    RESPONSIVE COMPANIES
    DYNAMIC COMPANIES
    STARTING BLOCKS
    COMPETITIVE BENCHMARKING: START-UPS/SMES, 2023
  • 13.7 VALUATION AND FINANCIAL METRICS
  • 13.8 BRAND/PRODUCT COMPARISON
  • 13.9 COMPETITIVE SCENARIO
    DEALS
    EXPANSIONS
COMPANY PROFILES
237
  • 14.1 KEY PLAYERS
    OMRON CORPORATION
    - Business overview
    - Products offered
    - Recent developments
    - MnM view
    HOLOGIC, INC.
    - Business overview
    - Products offered
    - MnM view
    GE HEALTHCARE
    - Business overview
    - Products offered
    - MnM view
    INBODY CO., LTD.
    - Business overview
    - Products offered
    - Recent developments
    RJL SYSTEMS
    - Business overview
    - Products offered
    COSMED SRL
    - Business overview
    - Products offered
    SECA GMBH & CO. KG.
    - Business overview
    - Products offered
    TANITA CORPORATION
    - Business overview
    - Products offered
    CHARDER ELECTRONIC CO, LTD.
    - Business overview
    - Products offered
    SELVAS HEALTHCARE, INC.
    - Business overview
    - Products offered
    EVOLT
    - Business overview
    - Products offered
  • 14.2 OTHER PLAYERS
    MALTRON INTERNATIONAL LTD.
    TONGFANG HEALTH TECHNOLOGY (BEIJING) CO., LTD.
    BIOTEKNA
    FOOK TIN TECHNOLOGIES LTD.
    BIODYNAMICS CORPORATION
    BIOPARHOM
    MICROLIFE CORPORATION
    NUMED S.A.R.L.
    SHANGHAI GOLDENWELL MEDICAL TECHNOLOGY CO., LTD.
    SAMCO MEDICAL
    SWISSRAY
    OSTEOSYS CORP.
    EXERTECH
    AKERN S.R.L
    WITHINGS
APPENDIX
271
  • 15.1 DISCUSSION GUIDE
  • 15.2 KNOWLEDGESTORE: MARKETSANDMARKETS’ SUBSCRIPTION PORTAL
  • 15.3 CUSTOMIZATION OPTIONS
  • 15.4 RELATED REPORTS
  • 15.5 AUTHOR DETAILS
LIST OF TABLES
 
  • TABLE 1 BODY COMPOSITION ANALYZERS MARKET: INCLUSIONS AND EXCLUSIONS
  • TABLE 2 BODY COMPOSITION ANALYZERS MARKET: RISK ASSESSMENT ANALYSIS
  • TABLE 3 BODY COMPOSITION ANALYZERS MARKET: PORTER’S FIVE FORCES ANALYSIS
  • TABLE 4 LIST OF REGULATORY BODIES, GOVERNMENT AGENCIES, AND OTHER ORGANIZATIONS
  • TABLE 5 US FDA: MEDICAL DEVICE CLASSIFICATION
  • TABLE 6 CANADA: LEVEL OF RISK, TIME, COST, AND COMPLEXITY OF REGISTRATION PROCESS
  • TABLE 7 JAPAN: MEDICAL DEVICE CLASSIFICATION UNDER PMDA
  • TABLE 8 CHINA: CLASSIFICATION OF MEDICAL DEVICES
  • TABLE 9 BODY COMPOSITION ANALYZERS MARKET: DETAILED LIST OF CONFERENCES & EVENTS, 2024−2025
  • TABLE 10 INFLUENCE OF STAKEHOLDERS IN BUYING PROCESS OF BODY COMPOSITION ANALYZERS PRODUCTS (%)
  • TABLE 11 KEY BUYING CRITERIA FOR BODY COMPOSITION ANALYZER PRODUCTS
  • TABLE 12 IMPORT DATA FOR INSTRUMENTS & APPLIANCES USED IN MEDICAL, SURGICAL, OR VETERINARY SCIENCES (NES), BY COUNTRY, 2018–2022 (USD MILLION)
  • TABLE 13 EXPORT DATA FOR INSTRUMENTS AND APPLIANCES USED IN MEDICAL, SURGICAL, OR VETERINARY SCIENCES (NES), BY COUNTRY, 2018–2022 (USD MILLION)
  • TABLE 14 BODY COMPOSITION ANALYZERS MARKET, BY PRODUCT, 2022–2029 (USD MILLION)
  • TABLE 15 BIOIMPEDANCE ANALYZERS MARKET, BY TYPE, 2022–2029 (USD MILLION)
  • TABLE 16 BIOIMPEDANCE ANALYZERS MARKET, BY REGION, 2022–2029 (USD MILLION)
  • TABLE 17 NORTH AMERICA: BIOIMPEDANCE ANALYZERS MARKET, BY COUNTRY, 2022–2029 (USD MILLION)
  • TABLE 18 EUROPE: BIOIMPEDANCE ANALYZERS MARKET, BY COUNTRY, 2022–2029 (USD MILLION)
  • TABLE 19 ASIA PACIFIC: BIOIMPEDANCE ANALYZERS MARKET, BY COUNTRY, 2022–2029 (USD MILLION)
  • TABLE 20 LATIN AMERICA: BIOIMPEDANCE ANALYZERS MARKET, BY COUNTRY, 2022–2029 (USD MILLION)
  • TABLE 21 GCC COUNTRIES: BIOIMPEDANCE ANALYZERS MARKET, BY COUNTRY, 2022–2029 (USD MILLION)
  • TABLE 22 MULTI-FREQUENCY BIOIMPEDANCE ANALYZERS OFFERED, BY KEY PLAYER
  • TABLE 23 MULTI-FREQUENCY BIOIMPEDANCE ANALYZERS MARKET, BY REGION, 2022–2029 (USD MILLION)
  • TABLE 24 NORTH AMERICA: MULTI-FREQUENCY BIOIMPEDANCE ANALYZERS MARKET, BY COUNTRY, 2022–2029 (USD MILLION)
  • TABLE 25 EUROPE: MULTI-FREQUENCY BIOIMPEDANCE ANALYZERS MARKET, BY COUNTRY, 2022–2029 (USD MILLION)
  • TABLE 26 ASIA PACIFIC: MULTI-FREQUENCY BIOIMPEDANCE ANALYZERS MARKET, BY COUNTRY, 2022–2029 (USD MILLION)
  • TABLE 27 LATIN AMERICA: MULTI-FREQUENCY BIOIMPEDANCE ANALYZERS MARKET, BY COUNTRY, 2022–2029 (USD MILLION)
  • TABLE 28 GCC COUNTRIES: MULTI-FREQUENCY BIOIMPEDANCE ANALYZERS MARKET, BY COUNTRY, 2022–2029 (USD MILLION)
  • TABLE 29 SINGLE-FREQUENCY BIOIMPEDANCE ANALYZERS MARKET, BY REGION, 2022–2029 (USD MILLION)
  • TABLE 30 NORTH AMERICA: SINGLE-FREQUENCY BIOIMPEDANCE ANALYZERS MARKET, BY COUNTRY, 2022–2029 (USD MILLION)
  • TABLE 31 EUROPE: SINGLE-FREQUENCY BIOIMPEDANCE ANALYZERS MARKET, BY COUNTRY, 2022–2029 (USD MILLION)
  • TABLE 32 ASIA PACIFIC: SINGLE-FREQUENCY BIOIMPEDANCE ANALYZERS MARKET, BY COUNTRY, 2022–2029 (USD MILLION)
  • TABLE 33 LATIN AMERICA: SINGLE-FREQUENCY BIOIMPEDANCE ANALYZERS MARKET, BY COUNTRY, 2022–2029 (USD MILLION)
  • TABLE 34 GCC COUNTRIES: SINGLE-FREQUENCY BIOIMPEDANCE ANALYZERS MARKET, BY COUNTRY, 2022–2029 (USD MILLION)
  • TABLE 35 DUAL-FREQUENCY BIOIMPEDANCE ANALYZERS OFFERED, BY KEY PLAYER
  • TABLE 36 DUAL-FREQUENCY BIOIMPEDANCE ANALYZERS MARKET, BY REGION, 2022–2029 (USD MILLION)
  • TABLE 37 NORTH AMERICA: DUAL-FREQUENCY BIOIMPEDANCE ANALYZERS MARKET, BY COUNTRY, 2022–2029 (USD MILLION)
  • TABLE 38 EUROPE: DUAL-FREQUENCY BIOIMPEDANCE ANALYZERS MARKET, BY COUNTRY, 2022–2029 (USD MILLION)
  • TABLE 39 ASIA PACIFIC: DUAL-FREQUENCY BIOIMPEDANCE ANALYZERS MARKET, BY COUNTRY, 2022–2029 (USD MILLION)
  • TABLE 40 LATIN AMERICA: DUAL-FREQUENCY BIOIMPEDANCE ANALYZERS MARKET, BY COUNTRY, 2022–2029 (USD MILLION)
  • TABLE 41 GCC COUNTRIES: DUAL-FREQUENCY BIOIMPEDANCE ANALYZERS MARKET, BY COUNTRY, 2022–2029 (USD MILLION)
  • TABLE 42 DUAL-ENERGY X-RAY ABSORPTIOMETRY EQUIPMENT MARKET, BY REGION, 2022–2029 (USD MILLION)
  • TABLE 43 NORTH AMERICA: DUAL-ENERGY X-RAY ABSORPTIOMETRY EQUIPMENT MARKET, BY COUNTRY, 2022–2029 (USD MILLION)
  • TABLE 44 EUROPE: DUAL-ENERGY X-RAY ABSORPTIOMETRY EQUIPMENT MARKET, BY COUNTRY, 2022–2029 (USD MILLION)
  • TABLE 45 ASIA PACIFIC: DUAL-ENERGY X-RAY ABSORPTIOMETRY EQUIPMENT MARKET, BY COUNTRY, 2022–2029 (USD MILLION)
  • TABLE 46 LATIN AMERICA: DUAL-ENERGY X-RAY ABSORPTIOMETRY EQUIPMENT MARKET, BY COUNTRY, 2022–2029 (USD MILLION)
  • TABLE 47 GCC COUNTRIES: DUAL-ENERGY X-RAY ABSORPTIOMETRY EQUIPMENT MARKET, BY COUNTRY, 2022–2029 (USD MILLION)
  • TABLE 48 SKINFOLD CALIPERS MARKET, BY REGION, 2022–2029 (USD MILLION)
  • TABLE 49 NORTH AMERICA: SKINFOLD CALIPERS MARKET, BY COUNTRY, 2022–2029 (USD MILLION)
  • TABLE 50 EUROPE: SKINFOLD CALIPERS MARKET, BY COUNTRY, 2022–2029 (USD MILLION)
  • TABLE 51 ASIA PACIFIC: SKINFOLD CALIPERS MARKET, BY COUNTRY, 2022–2029 (USD MILLION)
  • TABLE 52 LATIN AMERICA: SKINFOLD CALIPERS MARKET, BY COUNTRY, 2022–2029 (USD MILLION)
  • TABLE 53 GCC COUNTRIES: SKINFOLD CALIPERS MARKET, BY COUNTRY, 2022–2029 (USD MILLION)
  • TABLE 54 AIR DISPLACEMENT PLETHYSMOGRAPHY EQUIPMENT MARKET, BY REGION, 2022–2029 (USD MILLION)
  • TABLE 55 NORTH AMERICA: AIR DISPLACEMENT PLETHYSMOGRAPHY EQUIPMENT MARKET, BY COUNTRY, 2022–2029 (USD MILLION)
  • TABLE 56 EUROPE: AIR DISPLACEMENT PLETHYSMOGRAPHY EQUIPMENT MARKET, BY COUNTRY, 2022–2029 (USD MILLION)
  • TABLE 57 ASIA PACIFIC: AIR DISPLACEMENT PLETHYSMOGRAPHY EQUIPMENT MARKET, BY COUNTRY, 2022–2029 (USD MILLION)
  • TABLE 58 LATIN AMERICA: AIR DISPLACEMENT PLETHYSMOGRAPHY EQUIPMENT MARKET, BY COUNTRY, 2022–2029 (USD MILLION)
  • TABLE 59 GCC COUNTRIES: AIR DISPLACEMENT PLETHYSMOGRAPHY EQUIPMENT MARKET, BY COUNTRY, 2022–2029 (USD MILLION)
  • TABLE 60 HYDROSTATIC WEIGHING EQUIPMENT MARKET, BY REGION, 2022–2029 (USD MILLION)
  • TABLE 61 NORTH AMERICA: HYDROSTATIC WEIGHING EQUIPMENT MARKET, BY COUNTRY, 2022–2029 (USD MILLION)
  • TABLE 62 EUROPE: HYDROSTATIC WEIGHING EQUIPMENT MARKET, BY COUNTRY, 2022–2029 (USD MILLION)
  • TABLE 63 ASIA PACIFIC: HYDROSTATIC WEIGHING EQUIPMENT MARKET, BY COUNTRY, 2022–2029 (USD MILLION)
  • TABLE 64 LATIN AMERICA: HYDROSTATIC WEIGHING EQUIPMENT MARKET, BY COUNTRY, 2022–2029 (USD MILLION)
  • TABLE 65 GCC COUNTRIES: HYDROSTATIC WEIGHING EQUIPMENT MARKET, BY COUNTRY, 2022–2029 (USD MILLION)
  • TABLE 66 BODY COMPOSITION ANALYZERS MARKET, BY MODALITY, 2022–2029 (USD MILLION)
  • TABLE 67 PORTABLE BODY COMPOSITION ANALYZERS MARKET, BY REGION, 2022–2029 (USD MILLION)
  • TABLE 68 NORTH AMERICA PORTABLE BODY COMPOSITION ANALYZERS MARKET, BY COUNTRY, 2022–2029 (USD MILLION)
  • TABLE 69 EUROPE PORTABLE BODY COMPOSITION ANALYZERS MARKET, BY COUNTRY, 2022–2029 (USD MILLION)
  • TABLE 70 ASIA PACIFIC PORTABLE BODY COMPOSITION ANALYZERS MARKET, BY COUNTRY, 2022–2029 (USD MILLION)
  • TABLE 71 LATIN AMERICA PORTABLE BODY COMPOSITION ANALYZERS MARKET, BY COUNTRY, 2022–2029 (USD MILLION)
  • TABLE 72 GCC COUNTRIES: PORTABLE BODY COMPOSITION ANALYZERS MARKET, BY COUNTRY, 2022–2029 (USD MILLION)
  • TABLE 73 STATIONARY/BENCHTOP BODY COMPOSITION ANALYZERS MARKET, BY REGION, 2022–2029 (USD MILLION)
  • TABLE 74 NORTH AMERICA: STATIONARY/BENCHTOP BODY COMPOSITION ANALYZERS MARKET, BY COUNTRY, 2022–2029 (USD MILLION)
  • TABLE 75 EUROPE: STATIONARY/BENCHTOP BODY COMPOSITION ANALYZERS MARKET, BY COUNTRY, 2022–2029 (USD MILLION)
  • TABLE 76 ASIA PACIFIC: STATIONARY/BENCHTOP BODY COMPOSITION ANALYZERS MARKET, BY COUNTRY, 2022–2029 (USD MILLION)
  • TABLE 77 LATIN AMERICA: STATIONARY/BENCHTOP BODY COMPOSITION ANALYZERS MARKET, BY COUNTRY, 2022–2029 (USD MILLION)
  • TABLE 78 GCC COUNTRIES: STATIONARY/BENCHTOP BODY COMPOSITION ANALYZERS MARKET, BY COUNTRY, 2022–2029 (USD MILLION)
  • TABLE 79 BODY COMPOSITION ANALYZERS MARKET, BY USAGE TYPE, 2022–2029 (USD MILLION)
  • TABLE 80 PROFESSIONAL-GRADE BODY COMPOSITION ANALYZERS MARKET, BY REGION, 2022–2029 (USD MILLION)
  • TABLE 81 NORTH AMERICA: PROFESSIONAL-GRADE BODY COMPOSITION ANALYZERS MARKET, BY COUNTRY, 2022–2029 (USD MILLION)
  • TABLE 82 EUROPE: PROFESSIONAL-GRADE BODY COMPOSITION ANALYZERS MARKET, BY COUNTRY, 2022–2029 (USD MILLION)
  • TABLE 83 ASIA PACIFIC: PROFESSIONAL-GRADE BODY COMPOSITION ANALYZERS MARKET, BY COUNTRY, 2022–2029 (USD MILLION)
  • TABLE 84 LATIN AMERICA: PROFESSIONAL-GRADE BODY COMPOSITION ANALYZERS MARKET, BY COUNTRY, 2022–2029 (USD MILLION)
  • TABLE 85 GCC COUNTRIES: PROFESSIONAL-GRADE BODY COMPOSITION ANALYZERS MARKET, BY COUNTRY, 2022–2029 (USD MILLION)
  • TABLE 86 CONSUMER-GRADE BODY COMPOSITION ANALYZERS MARKET, BY REGION, 2022–2029 (USD MILLION)
  • TABLE 87 NORTH AMERICA: CONSUMER-GRADE BODY COMPOSITION ANALYZERS MARKET, BY COUNTRY, 2022–2029 (USD MILLION)
  • TABLE 88 EUROPE: CONSUMER-GRADE BODY COMPOSITION ANALYZERS MARKET, BY COUNTRY, 2022–2029 (USD MILLION)
  • TABLE 89 ASIA PACIFIC: CONSUMER-GRADE BODY COMPOSITION ANALYZERS MARKET, BY COUNTRY, 2022–2029 (USD MILLION)
  • TABLE 90 LATIN AMERICA: CONSUMER-GRADE BODY COMPOSITION ANALYZERS MARKET, BY COUNTRY, 2022–2029 (USD MILLION)
  • TABLE 91 GCC COUNTRIES: CONSUMER-GRADE BODY COMPOSITION ANALYZERS MARKET, BY COUNTRY, 2022–2029 (USD MILLION)
  • TABLE 92 BODY COMPOSITION ANALYZERS MARKET, BY APPLICATION, 2022–2029 (USD MILLION)
  • TABLE 93 SEGMENTAL BODY MEASUREMENT MARKET, BY REGION, 2022–2029 (USD MILLION)
  • TABLE 94 NORTH AMERICA: SEGMENTAL BODY MEASUREMENT MARKET, BY COUNTRY, 2022–2029 (USD MILLION)
  • TABLE 95 EUROPE: SEGMENTAL BODY MEASUREMENT MARKET, BY COUNTRY, 2022–2029 (USD MILLION)
  • TABLE 96 ASIA PACIFIC: SEGMENTAL BODY MEASUREMENT MARKET, BY COUNTRY, 2022–2029 (USD MILLION)
  • TABLE 97 LATIN AMERICA: SEGMENTAL BODY MEASUREMENT MARKET, BY COUNTRY, 2022–2029 (USD MILLION)
  • TABLE 98 GCC COUNTRIES: SEGMENTAL BODY MEASUREMENT MARKET, BY COUNTRY, 2022–2029 (USD MILLION)
  • TABLE 99 WHOLE-BODY MEASUREMENT MARKET, BY REGION, 2022–2029 (USD MILLION)
  • TABLE 100 NORTH AMERICA: WHOLE-BODY MEASUREMENT MARKET, BY COUNTRY, 2022–2029 (USD MILLION)
  • TABLE 101 EUROPE: WHOLE-BODY MEASUREMENT MARKET, BY COUNTRY, 2022–2029 (USD MILLION)
  • TABLE 102 ASIA PACIFIC: WHOLE-BODY MEASUREMENT MARKET, BY COUNTRY, 2022–2029 (USD MILLION)
  • TABLE 103 LATIN AMERICA: WHOLE-BODY MEASUREMENT MARKET, BY COUNTRY, 2022–2029 (USD MILLION)
  • TABLE 104 GCC COUNTRIES: WHOLE-BODY MEASUREMENT MARKET, BY COUNTRY, 2022–2029 (USD MILLION)
  • TABLE 105 BODY COMPOSITION ANALYZERS MARKET, BY DISTRIBUTION CHANNEL, 2022–2029 (USD MILLION)
  • TABLE 106 OFFLINE/RETAIL STORES MARKET, BY REGION, 2022–2029 (USD MILLION)
  • TABLE 107 NORTH AMERICA: OFFLINE/RETAIL STORES MARKET, BY COUNTRY, 2022–2029 (USD MILLION)
  • TABLE 108 EUROPE: OFFLINE/RETAIL STORES MARKET, BY COUNTRY, 2022–2029 (USD MILLION)
  • TABLE 109 ASIA PACIFIC: OFFLINE/RETAIL STORES MARKET, BY COUNTRY, 2022–2029 (USD MILLION)
  • TABLE 110 LATIN AMERICA: OFFLINE/RETAIL STORES MARKET, BY COUNTRY, 2022–2029 (USD MILLION)
  • TABLE 111 GCC COUNTRIES: OFFLINE/RETAIL STORES MARKET, BY COUNTRY, 2022–2029 (USD MILLION)
  • TABLE 112 E-COMMERCE MARKET, BY REGION, 2022–2029 (USD MILLION)
  • TABLE 113 NORTH AMERICA: E-COMMERCE MARKET, BY COUNTRY, 2022–2029 (USD MILLION)
  • TABLE 114 EUROPE: E-COMMERCE MARKET, BY COUNTRY, 2022–2029 (USD MILLION)
  • TABLE 115 ASIA PACIFIC: E-COMMERCE MARKET, BY COUNTRY, 2022–2029 (USD MILLION)
  • TABLE 116 LATIN AMERICA: E-COMMERCE MARKET, BY COUNTRY, 2022–2029 (USD MILLION)
  • TABLE 117 GCC COUNTRIES: E-COMMERCE MARKET, BY COUNTRY, 2022–2029 (USD MILLION)
  • TABLE 118 BODY COMPOSITION ANALYZERS MARKET, BY END USER, 2022–2029 (USD MILLION)
  • TABLE 119 BODY COMPOSITION ANALYZERS MARKET FOR FITNESS CLUBS AND WELLNESS CENTERS, BY REGION, 2022–2029 (USD MILLION)
  • TABLE 120 NORTH AMERICA: BODY COMPOSITION ANALYZERS MARKET FOR FITNESS CLUBS AND WELLNESS CENTERS, BY COUNTRY, 2022–2029 (USD MILLION)
  • TABLE 121 EUROPE: BODY COMPOSITION ANALYZERS MARKET FOR FITNESS CLUBS AND WELLNESS CENTERS, BY COUNTRY, 2022–2029 (USD MILLION)
  • TABLE 122 ASIA PACIFIC: BODY COMPOSITION ANALYZERS MARKET FOR FITNESS CLUBS AND WELLNESS CENTERS, BY COUNTRY, 2022–2029 (USD MILLION)
  • TABLE 123 LATIN AMERICA: BODY COMPOSITION ANALYZERS MARKET FOR FITNESS CLUBS AND WELLNESS CENTERS, BY COUNTRY, 2022–2029 (USD MILLION)
  • TABLE 124 GCC COUNTRIES: BODY COMPOSITION ANALYZERS MARKET FOR FITNESS CLUBS AND WELLNESS CENTERS, BY COUNTRY, 2022–2029 (USD MILLION)
  • TABLE 125 BODY COMPOSITION ANALYZERS MARKET FOR HOSPITALS AND CLINICS, BY REGION, 2022–2029 (USD MILLION)
  • TABLE 126 NORTH AMERICA: BODY COMPOSITION ANALYZERS MARKET FOR HOSPITALS AND CLINICS, BY COUNTRY, 2022–2029 (USD MILLION)
  • TABLE 127 EUROPE: BODY COMPOSITION ANALYZERS MARKET FOR HOSPITALS AND CLINICS, BY COUNTRY, 2022–2029 (USD MILLION)
  • TABLE 128 ASIA PACIFIC: BODY COMPOSITION ANALYZERS MARKET FOR HOSPITALS AND CLINICS, BY COUNTRY, 2022–2029 (USD MILLION)
  • TABLE 129 LATIN AMERICA: BODY COMPOSITION ANALYZERS MARKET FOR HOSPITALS AND CLINICS, BY COUNTRY, 2022–2029 (USD MILLION)
  • TABLE 130 GCC COUNTRIES: BODY COMPOSITION ANALYZERS MARKET FOR HOSPITALS AND CLINICS, BY COUNTRY, 2022–2029 (USD MILLION)
  • TABLE 131 BODY COMPOSITION ANALYZERS MARKET FOR ACADEMIC & RESEARCH CENTERS, BY REGION, 2022–2029 (USD MILLION)
  • TABLE 132 NORTH AMERICA: BODY COMPOSITION ANALYZERS MARKET FOR ACADEMIC & RESEARCH CENTERS, BY COUNTRY, 2022–2029 (USD MILLION)
  • TABLE 133 EUROPE: BODY COMPOSITION ANALYZERS MARKET FOR ACADEMIC & RESEARCH CENTERS, BY COUNTRY, 2022–2029 (USD MILLION)
  • TABLE 134 ASIA PACIFIC: BODY COMPOSITION ANALYZERS MARKET FOR ACADEMIC & RESEARCH CENTERS, BY COUNTRY, 2022–2029 (USD MILLION)
  • TABLE 135 LATIN AMERICA: BODY COMPOSITION ANALYZERS MARKET FOR ACADEMIC & RESEARCH CENTERS, BY COUNTRY, 2022–2029 (USD MILLION)
  • TABLE 136 GCC COUNTRIES: BODY COMPOSITION ANALYZERS MARKET FOR ACADEMIC & RESEARCH CENTERS, BY COUNTRY, 2022–2029 (USD MILLION)
  • TABLE 137 BODY COMPOSITION ANALYZERS MARKET FOR HOME USERS, BY REGION, 2022–2029 (USD MILLION)
  • TABLE 138 NORTH AMERICA: BODY COMPOSITION ANALYZERS MARKET FOR HOME USERS, BY COUNTRY, 2022–2029 (USD MILLION)
  • TABLE 139 EUROPE: BODY COMPOSITION ANALYZERS MARKET FOR HOME USERS, BY COUNTRY, 2022–2029 (USD MILLION)
  • TABLE 140 ASIA PACIFIC: BODY COMPOSITION ANALYZERS MARKET FOR HOME USERS, BY COUNTRY, 2022–2029 (USD MILLION)
  • TABLE 141 LATIN AMERICA: BODY COMPOSITION ANALYZERS MARKET FOR HOME USERS, BY COUNTRY, 2022–2029 (USD MILLION)
  • TABLE 142 GCC COUNTRIES: BODY COMPOSITION ANALYZERS MARKET FOR HOME USERS, BY COUNTRY, 2022–2029 (USD MILLION)
  • TABLE 143 BODY COMPOSITION ANALYZERS MARKET, BY REGION, 2022–2029 (USD MILLION)
  • TABLE 144 NORTH AMERICA: BODY COMPOSITION ANALYZERS MARKET, BY COUNTRY, 2022–2029 (USD MILLION)
  • TABLE 145 NORTH AMERICA: BODY COMPOSITION ANALYZERS MARKET, BY PRODUCT, 2022–2029 (USD MILLION)
  • TABLE 146 NORTH AMERICA: BIOIMPEDANCE ANALYZERS MARKET, BY TYPE, 2022–2029 (USD MILLION)
  • TABLE 147 NORTH AMERICA: BODY COMPOSITION ANALYZERS MARKET, BY MODALITY, 2022–2029 (USD MILLION)
  • TABLE 148 NORTH AMERICA: BODY COMPOSITION ANALYZERS MARKET, BY USAGE TYPE, 2022–2029 (USD MILLION)
  • TABLE 149 NORTH AMERICA: BODY COMPOSITION ANALYZERS MARKET, BY APPLICATION, 2022–2029 (USD MILLION)
  • TABLE 150 NORTH AMERICA: BODY COMPOSITION ANALYZERS MARKET, BY DISTRIBUTION CHANNEL, 2022–2029 (USD MILLION)
  • TABLE 151 NORTH AMERICA: BODY COMPOSITION ANALYZERS MARKET, BY END USER, 2022–2029 (USD MILLION)
  • TABLE 152 US: BODY COMPOSITION ANALYZERS MARKET, BY PRODUCT, 2022–2029 (USD MILLION)
  • TABLE 153 US: BIOIMPEDANCE ANALYZERS MARKET, BY TYPE, 2022–2029 (USD MILLION)
  • TABLE 154 US: BODY COMPOSITION ANALYZERS MARKET, BY MODALITY, 2022–2029 (USD MILLION)
  • TABLE 155 US: BODY COMPOSITION ANALYZERS MARKET, BY USAGE TYPE, 2022–2029 (USD MILLION)
  • TABLE 156 US: BODY COMPOSITION ANALYZERS MARKET, BY APPLICATION, 2022–2029 (USD MILLION)
  • TABLE 157 US: BODY COMPOSITION ANALYZERS MARKET, BY DISTRIBUTION CHANNEL, 2022–2029 (USD MILLION)
  • TABLE 158 US: BODY COMPOSITION ANALYZERS MARKET, BY END USER, 2022–2029 (USD MILLION)
  • TABLE 159 US: BODY COMPOSITION ANALYZERS MARKET FOR BIOIMPEDANCE ANALYZERS, BY END USER, 2022–2029 (UNITS)
  • TABLE 160 CANADA: BODY COMPOSITION ANALYZERS MARKET, BY PRODUCT, 2022–2029 (USD MILLION)
  • TABLE 161 CANADA: BIOIMPEDANCE ANALYZERS MARKET, BY TYPE, 2022–2029 (USD MILLION)
  • TABLE 162 CANADA: BODY COMPOSITION ANALYZERS MARKET, BY MODALITY, 2022–2029 (USD MILLION)
  • TABLE 163 CANADA: BODY COMPOSITION ANALYZERS MARKET, BY USAGE TYPE, 2022–2029 (USD MILLION)
  • TABLE 164 CANADA: BODY COMPOSITION ANALYZERS MARKET, BY APPLICATION, 2022–2029 (USD MILLION)
  • TABLE 165 CANADA: BODY COMPOSITION ANALYZERS MARKET, BY DISTRIBUTION CHANNEL, 2022–2029 (USD MILLION)
  • TABLE 166 CANADA: BODY COMPOSITION ANALYZERS MARKET, BY END USER, 2022–2029 (USD MILLION)
  • TABLE 167 EUROPE: BODY COMPOSITION ANALYZERS MARKET, BY COUNTRY, 2022–2029 (USD MILLION)
  • TABLE 168 EUROPE: BODY COMPOSITION ANALYZERS MARKET, BY PRODUCT, 2022–2029 (USD MILLION)
  • TABLE 169 EUROPE: BIOIMPEDANCE ANALYZERS MARKET, BY TYPE, 2022–2029 (USD MILLION)
  • TABLE 170 EUROPE: BODY COMPOSITION ANALYZERS MARKET, BY MODALITY, 2022–2029 (USD MILLION)
  • TABLE 171 EUROPE: BODY COMPOSITION ANALYZERS MARKET, BY USAGE TYPE, 2022–2029 (USD MILLION)
  • TABLE 172 EUROPE: BODY COMPOSITION ANALYZERS MARKET, BY APPLICATION, 2022–2029 (USD MILLION)
  • TABLE 173 EUROPE: BODY COMPOSITION ANALYZERS MARKET, BY DISTRIBUTION CHANNEL, 2022–2029 (USD MILLION)
  • TABLE 174 EUROPE: BODY COMPOSITION ANALYZERS MARKET, BY END USER, 2022–2029 (USD MILLION)
  • TABLE 175 GERMANY: BODY COMPOSITION ANALYZERS MARKET, BY PRODUCT, 2022–2029 (USD MILLION)
  • TABLE 176 GERMANY: BIOIMPEDANCE ANALYZERS MARKET, BY TYPE, 2022–2029 (USD MILLION)
  • TABLE 177 GERMANY: BODY COMPOSITION ANALYZERS MARKET, BY MODALITY, 2022–2029 (USD MILLION)
  • TABLE 178 GERMANY: BODY COMPOSITION ANALYZERS MARKET, BY USAGE TYPE, 2022–2029 (USD MILLION)
  • TABLE 179 GERMANY: BODY COMPOSITION ANALYZERS MARKET, BY APPLICATION, 2022–2029 (USD MILLION)
  • TABLE 180 GERMANY: BODY COMPOSITION ANALYZERS MARKET, BY DISTRIBUTION CHANNEL, 2022–2029 (USD MILLION)
  • TABLE 181 GERMANY: BODY COMPOSITION ANALYZERS MARKET, BY END USER, 2022–2029 (USD MILLION)
  • TABLE 182 FRANCE: BODY COMPOSITION ANALYZERS MARKET, BY PRODUCT, 2022–2029 (USD MILLION)
  • TABLE 183 FRANCE: BIOIMPEDANCE ANALYZERS MARKET, BY TYPE, 2022–2029 (USD MILLION)
  • TABLE 184 FRANCE: BODY COMPOSITION ANALYZERS MARKET, BY MODALITY, 2022–2029 (USD MILLION)
  • TABLE 185 FRANCE: BODY COMPOSITION ANALYZERS MARKET, BY USAGE TYPE, 2022–2029 (USD MILLION)
  • TABLE 186 FRANCE: BODY COMPOSITION ANALYZERS MARKET, BY APPLICATION, 2022–2029 (USD MILLION)
  • TABLE 187 FRANCE: BODY COMPOSITION ANALYZERS MARKET, BY DISTRIBUTION CHANNEL, 2022–2029 (USD MILLION)
  • TABLE 188 FRANCE: BODY COMPOSITION ANALYZERS MARKET, BY END USER, 2022–2029 (USD MILLION)
  • TABLE 189 UK: BODY COMPOSITION ANALYZERS MARKET, BY PRODUCT, 2022–2029 (USD MILLION)
  • TABLE 190 UK: BIOIMPEDANCE ANALYZERS MARKET, BY TYPE, 2022–2029 (USD MILLION)
  • TABLE 191 UK: BODY COMPOSITION ANALYZERS MARKET, BY MODALITY, 2022–2029 (USD MILLION)
  • TABLE 192 UK: BODY COMPOSITION ANALYZERS MARKET, BY USAGE TYPE, 2022–2029 (USD MILLION)
  • TABLE 193 UK: BODY COMPOSITION ANALYZERS MARKET, BY APPLICATION, 2022–2029 (USD MILLION)
  • TABLE 194 UK: BODY COMPOSITION ANALYZERS MARKET, BY DISTRIBUTION CHANNEL, 2022–2029 (USD MILLION)
  • TABLE 195 UK: BODY COMPOSITION ANALYZERS MARKET, BY END USER, 2022–2029 (USD MILLION)
  • TABLE 196 ITALY: BODY COMPOSITION ANALYZERS MARKET, BY PRODUCT, 2022–2029 (USD MILLION)
  • TABLE 197 ITALY: BIOIMPEDANCE ANALYZERS MARKET, BY TYPE, 2022–2029 (USD MILLION)
  • TABLE 198 ITALY: BODY COMPOSITION ANALYZERS MARKET, BY MODALITY, 2022–2029 (USD MILLION)
  • TABLE 199 ITALY: BODY COMPOSITION ANALYZERS MARKET, BY USAGE TYPE, 2022–2029 (USD MILLION)
  • TABLE 200 ITALY: BODY COMPOSITION ANALYZERS MARKET, BY APPLICATION, 2022–2029 (USD MILLION)
  • TABLE 201 ITALY: BODY COMPOSITION ANALYZERS MARKET, BY DISTRIBUTION CHANNEL, 2022–2029 (USD MILLION)
  • TABLE 202 ITALY: BODY COMPOSITION ANALYZERS MARKET, BY END USER, 2022–2029 (USD MILLION)
  • TABLE 203 SPAIN: BODY COMPOSITION ANALYZERS MARKET, BY PRODUCT, 2022–2029 (USD MILLION)
  • TABLE 204 SPAIN: BIOIMPEDANCE ANALYZERS MARKET, BY TYPE, 2022–2029 (USD MILLION)
  • TABLE 205 SPAIN: BODY COMPOSITION ANALYZERS MARKET, BY MODALITY, 2022–2029 (USD MILLION)
  • TABLE 206 SPAIN: BODY COMPOSITION ANALYZERS MARKET, BY USAGE TYPE, 2022–2029 (USD MILLION)
  • TABLE 207 SPAIN: BODY COMPOSITION ANALYZERS MARKET, BY APPLICATION, 2022–2029 (USD MILLION)
  • TABLE 208 SPAIN: BODY COMPOSITION ANALYZERS MARKET, BY DISTRIBUTION CHANNEL, 2022–2029 (USD MILLION)
  • TABLE 209 SPAIN: BODY COMPOSITION ANALYZERS MARKET, BY END USER, 2022–2029 (USD MILLION)
  • TABLE 210 REST OF EUROPE: BODY COMPOSITION ANALYZERS MARKET, BY PRODUCT, 2022–2029 (USD MILLION)
  • TABLE 211 REST OF EUROPE: BIOIMPEDANCE ANALYZERS MARKET, BY TYPE, 2022–2029 (USD MILLION)
  • TABLE 212 REST OF EUROPE: BODY COMPOSITION ANALYZERS MARKET, BY MODALITY, 2022–2029 (USD MILLION)
  • TABLE 213 REST OF EUROPE: BODY COMPOSITION ANALYZERS MARKET, BY USAGE TYPE, 2022–2029 (USD MILLION)
  • TABLE 214 REST OF EUROPE: BODY COMPOSITION ANALYZERS MARKET, BY APPLICATION, 2022–2029 (USD MILLION)
  • TABLE 215 REST OF EUROPE: BODY COMPOSITION ANALYZERS MARKET, BY DISTRIBUTION CHANNEL, 2022–2029 (USD MILLION)
  • TABLE 216 REST OF EUROPE: BODY COMPOSITION ANALYZERS MARKET, BY END USER, 2022–2029 (USD MILLION)
  • TABLE 217 ASIA PACIFIC: BODY COMPOSITION ANALYZERS MARKET, BY COUNTRY, 2022–2029 (USD MILLION)
  • TABLE 218 ASIA PACIFIC: BODY COMPOSITION ANALYZERS MARKET, BY PRODUCT, 2022–2029 (USD MILLION)
  • TABLE 219 ASIA PACIFIC: BIOIMPEDANCE ANALYZERS MARKET, BY TYPE, 2022–2029 (USD MILLION)
  • TABLE 220 ASIA PACIFIC: BODY COMPOSITION ANALYZERS MARKET, BY MODALITY, 2022–2029 (USD MILLION)
  • TABLE 221 ASIA PACIFIC: BODY COMPOSITION ANALYZERS MARKET, BY USAGE TYPE, 2022–2029 (USD MILLION)
  • TABLE 222 ASIA PACIFIC: BODY COMPOSITION ANALYZERS MARKET, BY APPLICATION, 2022–2029 (USD MILLION)
  • TABLE 223 ASIA PACIFIC: BODY COMPOSITION ANALYZERS MARKET, BY DISTRIBUTION CHANNEL, 2022–2029 (USD MILLION)
  • TABLE 224 ASIA PACIFIC: BODY COMPOSITION ANALYZERS MARKET, BY END USER, 2022–2029 (USD MILLION)
  • TABLE 225 JAPAN: BODY COMPOSITION ANALYZERS MARKET, BY PRODUCT, 2022–2029 (USD MILLION)
  • TABLE 226 JAPAN: BIOIMPEDANCE ANALYZERS MARKET, BY TYPE, 2022–2029 (USD MILLION)
  • TABLE 227 JAPAN: BODY COMPOSITION ANALYZERS MARKET, BY MODALITY, 2022–2029 (USD MILLION)
  • TABLE 228 JAPAN: BODY COMPOSITION ANALYZERS MARKET, BY USAGE TYPE, 2022–2029 (USD MILLION)
  • TABLE 229 JAPAN: BODY COMPOSITION ANALYZERS MARKET, BY APPLICATION, 2022–2029 (USD MILLION)
  • TABLE 230 JAPAN: BODY COMPOSITION ANALYZERS MARKET, BY DISTRIBUTION CHANNEL, 2022–2029 (USD MILLION)
  • TABLE 231 JAPAN: BODY COMPOSITION ANALYZERS MARKET, BY END USER, 2022–2029 (USD MILLION)
  • TABLE 232 CHINA: BODY COMPOSITION ANALYZERS MARKET, BY PRODUCT, 2022–2029 (USD MILLION)
  • TABLE 233 CHINA: BIOIMPEDANCE ANALYZERS MARKET, BY TYPE, 2022–2029 (USD MILLION)
  • TABLE 234 CHINA: BODY COMPOSITION ANALYZERS MARKET, BY MODALITY, 2022–2029 (USD MILLION)
  • TABLE 235 CHINA: BODY COMPOSITION ANALYZERS MARKET, BY USAGE TYPE, 2022–2029 (USD MILLION)
  • TABLE 236 CHINA: BODY COMPOSITION ANALYZERS MARKET, BY APPLICATION, 2022–2029 (USD MILLION)
  • TABLE 237 CHINA: BODY COMPOSITION ANALYZERS MARKET, BY DISTRIBUTION CHANNEL, 2022–2029 (USD MILLION)
  • TABLE 238 CHINA: BODY COMPOSITION ANALYZERS MARKET, BY END USER, 2022–2029 (USD MILLION)
  • TABLE 239 INDIA: BODY COMPOSITION ANALYZERS MARKET, BY PRODUCT, 2022–2029 (USD MILLION)
  • TABLE 240 INDIA: BIOIMPEDANCE ANALYZERS MARKET, BY TYPE, 2022–2029 (USD MILLION)
  • TABLE 241 INDIA: BODY COMPOSITION ANALYZERS MARKET, BY MODALITY, 2022–2029 (USD MILLION)
  • TABLE 242 INDIA: BODY COMPOSITION ANALYZERS MARKET, BY USAGE TYPE, 2022–2029 (USD MILLION)
  • TABLE 243 INDIA: BODY COMPOSITION ANALYZERS MARKET, BY APPLICATION, 2022–2029 (USD MILLION)
  • TABLE 244 INDIA: BODY COMPOSITION ANALYZERS MARKET, BY DISTRIBUTION CHANNEL, 2022–2029 (USD MILLION)
  • TABLE 245 INDIA: BODY COMPOSITION ANALYZERS MARKET, BY END USER, 2022–2029 (USD MILLION)
  • TABLE 246 REST OF ASIA PACIFIC: BODY COMPOSITION ANALYZERS MARKET, BY PRODUCT, 2022–2029 (USD MILLION)
  • TABLE 247 REST OF ASIA PACIFIC: BIOIMPEDANCE ANALYZERS MARKET, BY TYPE, 2022–2029 (USD MILLION)
  • TABLE 248 REST OF ASIA PACIFIC: BODY COMPOSITION ANALYZERS MARKET, BY MODALITY, 2022–2029 (USD MILLION)
  • TABLE 249 REST OF ASIA PACIFIC: BODY COMPOSITION ANALYZERS MARKET, BY USAGE TYPE, 2022–2029 (USD MILLION)
  • TABLE 250 REST OF ASIA PACIFIC: BODY COMPOSITION ANALYZERS MARKET, BY APPLICATION, 2022–2029 (USD MILLION)
  • TABLE 251 REST OF ASIA PACIFIC: BODY COMPOSITION ANALYZERS MARKET, BY DISTRIBUTION CHANNEL, 2022–2029 (USD MILLION)
  • TABLE 252 REST OF ASIA PACIFIC: BODY COMPOSITION ANALYZERS MARKET, BY END USER, 2022–2029 (USD MILLION)
  • TABLE 253 LATIN AMERICA: BODY COMPOSITION ANALYZERS MARKET, BY COUNTRY, 2022–2029 (USD MILLION)
  • TABLE 254 LATIN AMERICA: BODY COMPOSITION ANALYZERS MARKET, BY PRODUCT, 2022–2029 (USD MILLION)
  • TABLE 255 LATIN AMERICA: BIOIMPEDANCE ANALYZERS MARKET, BY TYPE, 2022–2029 (USD MILLION)
  • TABLE 256 LATIN AMERICA: BODY COMPOSITION ANALYZERS MARKET, BY MODALITY, 2022–2029 (USD MILLION)
  • TABLE 257 LATIN AMERICA: BODY COMPOSITION ANALYZERS MARKET, BY USAGE TYPE, 2022–2029 (USD MILLION)
  • TABLE 258 LATIN AMERICA: BODY COMPOSITION ANALYZERS MARKET, BY APPLICATION, 2022–2029 (USD MILLION)
  • TABLE 259 LATIN AMERICA: BODY COMPOSITION ANALYZERS MARKET, BY DISTRIBUTION CHANNEL, 2022–2029 (USD MILLION)
  • TABLE 260 LATIN AMERICA: BODY COMPOSITION ANALYZERS MARKET, BY END USER, 2022–2029 (USD MILLION)
  • TABLE 261 BRAZIL: BODY COMPOSITION ANALYZERS MARKET, BY PRODUCT, 2022–2029 (USD MILLION)
  • TABLE 262 BRAZIL: BIOIMPEDANCE ANALYZERS MARKET, BY TYPE, 2022–2029 (USD MILLION)
  • TABLE 263 BRAZIL: BODY COMPOSITION ANALYZERS MARKET, BY MODALITY, 2022–2029 (USD MILLION)
  • TABLE 264 BRAZIL: BODY COMPOSITION ANALYZERS MARKET, BY USAGE TYPE, 2022–2029 (USD MILLION)
  • TABLE 265 BRAZIL: BODY COMPOSITION ANALYZERS MARKET, BY APPLICATION, 2022–2029 (USD MILLION)
  • TABLE 266 BRAZIL: BODY COMPOSITION ANALYZERS MARKET, BY DISTRIBUTION CHANNEL, 2022–2029 (USD MILLION)
  • TABLE 267 BRAZIL: BODY COMPOSITION ANALYZERS MARKET, BY END USER, 2022–2029 (USD MILLION)
  • TABLE 268 MEXICO: BODY COMPOSITION ANALYZERS MARKET, BY PRODUCT, 2022–2029 (USD MILLION)
  • TABLE 269 MEXICO: BIOIMPEDANCE ANALYZERS MARKET, BY TYPE, 2022–2029 (USD MILLION)
  • TABLE 270 MEXICO: BODY COMPOSITION ANALYZERS MARKET, BY MODALITY, 2022–2029 (USD MILLION)
  • TABLE 271 MEXICO: BODY COMPOSITION ANALYZERS MARKET, BY USAGE TYPE, 2022–2029 (USD MILLION)
  • TABLE 272 MEXICO: BODY COMPOSITION ANALYZERS MARKET, BY APPLICATION, 2022–2029 (USD MILLION)
  • TABLE 273 MEXICO: BODY COMPOSITION ANALYZERS MARKET, BY DISTRIBUTION CHANNEL, 2022–2029 (USD MILLION)
  • TABLE 274 MEXICO: BODY COMPOSITION ANALYZERS MARKET, BY END USER, 2022–2029 (USD MILLION)
  • TABLE 275 REST OF LATIN AMERICA: BODY COMPOSITION ANALYZERS MARKET, BY PRODUCT, 2022–2029 (USD MILLION)
  • TABLE 276 REST OF LATIN AMERICA: BIOIMPEDANCE ANALYZERS MARKET, BY TYPE, 2022–2029 (USD MILLION)
  • TABLE 277 REST OF LATIN AMERICA: BODY COMPOSITION ANALYZERS MARKET, BY MODALITY, 2022–2029 (USD MILLION)
  • TABLE 278 REST OF LATIN AMERICA: BODY COMPOSITION ANALYZERS MARKET, BY USAGE TYPE, 2022–2029 (USD MILLION)
  • TABLE 279 REST OF LATIN AMERICA: BODY COMPOSITION ANALYZERS MARKET, BY APPLICATION, 2022–2029 (USD MILLION)
  • TABLE 280 REST OF LATIN AMERICA: BODY COMPOSITION ANALYZERS MARKET, BY DISTRIBUTION CHANNEL, 2022–2029 (USD MILLION)
  • TABLE 281 REST OF LATIN AMERICA: BODY COMPOSITION ANALYZERS MARKET, BY END USER, 2022–2029 (USD MILLION)
  • TABLE 282 MIDDLE EAST & AFRICA: BODY COMPOSITION ANALYZERS MARKET, BY PRODUCT, 2022–2029 (USD MILLION)
  • TABLE 283 MIDDLE EAST & AFRICA: BIOIMPEDANCE ANALYZERS MARKET, BY TYPE, 2022–2029 (USD MILLION)
  • TABLE 284 MIDDLE EAST & AFRICA: BODY COMPOSITION ANALYZERS MARKET, BY MODALITY, 2022–2029 (USD MILLION)
  • TABLE 285 MIDDLE EAST & AFRICA: BODY COMPOSITION ANALYZERS MARKET, BY USAGE TYPE, 2022–2029 (USD MILLION)
  • TABLE 286 MIDDLE EAST & AFRICA: BODY COMPOSITION ANALYZERS MARKET, BY APPLICATION, 2022–2029 (USD MILLION)
  • TABLE 287 MIDDLE EAST & AFRICA: BODY COMPOSITION ANALYZERS MARKET, BY DISTRIBUTION CHANNEL, 2022–2029 (USD MILLION)
  • TABLE 288 MIDDLE EAST & AFRICA: BODY COMPOSITION ANALYZERS MARKET, BY END USER, 2022–2029 (USD MILLION)
  • TABLE 289 GCC COUNTRIES: BODY COMPOSITION ANALYZERS MARKET, BY COUNTRY, 2022–2029 (USD MILLION)
  • TABLE 290 GCC COUNTRIES: BODY COMPOSITION ANALYZERS MARKET, BY PRODUCT, 2022–2029 (USD MILLION)
  • TABLE 291 GCC COUNTRIES: BIOIMPEDANCE ANALYZERS MARKET, BY TYPE, 2022–2029 (USD MILLION)
  • TABLE 292 GCC COUNTRIES: BODY COMPOSITION ANALYZERS MARKET, BY MODALITY, 2022–2029 (USD MILLION)
  • TABLE 293 GCC COUNTRIES: BODY COMPOSITION ANALYZERS MARKET, BY USAGE TYPE, 2022–2029 (USD MILLION)
  • TABLE 294 GCC COUNTRIES: BODY COMPOSITION ANALYZERS MARKET, BY APPLICATION, 2022–2029 (USD MILLION)
  • TABLE 295 GCC COUNTRIES: BODY COMPOSITION ANALYZERS MARKET, BY DISTRIBUTION CHANNEL, 2022–2029 (USD MILLION)
  • TABLE 296 GCC COUNTRIES: BODY COMPOSITION ANALYZERS MARKET, BY END USER, 2022–2029 (USD MILLION)
  • TABLE 297 KINGDOM OF SAUDI ARABIA: BODY COMPOSITION ANALYZERS MARKET, BY PRODUCT, 2022–2029 (USD MILLION)
  • TABLE 298 KINGDOM OF SAUDI ARABIA: BIOIMPEDANCE ANALYZERS MARKET, BY TYPE, 2022–2029 (USD MILLION)
  • TABLE 299 KINGDOM OF SAUDI ARABIA: BODY COMPOSITION ANALYZERS MARKET, BY MODALITY, 2022–2029 (USD MILLION)
  • TABLE 300 KINGDOM OF SAUDI ARABIA: BODY COMPOSITION ANALYZERS MARKET, BY USAGE TYPE, 2022–2029 (USD MILLION)
  • TABLE 301 KINGDOM OF SAUDI ARABIA: BODY COMPOSITION ANALYZERS MARKET, BY APPLICATION, 2022–2029 (USD MILLION)
  • TABLE 302 KINGDOM OF SAUDI ARABIA: BODY COMPOSITION ANALYZERS MARKET, BY DISTRIBUTION CHANNEL, 2022–2029 (USD MILLION)
  • TABLE 303 KINGDOM OF SAUDI ARABIA: BODY COMPOSITION ANALYZERS MARKET, BY END USER, 2022–2029 (USD MILLION)
  • TABLE 304 UNITED ARAB EMIRATES: BODY COMPOSITION ANALYZERS MARKET, BY PRODUCT, 2022–2029 (USD MILLION)
  • TABLE 305 UNITED ARAB EMIRATES: BIOIMPEDANCE ANALYZERS MARKET, BY TYPE, 2022–2029 (USD MILLION)
  • TABLE 306 UNITED ARAB EMIRATES: BODY COMPOSITION ANALYZERS MARKET, BY MODALITY, 2022–2029 (USD MILLION)
  • TABLE 307 UNITED ARAB EMIRATES: BODY COMPOSITION ANALYZERS MARKET, BY USAGE TYPE, 2022–2029 (USD MILLION)
  • TABLE 308 UNITED ARAB EMIRATES: BODY COMPOSITION ANALYZERS MARKET, BY APPLICATION, 2022–2029 (USD MILLION)
  • TABLE 309 UNITED ARAB EMIRATES: BODY COMPOSITION ANALYZERS MARKET, BY DISTRIBUTION CHANNEL, 2022–2029 (USD MILLION)
  • TABLE 310 UNITED ARAB EMIRATES: BODY COMPOSITION ANALYZERS MARKET, BY END USER, 2022–2029 (USD MILLION)
  • TABLE 311 OTHER GCC COUNTRIES: BODY COMPOSITION ANALYZERS MARKET, BY PRODUCT, 2022–2029 (USD MILLION)
  • TABLE 312 OTHER GCC COUNTRIES: BIOIMPEDANCE ANALYZERS MARKET, BY TYPE, 2022–2029 (USD MILLION)
  • TABLE 313 OTHER GCC COUNTRIES: BODY COMPOSITION ANALYZERS MARKET, BY MODALITY, 2022–2029 (USD MILLION)
  • TABLE 314 OTHER GCC COUNTRIES: BODY COMPOSITION ANALYZERS MARKET, BY USAGE TYPE, 2022–2029 (USD MILLION)
  • TABLE 315 OTHER GCC COUNTRIES: BODY COMPOSITION ANALYZERS MARKET, BY APPLICATION, 2022–2029 (USD MILLION)
  • TABLE 316 OTHER GCC COUNTRIES: BODY COMPOSITION ANALYZERS MARKET, BY DISTRIBUTION CHANNEL, 2022–2029 (USD MILLION)
  • TABLE 317 OTHER GCC COUNTRIES: BODY COMPOSITION ANALYZERS MARKET, BY END USER, 2022–2029 (USD MILLION)
  • TABLE 318 OVERVIEW OF STRATEGIES ADOPTED BY KEY BODY COMPOSITION ANALYZER MANUFACTURING COMPANIES
  • TABLE 319 BODY COMPOSITION ANALYZERS MARKET: DEGREE OF COMPETITION
  • TABLE 320 BODY COMPOSITION ANALYZERS MARKET: PRODUCT FOOTPRINT
  • TABLE 321 BODY COMPOSITION ANALYZERS MARKET: MODALITY FOOTPRINT
  • TABLE 322 BODY COMPOSITION ANALYZERS MARKET: APPLICATION FOOTPRINT
  • TABLE 323 BODY COMPOSITION ANALYZERS MARKET: REGION FOOTPRINT
  • TABLE 324 BODY COMPOSITION ANALYZERS MARKET: DETAILED LIST OF KEY START-UPS/SME PLAYERS
  • TABLE 325 BODY COMPOSITION ANALYZERS MARKET: COMPETITIVE BENCHMARKING OF KEY START-UPS/SMES
  • TABLE 326 BODY COMPOSITION ANALYZERS MARKET: DEALS, JANUARY 2021–MAY 2024
  • TABLE 327 BODY COMPOSITION ANALYZERS MARKET: EXPANSIONS, JANUARY 2021–MAY 2024
  • TABLE 328 OMRON CORPORATION: COMPANY OVERVIEW
  • TABLE 329 OMRON CORPORATION: PRODUCTS OFFERED
  • TABLE 330 OMRON CORPORATION: EXPANSIONS, JANUARY 2021–MARCH 2024
  • TABLE 331 HOLOGIC, INC.: COMPANY OVERVIEW
  • TABLE 332 HOLOGIC, INC.: PRODUCTS OFFERED
  • TABLE 333 GE HEALTHCARE: COMPANY OVERVIEW
  • TABLE 334 GE HEALTHCARE: PRODUCTS OFFERED
  • TABLE 335 INBODY CO., LTD.: COMPANY OVERVIEW
  • TABLE 336 INBODY CO., LTD.: PRODUCTS OFFERED
  • TABLE 337 INBODY CO., LTD.: DEALS, JANUARY 2021–MARCH 2024
  • TABLE 338 RJL SYSTEMS: COMPANY OVERVIEW
  • TABLE 339 RJL SYSTEMS: PRODUCTS OFFERED
  • TABLE 340 COSMED SRL: COMPANY OVERVIEW
  • TABLE 341 COSMED SRL: PRODUCTS OFFERED
  • TABLE 342 SECA GMBH & CO. KG: COMPANY OVERVIEW
  • TABLE 343 SECA GMBH & CO. KG: PRODUCTS OFFERED
  • TABLE 344 TANITA CORPORATION: COMPANY OVERVIEW
  • TABLE 345 TANITA CORPORATION: PRODUCTS OFFERED
  • TABLE 346 CHARDER ELECTRONIC CO. LTD.: COMPANY OVERVIEW
  • TABLE 347 CHARDER ELECTRONIC CO. LTD.: PRODUCTS OFFERED
  • TABLE 348 SELVAS HEALTHCARE: COMPANY OVERVIEW
  • TABLE 349 SELVAS HEALTHCARE: PRODUCTS OFFERED
  • TABLE 350 EVOLT: COMPANY OVERVIEW
  • TABLE 351 EVOLT: PRODUCTS OFFERED
  • TABLE 352 MALTRON INTERNATIONAL LTD.: COMPANY OVERVIEW
  • TABLE 353 TONGFAND HEALTH TECHNOLOGY (BEIJING) CO., LTD.: COMPANY OVERVIEW
  • TABLE 354 BIOTEKNA: COMPANY OVERVIEW
  • TABLE 355 FOOK TIN TECHNOLOGIES LTD.: COMPANY OVERVIEW
  • TABLE 356 BIODYNAMICS CORPORATION: COMPANY OVERVIEW
  • TABLE 357 BIOPARHOM: COMPANY OVERVIEW
  • TABLE 358 MICROLIFE CORPORATION: COMPANY OVERVIEW
  • TABLE 359 NUMED S.A.R.L.: COMPANY OVERVIEW
  • TABLE 360 SHANGHAI GOLDENWELL MEDICAL TECHNOLOGY CO. LTD.: COMPANY OVERVIEW
  • TABLE 361 SAMCO MEDICAL: COMPANY OVERVIEW
  • TABLE 362 SWISSRAY: COMPANY OVERVIEW
  • TABLE 363 OSTEOSYS CORP.: COMPANY OVERVIEW
  • TABLE 364 EXERTECH: COMPANY OVERVIEW
  • TABLE 365 AKERN S.R.L.: COMPANY OVERVIEW
  • TABLE 366 WITHINGS: COMPANY OVERVIEW
LIST OF FIGURES
 
  • FIGURE 1 BODY COMPOSITION ANALYZERS MARKET: MARKET SEGMENTS COVERED
  • FIGURE 2 BODY COMPOSITION ANALYZERS MARKET: REGIONS COVERED
  • FIGURE 3 BODY COMPOSITION ANALYZERS MARKET: RESEARCH DESIGN
  • FIGURE 4 BREAKDOWN OF PRIMARY INTERVIEWS: BY COMPANY TYPE, DESIGNATION, AND REGION
  • FIGURE 5 BOTTOM-UP APPROACH: COMPANY REVENUE ESTIMATION APPROACH
  • FIGURE 6 CAGR PROJECTIONS: SUPPLY-SIDE ANALYSIS
  • FIGURE 7 BODY COMPOSITION ANALYZERS MARKET: TOP-DOWN APPROACH
  • FIGURE 8 DATA TRIANGULATION METHODOLOGY
  • FIGURE 9 BODY COMPOSITION ANALYZERS MARKET: STUDY ASSUMPTIONS
  • FIGURE 10 BODY COMPOSITION ANALYZERS MARKET, BY PRODUCT, 2024 VS. 2029 (USD MILLION)
  • FIGURE 11 BODY COMPOSITION ANALYZERS MARKET, BY MODALITY, 2024 VS. 2029 (USD MILLION)
  • FIGURE 12 BODY COMPOSITION ANALYZERS MARKET, BY USAGE TYPE, 2024 VS. 2029 (USD MILLION)
  • FIGURE 13 BODY COMPOSITION ANALYZERS MARKET, BY APPLICATION, 2024 VS. 2029 (USD MILLION)
  • FIGURE 14 BODY COMPOSITION ANALYZERS MARKET, BY DISTRIBUTION CHANNEL, 2024 VS. 2029 (USD MILLION)
  • FIGURE 15 BODY COMPOSITION ANALYZERS MARKET, BY END USER, 2024 VS. 2029 (USD MILLION)
  • FIGURE 16 BODY COMPOSITION ANALYZERS MARKET, BY REGION, 2024 VS. 2029 (USD MILLION)
  • FIGURE 17 RISING PREVALENCE OF OBESITY AND SUBSEQUENT RISE IN METABOLIC DISORDERS TO DRIVE MARKET
  • FIGURE 18 BIOIMPEDANCE ANALYZERS SEGMENT TO REGISTER HIGHEST GROWTH RATE DURING FORECAST PERIOD
  • FIGURE 19 BIOIMPEDANCE ANALYZERS SEGMENT ACCOUNTED FOR LARGEST MARKET SHARE IN 2023
  • FIGURE 20 EMERGING ECONOMIES TO REGISTER HIGHER GROWTH RATES DURING FORECAST PERIOD
  • FIGURE 21 BODY COMPOSITION ANALYZERS MARKET: DRIVERS, RESTRAINTS, OPPORTUNITIES, AND CHALLENGES
  • FIGURE 22 BODY COMPOSITION ANALYZERS MARKET: VALUE CHAIN ANALYSIS
  • FIGURE 23 BODY COMPOSITION ANALYZERS MARKET: SUPPLY CHAIN ANALYSIS
  • FIGURE 24 BODY COMPOSITION ANALYZERS MARKET: PORTER’S FIVE FORCES ANALYSIS
  • FIGURE 25 BODY COMPOSITION ANALYZERS MARKET: ECOSYSTEM MARKET/MAP
  • FIGURE 26 REVENUE SHIFT IN BODY COMPOSITION ANALYZERS MARKET
  • FIGURE 27 INFLUENCE OF STAKEHOLDERS ON BUYING PROCESS OF BODY COMPOSITION ANALYZER PRODUCTS
  • FIGURE 28 KEY BUYING CRITERIA FOR BODY COMPOSITION ANALYZER PRODUCTS
  • FIGURE 29 INVESTMENT AND FUNDING SCENARIO FOR KEY PLAYERS IN BODY COMPOSITION ANALYZERS MARKET (2018−2023)
  • FIGURE 30 NORTH AMERICA: BODY COMPOSITION ANALYZERS MARKET SNAPSHOT
  • FIGURE 31 ASIA PACIFIC: BODY COMPOSITION ANALYZERS MARKET SNAPSHOT
  • FIGURE 32 REVENUE ANALYSIS OF KEY PLAYERS IN BODY COMPOSITION ANALYZERS MARKET, 2021−2023 (USD MILLION)
  • FIGURE 33 MARKET SHARE ANALYSIS OF KEY PLAYERS IN BODY COMPOSITION MARKET (2023)
  • FIGURE 34 BODY COMPOSITION ANALYZERS MARKET: COMPANY EVALUATION MATRIX (KEY PLAYERS), 2023
  • FIGURE 35 BODY COMPOSITION ANALYZERS MARKET: COMPANY FOOTPRINT
  • FIGURE 36 BODY COMPOSITION ANALYZERS MARKET: COMPANY EVALUATION MATRIX (START-UPS/SMES), 2023
  • FIGURE 37 EV/EBITDA OF KEY VENDORS
  • FIGURE 38 YEAR-TO-DATE (YTD) PRICE TOTAL RETURN AND 5-YEAR STOCK BETA OF KEY VENDORS
  • FIGURE 39 DEXA SYSTEMS: BRAND/PRODUCT COMPARATIVE ANALYSIS
  • FIGURE 40 OMRON CORPORATION: COMPANY SNAPSHOT (2023)
  • FIGURE 41 HOLOGIC, INC.: COMPANY SNAPSHOT (2023)
  • FIGURE 42 GE HEALTHCARE: COMPANY SNAPSHOT (2023)

The objective of the study is to analyze the key market dynamics, such as drivers, opportunities, restraints, challenges, and key player strategies. To track company developments such as acquisitions, product launches and approvals, expansions, agreements, and partnerships of the leading players, the competitive landscape of the body composition analyzers market to analyze market players on various parameters within the broad categories of business and product strategy. Top-down and bottom-up approaches were used to estimate the market size. To estimate the market size of segments and subsegments, the market breakdown and data triangulation were used.

The four steps involved in estimating the market size are

Secondary Research

In the secondary research process, various secondary sources such as annual reports, press releases & investor presentations of companies, white papers, certified publications, articles by recognized authors, gold-standard & silver-standard websites, regulatory bodies, and databases (such as D&B Hoovers, Bloomberg Business, and Factiva) were referred to identify and collect information for this study.

Primary Research

In the primary research process, various sources from both the supply and demand sides were interviewed to obtain qualitative and quantitative information for this report. Primary sources were mainly industry experts from the core and related industries and preferred suppliers, manufacturers, distributors, service providers, technology developers, researchers, and organizations related to all segments of this industry’s value chain. In-depth interviews were conducted with various primary respondents, including key industry participants, subject-matter experts, C-level executives of key market players, and industry consultants, to obtain and verify critical qualitative and quantitative information as well as assess prospects.

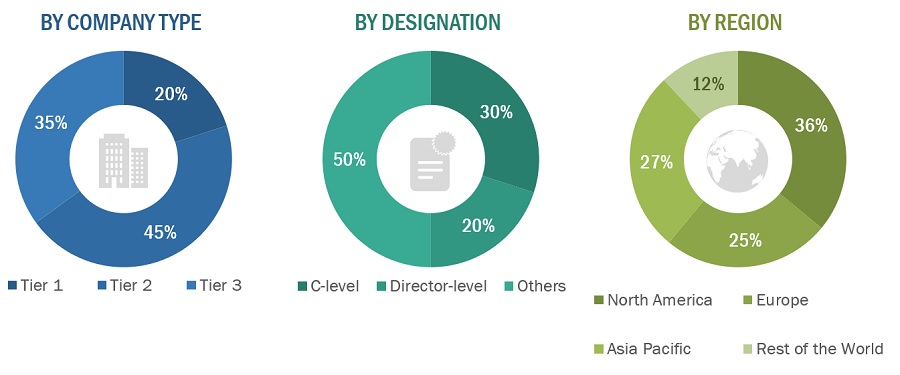
The following is a breakdown of the primary respondents:

Breakdown of Primary Participants:
Body Composition  Analyzers Market Size, and Share

Note 1: Others include sales managers, marketing managers, and product managers.

Note 2: Companies are classified into tiers based on their total revenues. As of 2022/2023, Tier 1 = >USD 100 million, Tier 2 = USD 10 million to USD 100 million, and Tier 3 = <USD 10 million.

To know about the assumptions considered for the study, download the pdf brochure

COMPANY NAME

DESIGNATION

MEDIANA Co., Ltd. (South Korea)

Chief Operating Officer

Tanita Corporation (Japan)

Sr. Marketing and Sales Executive

Market Size Estimation

Both top-down and bottom-up approaches were used to estimate and validate the body composition analyzers market's total size. These methods were also used extensively to estimate the size of various subsegments in the market. The research methodology used to estimate the market size includes the following:

  • The key players in the industry have been identified through extensive secondary research
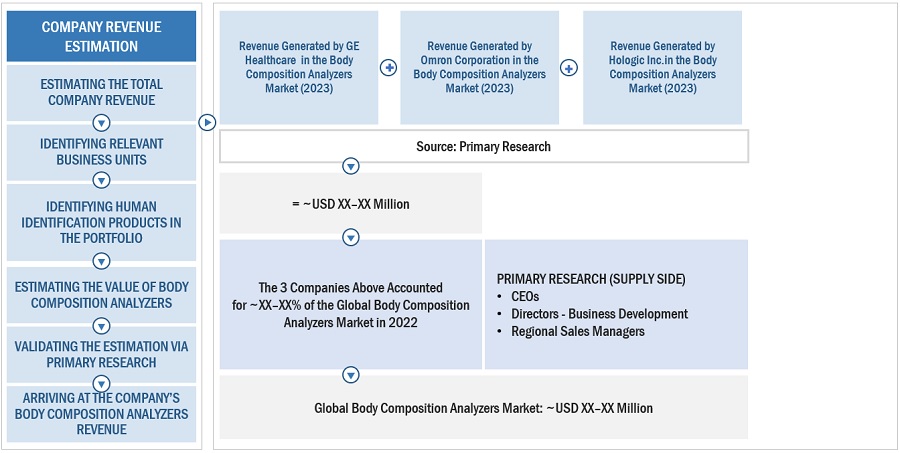
  • The revenues generated by leading players operating in the body composition analyzers market have been determined through primary and secondary research.
  • All percentage shares, splits, and breakdowns have been determined using secondary sources and verified through primary sources.

Global Body composition analyzers Market Size: Bottom Up Approach
Body Composition  Analyzers Market Size, and Share

To know about the assumptions considered for the study, Request for Free Sample Report

Global Body composition analyzers Market Size: Top-Down Approach

Body Composition  Analyzers Market Size, and Share

Data Triangulation

After arriving at the overall market size by applying the process mentioned above, the total market was split into several segments and subsegments. To complete the overall market engineering process and arrive at the exact statistics for all segments and subsegments, data triangulation and market breakdown procedures were employed, wherever applicable. The data was triangulated by studying various factors and trends from both the demand and supply sides.

Market Definition

Body composition analyzers assess the body by dividing it into core components such as body water, fat, protein, and minerals. This method offers a detailed and accurate breakdown of weight, providing key insights that traditional methods like BMI cannot offer.

Key Stakeholders

  • Senior Management
  • Hospitals & Clinics
  • Fitness clubs and wellness centers
  • Academic & research institutes
  • Finance/Procurement Department
  • R&D Department

Report Objectives

  • To define, describe, segment, and forecast the global body composition analyzers market by product, modality, usage type, application, distribution channel, end user, and region
  • To provide detailed information regarding the major factors influencing the market growth (such as drivers, restraints, opportunities, challenges, and trends)
  • To analyze the micromarkets with respect to individual growth trends, prospects, and contributions to the overall body composition analyzers market
  • To analyze market opportunities for stakeholders and provide details of the competitive landscape for key players
  • To forecast the size of the market segments with respect to six regions—North America, Europe, the Asia Pacific, Latin America, Middle East & Africa, and GCC Countries
  • To profile the key players and comprehensively analyze their product portfolios, market positions, and core competencies
  • To benchmark players within the market using the proprietary Company Evaluation Matrix framework, which analyzes market players on various parameters within the broad categories of business and product excellence

Available Customizations

MarketsandMarkets offers the following customizations for this market report.

Country Information

  • Additional country-level analysis of the body composition analyzers market

Company profiles

  • Additional five company profiles of players operating in the body composition analyzers market.

Product Analysis

  • Product matrix, which provides a detailed comparison of the product portfolio of each company in the body composition analyzers market

Previous Versions of this Report

Body Composition Analyzers Market by Product (Bio-impedance analyzer/DEXA/Skinfold calipers/ADP/Hydrostatic weighing), & End-users (Hospitals/Fitness & wellness centers/Academic & Research Center/Home-users) - Analysis & Global Forecasts to 2021

Report Code MD 3631
Published in Oct, 2016, By MarketsandMarkets™

Body Composition Analyzers Market by Product (Bioimpedance Analyzers (BIA), Dual-Energy X-ray Absorptiometry (DEXA), Skinfold Calipers, Air Displacement Plethysmography (ADP) and Hydrostatic Weighing) - Global Analysis & Forecast to 2019

Report Code MD 3631
Published in Jul, 2015, By MarketsandMarkets™

Custom Market Research Services

We Will Customise The Research For You, In Case The Report Listed Above Does Not Meet With Your Requirements

Get 10% Free Customisation

Growth opportunities and latent adjacency in Body Composition Analyzers Market

DMCA.com Protection Status