
Milking Automation Market Size, Share Analysis

Milking Automation Market by Offering (Hardware, Software, Services), Farm Size (Small, Medium, Large, Industrial), Livestock (Dairy Cattle, Sheep, Goat), End Use, Application, and Region - Global Forecast to 2030


OVERVIEW
Source: Secondary Research, Interviews with Experts, MarketsandMarkets Analysis
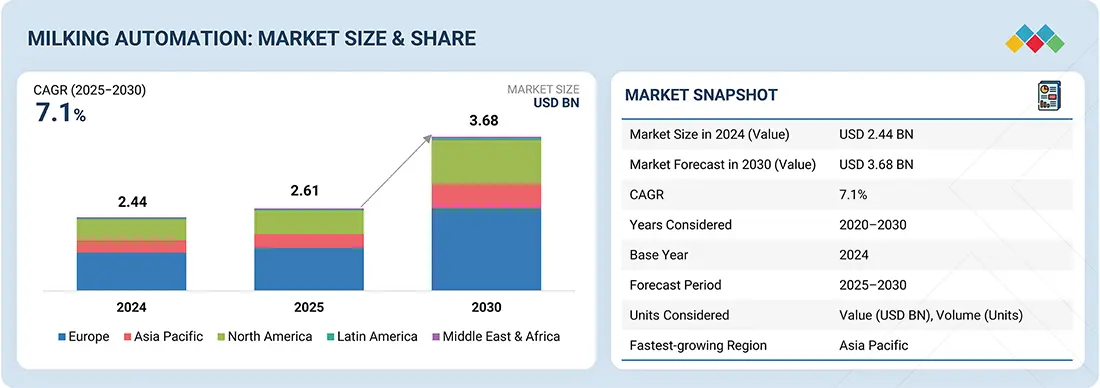
The milking automation industry is projected to reach USD 3.68 billion by 2030 from USD 2.61 billion in 2025, at a CAGR of 7.1% from 2025 to 2030. The global market is experiencing substantial and long-lasting growth, spurred by rising dairy consumption, continuing labor shortages in agriculture, and the desire for more efficiency and animal welfare across all farm sizes.
Market Size and Forecast:
- Market Size Value in 2024: USD 2.44 Billion
- Market Size Value in 2025: USD 2.61 Billion
- Revenue Forecast in 2030: USD 3.68 Billion
- Growth Rate: CAGR of 7.1% from 2025 to 2030
- Base year: 2024
- Forecast period: 2025–2030
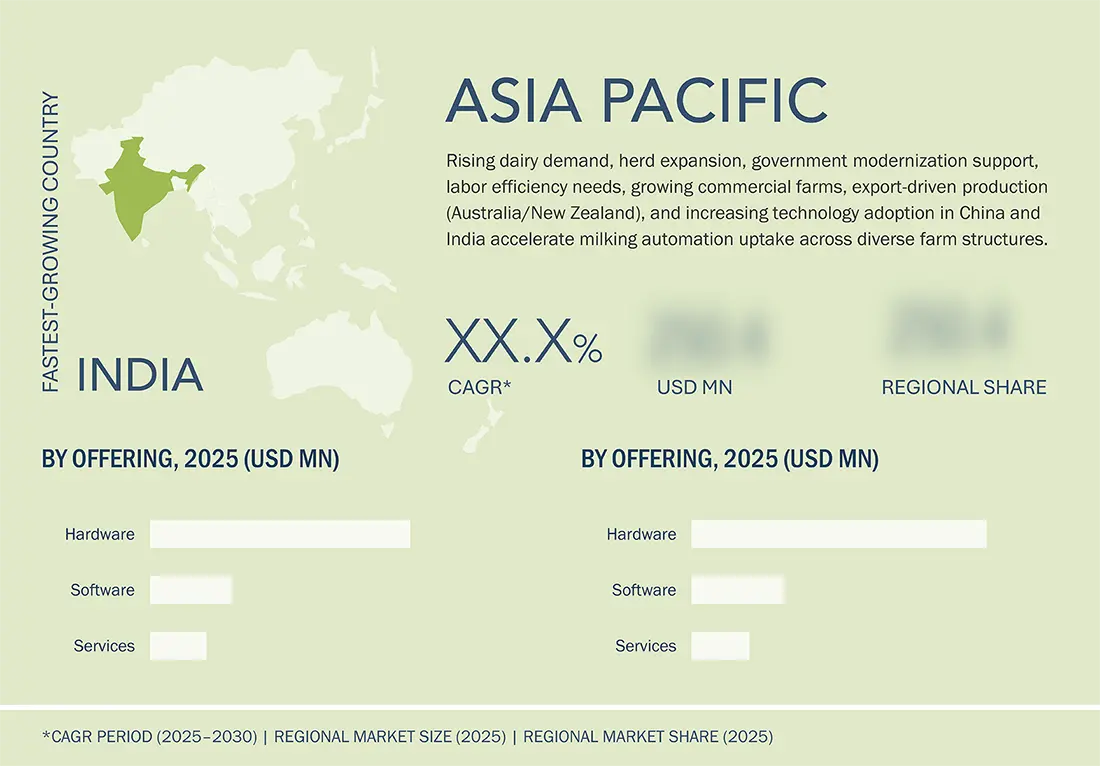
- Asia Pacific is expected to grow the fastest, at a CAGR of 8.5%.
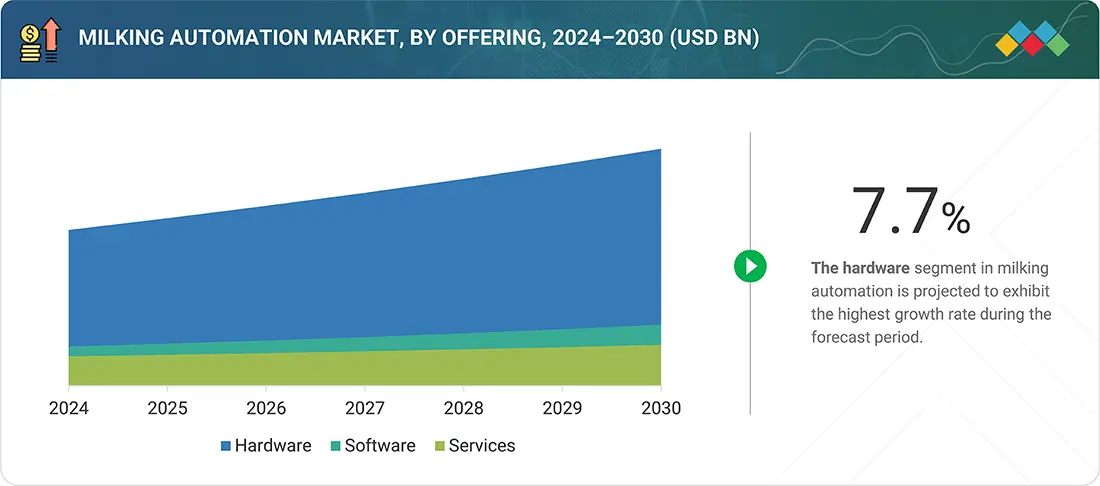
- The hardware segment in milking automation is projected to exhibit the highes growth rate during the forecast period.
Key Market Trends and Insights
- By Livestock: The Cattle segment contributes the largest share of the global milking automation market, driven by the widespread adoption of automated milking systems in dairy cattle farms, increasing focus on milk yield optimization, improved herd management, and the growing need for efficient dairy farm operations.
- Growing Trends: Dairy farmers are increasingly adopting automated milking solutions, including robotic milking machines, automated feeding systems, herd management software, and sensor-based monitoring technologies to enhance operational efficiency, optimize milk production, and improve animal health management.
- Growth Factors: Rising demand for dairy products, increasing adoption of precision dairy farming practices, labor shortages, growing investments in smart farming technologies, and advancements in automation, IoT, and data-driven livestock management are creating significant growth opportunities for the milking automation market.
- Emerging Opportunities: The integration of artificial intelligence, connected dairy farm solutions, real-time livestock monitoring, and cloud-based farm management platforms, along with the increasing adoption of automation technologies across emerging economies, is opening new avenues for market expansion.
KEY TAKEAWAYS
-
BY OFFERINGThe milking automation market includes hardware, software & services. The offering segment is dominated by robotic hardware, advanced software, and integrated services, with strong momentum for IoT-enabled milking robots and data-driven herd management. The fastest growth is seen for cloud-based control platforms and predictive analytics, reflecting rising demand for customizable, scalable, and connected solutions.
-
BY FARM SIZEDue to cost sensitivity, small-scale farms (up to 50 cows) increasingly utilize semi-automated and entry-level robotic systems. Mid-sized farms (51-200 cows) balance automation and manual processes, embracing integrated software for herd management. Large farms (201-500 cows) adopt fully automated systems with advanced data analytics.
-
BY LIVESTOCKIn the milking automation market, the dairy cattle segment dominates due to its large scale, established infrastructure, and high automation adoption driven by labor shortages and demand for efficiency. Goat and other small ruminant segments are gradually growing, with automation tailored for smaller herds and specialized milking equipment focused on adaptability and animal welfare.
-
BY APPLICATIONKey trends in milking automation applications highlight significant advances in milk extraction and yield monitoring, with intelligent sensors enabling precise, real-time data capture for every cow.
-
BY REGIONAsia Pacific is expected to grow the fastest, at a CAGR of 8.5%, driven by rising dairy consumption, structural shifts towards protein-rich diets, and significant greenfield investments in mega-dairies in countries like China and India. Policy-driven agricultural modernization, government support, and infrastructure development further accelerate adoption.
-
COMPETITIVE LANDSCAPEThe competitive landscape of the milking automation market is marked by a blend of established legacy manufacturers and innovative robotics-focused companies. Leading players include DeLaval, GEA Group, Lely, BouMatic, Afimilk, Fullwood Packo, Nedap, and Dairymaster, all of which actively advance through product innovation, acquisitions, partnerships, and expansions into emerging regions. These companies drive differentiation by investing heavily in AI, IoT, and data analytics integration to offer comprehensive milking solutions combining robotics, herd management software, and real-time monitoring.
The shift from basic mechanical milking to more advanced milking systems, such as robotic milking parlors, sensor-based herd management, and integrated Internet of Things (IoT) platforms, has changed the way milk is produced globally, particularly in Europe and North America, where regulations, labour skill level, and government incentives have fostered a significant uptick in automated milking adoption. Meanwhile, the Asia Pacific region is experiencing the most rapid growth in milking automation with the modernization of farms and structural changes in demand for milk.
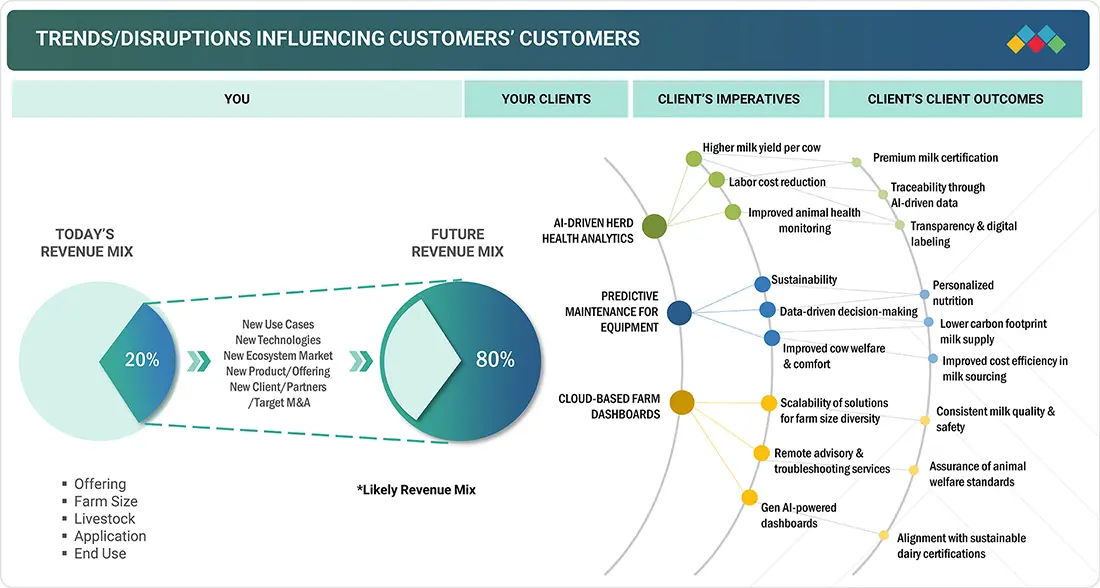
TRENDS & DISRUPTIONS IMPACTING CUSTOMERS' CUSTOMERS
Changes in customer trends or disruptions impact consumers’ businesses. These shifts impact the revenues of end users. Consequently, the revenue impact on end users is expected to affect the revenues of milking automation suppliers, which, in turn, impacts the revenues of milking automation manufacturers.
Source: Secondary Research, Interviews with Experts, MarketsandMarkets Analysis
MARKET DYNAMICS
Level
-
Better herd management with superior quality of milk

-
Labor scarcity and rising labor costs are the primary economic triggers for automation in dairy farms

Level
-
High cost associated with initial investments

-
Lack of technical knowledge among farmers

Level
-
Increasing adoption of livestock monitoring technology in developing countries

-
Expansion into emerging dairy markets with untapped potential

Level
-
Regulatory control on livestock industry to reduce outbreak of diseases

-
Compatibility problems between old farm infrastructure and modern automated systems delay adoption

Source: Secondary Research, Interviews with Experts, MarketsandMarkets Analysis
Driver: Better herd management with superior quality of milk
Automation enables real-time monitoring of udder health, somatic cell count, and milking efficiency, resulting in improved herd management. By ensuring consistent milking routines and early disease detection, automation enhances milk quality. This directly supports premium pricing opportunities and meets growing consumer demand for traceability and high-quality dairy products.
Restraint: Lack of technical knowledge among farmers
Many dairy farmers lack the digital literacy to operate and maintain advanced milking automation systems effectively. This creates dependency on external service providerts and limits he utilization of available features. Training programs, advisory services, and user-friendly interfaces are essential to bridge this skills gap and improve adoption efficiency across diverse geographies.
Opportunity: Expansion into emerging dairy markets with untapped potential
Emerging markets such as India, Brazil, and Africa present large, underpenetrated dairy sectors with rising demand for quality milk. These regions are shifting from traditional to commercialized dairy farming. Tailoring automation solutions for smaller herd sizes and scalable deployment can unlock significant growth opportunities for global and regional automation providers.
Challenge: Compatibility problems between old farm infrastructure and modern automated systems delay adoption
Many farms operate with legacy barns, milking parlors, and power systems incompatible with modern robotic solutions. Retrofitting creates high costs and operational disruptions. Solutions that offer modular integration, retrofit-friendly designs, or stepwise automation adoption strategies will be crucial to ease transition and accelerate modernization in diverse farm settings.
Milking Automation Market: COMMERCIAL USE CASES ACROSS INDUSTRIES
| COMPANY | USE CASE DESCRIPTION | BENEFITS |
|---|---|---|
 |
Robotic milking systems with integrated herd management software for large-scale dairy farms. | Labor savings up to 70%, improved milk yield consistency, real-time cow health monitoring, compliance with quality standards. |
 |
Automated rotary milking parlors with precision sensors for medium-to-large herds. | Higher throughput, reduced milking time per cow, enhanced animal comfort, and improved operational efficiency. |
 |
Wearable cow monitoring devices linked with automated milking systems and feeding robots. | Early disease detection, optimized feeding strategies, improved animal welfare, increased milk productivity. |
|
|
IoT-enabled dairy automation systems integrating milking, cooling, and cleaning processes. | Reduced energy and water consumption, consistent milk hygiene, lower operating costs, and sustainability compliance. |
Logos and trademarks shown above are the property of their respective owners. Their use here is for informational and illustrative purposes only.
MARKET ECOSYSTEM
The milking automation market ecosystem is evolving into a highly interconnected network that spans equipment manufacturers, technology providers, farm operators, and downstream dairy processors. At the core are system integrators and OEMs such as DeLaval, GEA, and Lely, who dominate robotic milking and automated parlor solutions. Surrounding them are sensor and IoT providers (Afimilk, Nedap), enabling data-driven herd monitoring, while software and analytics platforms deliver predictive insights on cow health, productivity, and sustainability compliance
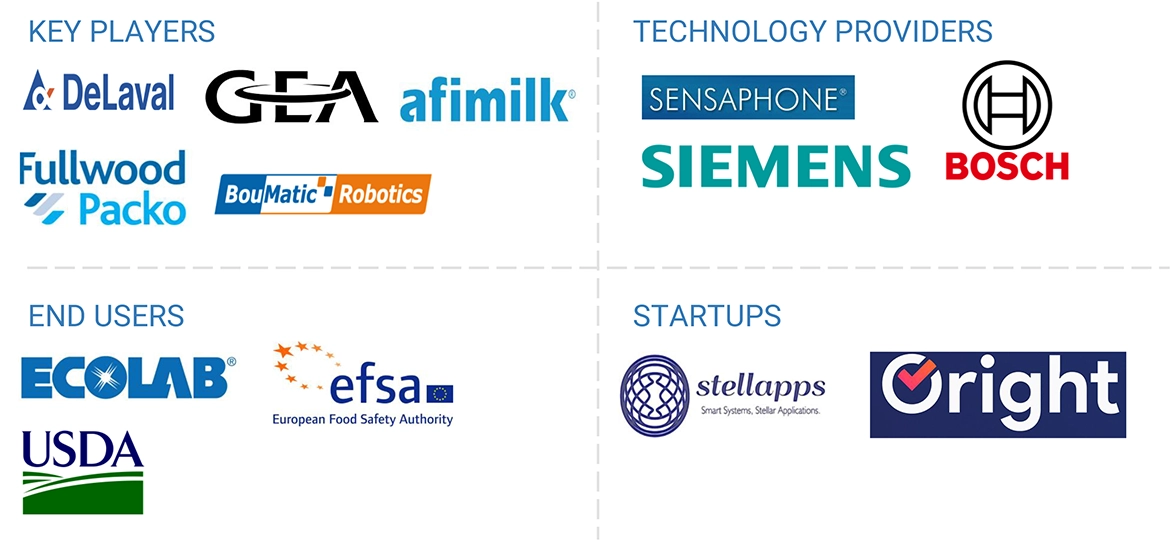
Logos and trademarks shown above are the property of their respective owners. Their use here is for informational and illustrative purposes only.
MARKET SEGMENTS
Source: Secondary Research, Interviews with Experts, MarketsandMarkets Analysis
Milking Automation Market, By Offering
The milking automation market spans hardware, software, and services. Hardware dominates, with robotic milking systems, rotary parlors, and sensor devices driving adoption. Software platforms—cloud-based herd management and predictive analytics—are rapidly gaining importance, offering actionable insights for farm efficiency and animal health. Services such as installation, maintenance, and training provide recurring revenue streams and customer stickiness. The market is evolving from equipment-centric to integrated solutions, where hardware, digital platforms, and service ecosystems converge
Milking Automation Market, By Farm Size
Adoption patterns differ strongly by farm size. Large-scale farms (Europe, the US, Oceania) are primary adopters of robotic systems, seeking labour reduction, high efficiency, and data integration. Medium-sized farms are transitioning, adopting modular and semi-automated solutions to balance cost and performance. Smallholder farms (Asia-Pacific, Latin America, Africa) face high entry barriers due to cost and infrastructure gaps, but represent untapped potential. Scalable, low-cost automation tailored for small herds is a growth opportunity
Milking Automation Market, By Livestock
The market predominantly serves dairy cattle, accounting for nearly all automation solutions. Cows require consistent milking, health monitoring, and productivity optimization, making them the focal point. Niche segments like buffaloes (India, Pakistan), goats (Europe, Middle East), and sheep (New Zealand, Mediterranean regions) are emerging opportunities. These species face increasing demand for milk and specialty dairy products but lack tailored automation solutions. As consumer demand diversifies into goat and sheep dairy products, this segment presents a frontier for innovation and regional market expansion beyond conventional cow-focused automation
Milking Automation Market, By End Use
End-use segments include commercial dairy farms, cooperatives, and research institutions. Commercial farms represent the bulk of demand, driven by rising herd sizes, labour shortages, and pressure for efficiency. Dairy cooperatives in emerging markets are beginning to promote automation to standardize milk quality across member farms, creating cluster-based demand. Research institutions and demonstration farms act as innovation hubs, piloting advanced solutions before wider commercialization
Milking Automation Market, By Application
End-use segments include commercial dairy farms, cooperatives, and research institutions. Commercial farms represent the bulk of demand, driven by rising herd sizes, labour shortages, and pressure for efficiency. Dairy cooperatives in emerging markets are beginning to promote automation to standardize milk quality across member farms, creating cluster-based demand. Research institutions and demonstration farms act as innovation hubs, piloting advanced solutions before wider commercialization
REGION
Asia Pacific to be the fastest-growing region in the global milking automation market during the forecast period
The Asia Pacific (APAC) market is arguably the fastest-growing region for milking automation because of growing dairy development, increasing demand for milk, and government incentives to modernize farms. Larger, multinational companies are now entering through partnerships and subsidies, while local entrepreneurs continue to invent affordable technologies. With the overall size, modernization drive, and need for food security, the APAC market will serve as a transformational driver of growth
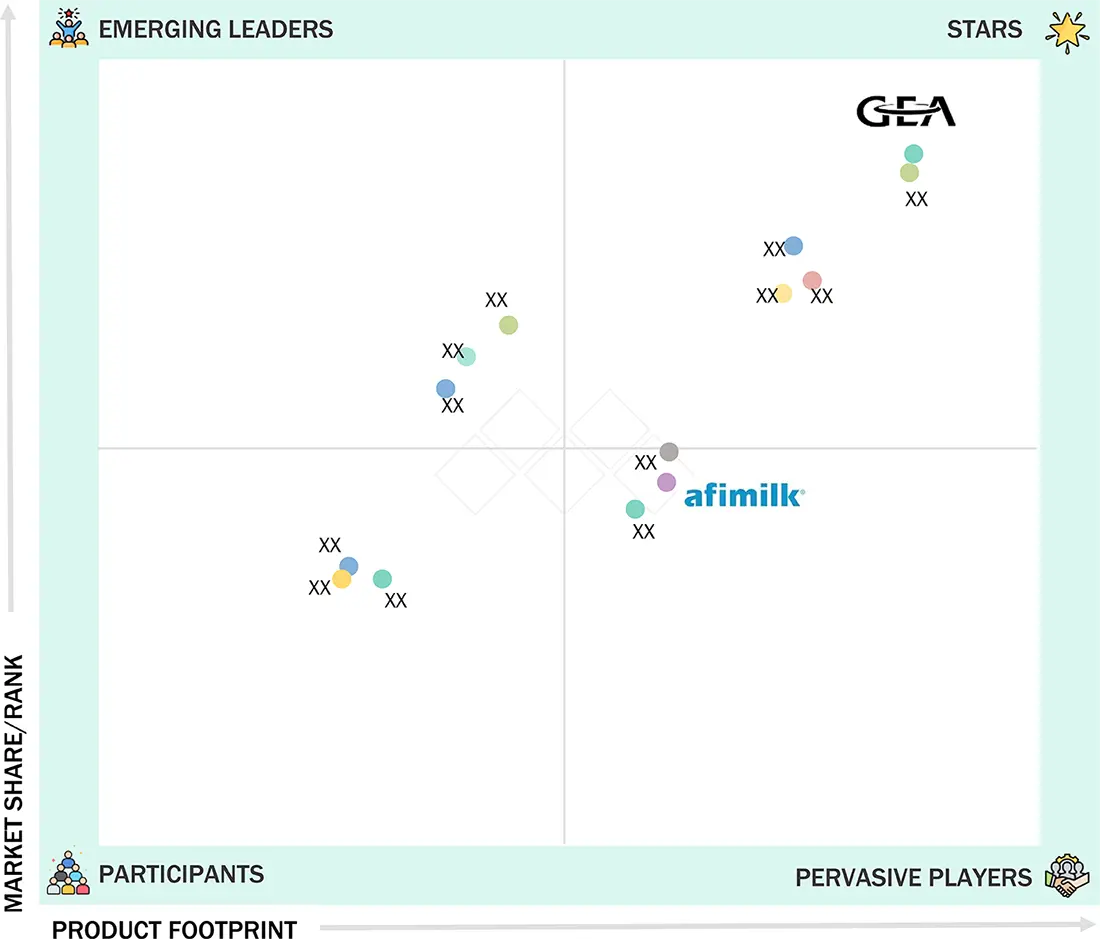
Milking Automation Market: COMPANY EVALUATION MATRIX
GEA Farm Technologies (Germany) is a leading global player in the milking automation market, positioned at the forefront of the market leader quadrant with its advanced robotic milking parlors and integrated dairy solutions. Meanwhile, Afimilk (Israel) is emerging as a rising star in the quadrant, driven by its innovative herd monitoring and data analytics platforms, enabling predictive health management and productivity optimization, particularly appealing to both developed and emerging dairy markets
Source: Secondary Research, Interviews with Experts, MarketsandMarkets Analysis
KEY MARKET PLAYERS - Top Milking Automation Companies
MARKET SCOPE
| REPORT METRIC | DETAILS |
|---|---|
| Market Size in 2024 (Value) | USD 2.44 Billion |
| Market Forecast in 2030 (value) | USD 3.68 Billion |
| Growth Rate | CAGR of 7.1% during 2025-2030 |
| Years Considered | 2020–2030 |
| Base Year | 2024 |
| Forecast Period | 2025–2030 |
| Units Considered | Value (USD Million), Volume (Units) |
| Report Coverage | Revenue forecast, company ranking, competitive landscape, growth factors, and trends |
| Segments Covered |
|
| Regions Covered | North America, Asia Pacific, Europe, South America, RoW |
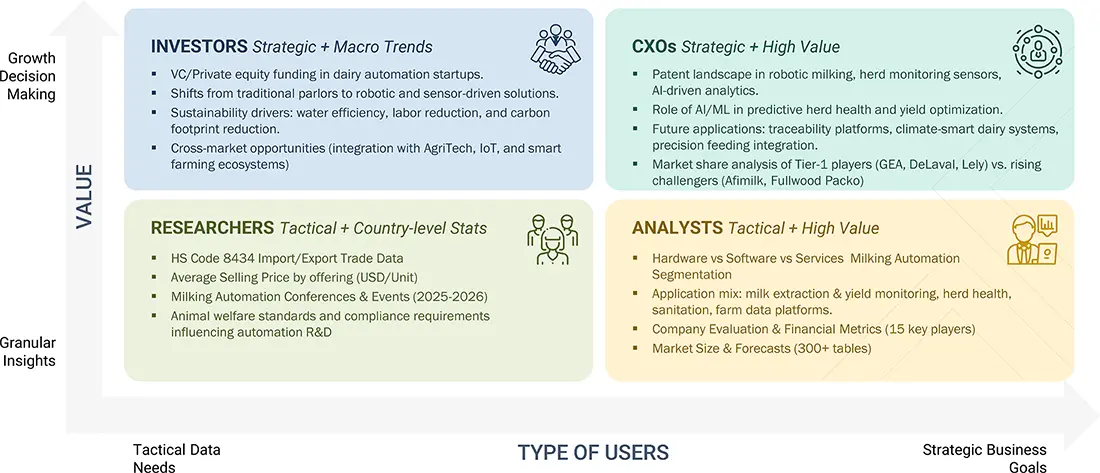
WHAT IS IN IT FOR YOU: Milking Automation Market REPORT CONTENT GUIDE
DELIVERED CUSTOMIZATIONS
We have successfully delivered the following deep-dive customizations:
| CLIENT REQUEST | CUSTOMIZATION DELIVERED | VALUE ADDS |
|---|---|---|
| APAC-based Milking Automation Manufacturers | Competitive profiling of 20+ regional and global players (financials, product mix, pricing strategies) | Identified white spaces for modular and cost-effective automation |
| European Dairy Cooperatives | Benchmarking automation penetration across EU dairy farms | Supported investment decisions for cooperative-driven automation projects |
| North American Large-scale Farms | ROI modeling of robotic milking systems vs. labor costs | Identified 20–30% efficiency gains with robotic adoption |
| Mid-sized Farms in LATAM | Affordability assessment of modular milking solutions | Unlocked adoption potential despite high upfront costs |
RECENT DEVELOPMENTS
- July 2023 : BouMatic announced a brand merger with SAC, unifying under the BouMatic name by the end of 2025. This move aimed to consolidate brand identity, streamline product offerings, enhance operational efficiency, and present a stronger global presence in the dairy equipment market.
- Nov 2023 : DeLaval and John Deere launched a strategic partnership to build the Milk Sustainability Center (MSC)—a digital platform aimed at enabling dairy farmers to track nutrient use efficiency (nitrogen, phosphorus, potassium, CO2e) and compare performance across operations. The system supports collaboration among farmers, consultants, dealers, and other stakeholders.
- Sept 2023 : Lely opened Lely Center Monroe (a Lely-owned Lely Center) and acquired the Lely business run by Argall Dairy Systems (locations in Belleville and Platteville, Wisconsin). The move meant the Lely-branded sales, service, and route operations in those territories transferred from Argall to the new Lely Center; staff from Argall who were Lely-focused were reported to transfer to the Lely Center to maintain continuity for customers. Industry reporting framed this as Lely consolidating/strengthening its Lely Center channel in the Midwest.
- Aug 2023 : Fullwood launched the new software solution, FULLSENSE, which automatically translated intricate data into practical insights. It aimed to empower farmers to streamline decision-making, seamlessly enabling improved farm performance and business outcomes.
Table of Contents
 Exclusive indicates content/data unique to MarketsandMarkets and not available with any competitors.
Methodology
The study involved two major approaches in estimating the current size of the milking automation market. Exhaustive secondary research was done to collect information on the market, peer, and parent markets. The next step was to validate these findings, assumptions, and sizing with industry experts across the value chain through primary research. Both top-down and bottom-up approaches were employed to estimate the complete market size. After that, market breakdown and data triangulation were used to estimate the market size of segments and subsegments.
Secondary Research
This research study involved the extensive use of secondary sources—directories and databases such as Bloomberg Businessweek and Factiva—to identify and collect information useful for a technical, market-oriented, and commercial study of the market.
In the secondary research process, various sources such as annual reports, press releases & investor presentations of companies, white papers, food journals, certified publications, articles from recognized authors, directories, and databases were referred to to identify and collect information.
Secondary research was mainly used to obtain key information about the industry’s supply chain, the total pool of key players, and market classification and segmentation as per the industry trends to the bottom-most level, regional markets, and key developments from both market- and technology-oriented perspectives.
Primary Research
Extensive primary research was conducted after obtaining information regarding the milking automation market scenario through secondary research. Several primary interviews were conducted with market experts from both the demand and supply sides across major countries of North America, Europe, Asia Pacific, South America, and the Rest of the World. Primary data was collected through questionnaires, emails, and telephonic interviews. The primary sources from the supply side included various industry experts, such as Chief Officers (CXOs), Vice Presidents (VPs), Directors from business development, marketing, research, and development teams, and related key executives from distributors and key opinion leaders. Primary interviews were conducted to gather insights such as market statistics, data on revenue collected from the products and services, market breakdowns, market size estimations, market forecasting, and data triangulation. Primary research also helped in understanding the various trends related to milking automation offering, end use, livestock, farm size, application, and region. Stakeholders from the demand side, such as livestock rearing flocks, dairy farms, and the poultry industry, were interviewed to understand the buyer’s perspective on the suppliers, products, their current usage of milking automation, and the outlook of their business, which will affect the overall market.

Note: The three tiers of the companies are defined based on their total revenues in 2023 or 2024, as per
the availability of financial data: Tier 1: Revenue >USD 1 billion; Tier 2: USD 100 million = Revenue = USD
1 billion; Tier 3: Revenue
To know about the assumptions considered for the study, download the pdf brochure
|
COMPANY |
DESIGNATION |
|
Nedap N.V. (Netherlands) |
General Manager |
|
Waikato Milking Systems (New Zealand) |
Sales Manager |
|
Allflex Livestock Intelligence (US) |
Manager |
|
Afimilk Ltd. (Israel) |
Head of processing department |
|
GEA Group (Germany) |
Marketing Manager |
|
DeLaval (Sweden) |
Sales Executive |
Market Size Estimation
Both the top-down and bottom-up approaches were used to estimate and validate the total size of the milking automation market. These approaches were also used extensively to determine the size of various subsegments in the market. The research methodology used to estimate the market size includes the following details:
- The key players in the industry and the overall markets were identified through extensive secondary research.
- All shares, splits, and breakdowns were determined using secondary sources and verified through primary sources.
- All possible parameters that affect the market covered in this research study were accounted for, viewed in extensive detail, verified through primary research, and analyzed to obtain final quantitative and qualitative data.
- The research included the study of reports, reviews, and newsletters of top market players, along with extensive interviews for opinions from leaders, such as CEOs, directors, and marketing executives.
Milking Automation Market : Top-Down and Bottom-Up Approach

Data Triangulation
After arriving at the overall market size from the estimation process explained above, the total market was split into several segments and subsegments. The data triangulation and market breakdown procedures were employed, wherever applicable, to estimate the overall milking automation market and arrive at the exact statistics for all segments and subsegments. The data was triangulated by studying various factors and trends from the demand and supply sides. The market size was also validated using both the top-down and bottom-up approaches.
Market Definition
Milking automation is the process in which a number of hardware electronic devices are installed in the milking parlor to reduce dependency on manual labor for milking operations. These hardware devices are deployed on dairy farms with the integration of software to reduce labor costs and enhance the quality and yield of milk. Milking automation includes hardware components such as milk meters, pulsators, and milk point controllers. It also comprises software and services to facilitate milking automation in the dairy farm by integrating with electronic hardware components.
Stakeholders
- Technical universities
- Livestock and dairy research institutes and organizations
- Milking automation hardware component manufacturers
- Dairy farm parlour automation solution providers
- Livestock farm management software providers
- Market research and consulting firms
- Intellectual property vendors
- Dairy and small ruminant farm owners
- IT service providers
- System integrators
- Consulting service providers
- Network service providers
- Software and data analytics service providers
- Associations related to automated milking equipment
- Government bodies and livestock farming industry associations
Report Objectives
- To determine and project the size of the milking automation market based on offering, end-use, livestock, farm size, application, and region in terms of value over five years, ranging from 2025 to 2030
- To identify the attractive opportunities in the market by determining the largest and fastest-growing segments across regions
- To provide detailed information about the key factors influencing market growth (drivers, restraints, opportunities, and challenges)
- To analyze the opportunities in the market for stakeholders and provide details of the competitive landscape for market leaders
- To analyze the micro-markets with respect to individual growth trends, prospects, and their contribution to the total market
- To identify and profile the key players in the milking automation market.
- To understand the competitive landscape and identify the major growth strategies adopted by players across the key regions
Available Customizations
With the given market data, MarketsandMarkets offers customizations according to company-specific scientific needs. The following customization options are available for the report:
Product Analysis
- Product Matrix, which gives a detailed comparison of the product portfolio of each company.
Geographic Analysis as per Feasibility
With the given market data, MarketsandMarkets offers customizations according to company-specific scientific needs.
- Further breakdown of the Rest of Europe milking automation market into key countries.
- Further breakdown of the Rest of Asia Pacific milking automation market into key countries.
- Further breakdown of the Rest of South America milking automation market into key countries.
Company Information
- Detailed analyses and profiling of additional market players (up to five)
Key Questions Addressed by the Report
What is the current size of the milking automation market?
The milking automation market is estimated to be USD 2.61 billion in 2025 and is projected to reach USD 3.68 billion by 2030, registering a CAGR of 7.1% during the forecast period.
Which are the key players in the market, and how intense is the competition?
Major companies operating in the milking automation market include DeLaval (Sweden), Afimilk Ltd. (Israel), GEA Group (Germany), Nedap N.V. (Netherlands), Allflex Livestock Intelligence (US), BouMatic (US), Waikato Milking Systems (New Zealand), Dairymaster (Ireland), and BECO Dairy Automation Inc. (US). They offer advanced milking automation solutions in several countries to meet customers’ needs. These players competed in the market through product launches and developments, acquisitions, collaborations, partnerships, and agreements.
Which region is projected to account for the largest share of the milking automation market?
It is expected that North America will lead the milking automation market due to the presence of large dairy farms and high labor wages in the region. In contrast, the Asia Pacific region is expected to see the highest growth rate between 2025 and 2030.
What kind of information is provided in the company profiles section?
The provided company profiles deliver crucial details, including a thorough business summary that covers different segments, financial results, geographic presence, revenue distribution, and business revenue breakdown. They also offer insights into product lines, key achievements, and expert analyst opinions to better illustrate the company’s potential.
What are the factors driving the milking automation market?
The growing demand for milk and dairy products, increasing per capita income of farmers in developing countries, rising herd size, and growing focus of governments on dairy farming and agriculture industries are expected to create a surge in the adoption of mechanized milking solutions in small-to-medium dairy farms.
Need a Tailored Report?
Customize this report to your needs
Get 10% FREE Customization
Customize This ReportPersonalize This Research
- Triangulate with your Own Data
- Get Data as per your Format and Definition
- Gain a Deeper Dive on a Specific Application, Geography, Customer or Competitor
- Any level of Personalization
Let Us Help You
- What are the Known and Unknown Adjacencies Impacting the Milking Automation Market
- What will your New Revenue Sources be?
- Who will be your Top Customer; what will make them switch?
- Defend your Market Share or Win Competitors
- Get a Scorecard for Target Partners

Custom Market Research Services
We Will Customise The Research For You, In Case The Report Listed Above Does Not Meet With Your Requirements
Get 10% Free CustomisationTESTIMONIALS

Business Innovation Director
US Based Leading Agribusiness,
Food and Ingredients ManufacturerI highly appreciate the team's efficiency for a well conducted study that helped us clarify some blind spots in food and agricultural niche markets. Although compiling information for B2B markets is very difficult, the MnM team pulled out the task successfully. The quality of research, level of insights, and responsiveness of team were commendable.


Growth opportunities and latent adjacency in Milking Automation Market