Mixed Reality Market by Components (Hardware and Software), Application (Industrial, Aerospace & Defense, Medical, Architecture, Consumer, and Others), By Device (Head-Mounted Display-Wired and Wireless) & Geography - Global Forecast to 2020


The mixed reality market was valued at USD 48.1 Million in 2016 and is expected to reach USD 453.4 Million by 2020, at a CAGR of 75.2% during the forecast period. The base year considered for this study is 2016 and the forecast period is 2016�2020.
The objectives of the study are as follows:
- Define, describe, and forecast the mixed reality market by component, application, device, and geography
- Provide market statistics with detailed classification, along with the respective market size
- Strategically analyze the micro markets with respect to individual growth trends, prospects, and contribution to the total market
- Provide detailed information regarding key factors influencing the growth of the market (drivers, restraints, opportunities, and winning imperatives)
- Forecast the size of the market segments with respect to four main geographies (along with countries), namely North America, Europe, Asia Pacific, and Rest of the World
- Analyze opportunities in the market for stakeholders and detail the competitive landscape for market players
- Strategically profile the key players operating in this market and comprehensively analyze their market ranking and core competency
- Track and analyze competitive developments such as joint ventures, mergers and acquisitions, product launches, and research and developments activities in the mixed reality market
- Map the competitive intelligence based on the company profile, strategy of key players, and game-changing developments�such as product development, collaboration, and acquisition
Research methodology includes the use of primary and secondary data. Both top-down and bottom-up approaches were used to estimate and validate the size of the market, as well as that of the other dependent submarkets, in the overall mixed reality market. Key players in the market were identified through secondary research. Secondary sources comprised annual reports, press releases, and investor presentations of companies; white papers, certified publications, and articles from recognized authors; directories; and databases. Secondary sources also consisted of AR/VR Association, EuroVR Association, Consumer Electronics Show, and Mobile World Congress.
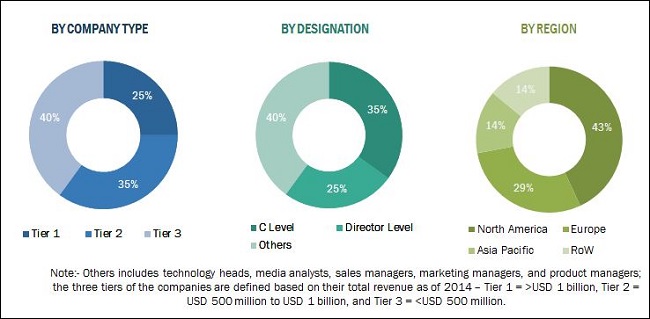
Research methodology includes the study of annual and financial reports of the top market players, and extensive interviews with industry leaders such as CEOs, VPs, directors, and marketing executives�for key insights. All the percentage shares and breakdowns have been determined using secondary sources and verified through primary sources. All possible parameters that affect the markets covered in this research study were accounted for, viewed in detail, verified through primary research, and analyzed to obtain the final quantitative and qualitative data. The breakdown of the profiles of the primaries has been depicted in the figure below:
To know about the assumptions considered for the study, download the pdf brochure
The value chain of the mixed reality market includes original manufacturers for head-mounted displays, wearable device manufacturers, and distributors. Major companies that are part of the value chain include Atheer, Inc. (US), Canon, Inc. (Japan), DAQRI LLC (US), Eon Reality, Inc. (US), Layar B.V. (Netherlands), Magic Leap, Inc. (US), Meta Company (US), Microsoft Corporation (US), Seiko Epson Corporation (Japan), and Sulon Technologies (Canada).
Target Audience
- Original equipment manufacturers (OEMs)
- Product manufacturers
- Original design manufacturers (ODMs) and OEM technology solutions providers
- Research organizations
- Technology standard organizations, forums, alliances, and associations
- Technology investors
- Governments, financial institutions, and investment communities
- Analysts and strategic business planners
- End users
�The study answers several questions for the target audience primarily which market segments to focus on over the next 2�5 years to prioritize their efforts and investments.�
Report Scope
In this report, the mixed reality market has been segmented as follows:
Mixed reality market, by Component
- Hardware
- Software
Mixed reality market, by Device
- Head-Mounted Display Devices (Wired)
- Head-Mounted Display Devices (Wireless)
Mixed reality market, by Application
- Industrial
- Aerospace & Defense
- Medical
- Architecture
- Consumer
- Others
Mixed reality Market, by Geography
- North America
- Europe
- Asia Pacific (APAC)
- Rest of the World (RoW)
Company Profiles: Detailed analysis of the major companies present in the mixed reality market
Available Customizations
With the given market data, MarketsandMarkets offers customizations according to a company�s specific needs. The following customization options are available for the report:
Company Information
Detailed analysis and profiling of additional market players (up to 5)
The mixed reality market was valued at USD 48.1 Million in 2016 and is expected to reach USD 453.4 Million by 2020, at a CAGR of 75.2% during the forecast period. The penetration of head-mounted display devices in the gaming, sports, and entertainment space; evolution of hardware and software components for reality technologies; and increase in internet connectivity are the major factors driving the mixed reality market.
This report covers the mixed reality market based on component, device, application, and geography. Industrial application is expected to hold the largest share of the overall market during the forecast period. Major factors contributing to the growth of this market include the increased adoption of head-mounted displays for industrial applications, growing use of advanced reality technologies for employee training, and extensive research and development activities to launch new mixed reality products.
The mixed reality market for software is expected to witness high growth owing to the strong R&D in this area. The major factor contributing to the growth of this segment is the gradual commercialization of mixed reality products that would enable the development of software development kits (SDKs) to help in the smooth functioning of the entire system/product. It is also expected to promote application developers to design new apps to further enhance user experience.
The head-mounted display (HMD) wireless segment is expected to record the highest growth rate in the mixed reality market during the forecast period. The major factor attributed to the growth of this market is the increasing demand for wireless HMD devices which provide enhanced convenience to users while visualizing images (HMD wired devices could lead to user discomfort).
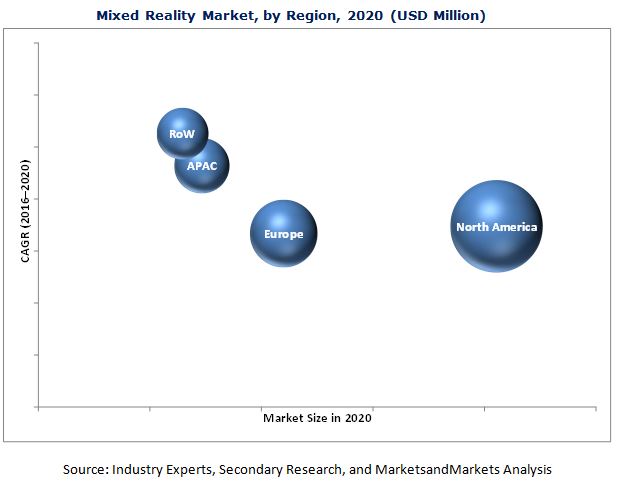
North America is expected to lead the mixed reality market in terms of size due the significantly high adoption of mixed reality products in this region. Technological advancements and product launches by players in this region are likely to contribute to the growth of this market. The presence of major mixed reality companies, such as Microsoft Corporation (US), Atheer, Inc. (US), DAQRI LLC (US), Eon Reality, Inc. (US), Magic Leap, Inc. (US), and Meta Company (US), in this region is also expected to drive market growth.
The limited battery life and image latency affect the performance of mixed reality devices. These are key factors restraining the growth of the mixed reality market. This report discusses the drivers, restraints, opportunities, challenges, burning issues, and winning imperatives pertaining to the mixed reality market. It also analyzes the current market scenario and forecasts the market size till 2020.
A few major companies operating in the mixed reality market are Atheer, Inc. (US), Canon, Inc. (Japan), DAQRI LLC (US), Eon Reality, Inc. (US), Layar B.V. (Netherlands), Magic Leap, Inc. (US), Meta Company (US), Microsoft Corporation (US), Seiko Epson Corporation (Japan), and Sulon Technologies (Canada).
To speak to our analyst for a discussion on the above findings, click Speak to Analyst
 Exclusive indicates content/data unique to MarketsandMarkets and not available with any competitors.
Table of Contents
1 Introduction (Page No. - 14)
1.1 Study Objectives
1.2 Market Definition
1.3 Study Scope
1.3.1 Markets Covered
1.3.2 Years Considered for the Study
1.4 Currency & Pricing
1.5 Limitations
1.6 Stakeholders
2 Research Methodology (Page No. - 17)
2.1 Research Data
2.1.1 Secondary Data
2.1.1.1 Key Data From Secondary Sources
2.1.2 Primary Data
2.1.2.1 Key Data From Primary Sources
2.1.2.2 Key Industry Insights
2.1.2.3 Breakdown of Primaries� Interviews: By Company Type, Designation, and Region
2.2 Demand-Side Analysis
2.2.1 Introduction
2.2.2 Demand-Side Analysis
2.2.2.1 Growing Demand for Head-Mounted Displays
2.3 Market Size Estimation
2.3.1 Bottom-Up Approach
2.3.2 Top-Down Approach
2.4 Market Breakdown and Data Triangulation
2.5 Research Assumptions
3 Executive Summary (Page No. - 26)
4 Premium Insights (Page No. - 31)
4.1 Attractive Opportunities for the Market
4.2 Mixed Reality Market, By Application
4.3 Market in the Asia-Pacific Region
4.4 Mixed Reality Industrial Application Market, By Geography
4.5 Life Cycle Analysis, By Geography
5 Market Overview (Page No. - 35)
5.1 Market Segmentation
5.1.1 By Component
5.1.2 By Device
5.1.3 By Application
5.1.4 By Geography
5.2 Market Evolution
5.3 Market Dynamics
5.3.1 Drivers
5.3.1.1 Penetration of Head Mounted Display (HMD) Devices in Gaming, Sports, and Entertainment Industries
5.3.1.2 Evolution of Hardware and Software Components for Reality Technologies
5.3.1.3 Rising Internet Connectivity
5.3.2 Restraints
5.3.2.1 Image Latency Affects the Performance of Mixed Reality Devices
5.3.2.2 Limited Battery Life
5.3.3 Opportunities
5.3.3.1 Mixed Reality Research Projects in the European Region
5.3.3.2 Mixed Reality for Medical Education
5.3.4 Challenges
5.3.4.1 Tracking and Registration Difficulties
5.3.4.2 Graphical Content Creation
5.3.5 Burning Issue
5.3.5.1 Social Acceptance
5.3.6 Winning Imperative
5.3.6.1 Investment From Major Players Such as Microsoft, Atheer Labs, Meta Company, and Others
6 Industry Trends (Page No. - 48)
6.1 Introduction
6.2 Value Chain Analysis
6.3 Strategic Benchmarking
6.3.1 Technology Integration and Product Enhancement
7 Market, By Component (Page No. - 50)
7.1 Introduction
7.2 Hardware
7.2.1 Semiconductor Components
7.2.2 Sensors
7.2.2.1 Magnetometer
7.2.2.2 Accelerometer
7.2.2.3 Gyroscope
7.2.2.4 Proximity Sensors
7.2.2.5 Others
7.2.3 Power Units
7.3 Software
8 Market, By Device (Page No. - 55)
8.1 Introduction
8.2 Head-Mounted Display (Wired)
8.3 Head Mounted Display (Wireless)
9 Market, By Application (Page No. - 60)
9.1 Introduction
9.2 Industrial Application
9.3 Aerospace & Defense
9.4 Medical
9.4.1 Surgery
9.4.2 Simulation Training
9.4.3 Visualization of Ct Scans
9.5 Architecture
9.6 Consumer
9.6.1 Entertainment
9.6.2 Gaming
9.7 Others
9.7.1 Education
9.7.2 Sports
10 Market, By Geography (Page No. - 74)
10.1 Introduction
10.2 North America
10.2.1 U.S.
10.2.2 Rest of North America
10.3 Europe
10.3.1 Germany
10.3.2 U.K.
10.3.3 France
10.3.4 Rest of Europe
10.4 Asia-Pacific
10.4.1 China
10.4.2 Japan
10.4.3 South Korea
10.4.4 Rest of APAC
10.5 Rest of the World (RoW)
10.5.1 Middle East and Africa
10.5.2 South America
11 Competitive Landscape (Page No. - 110)
11.1 Overview
11.2 Top Players in the Market
11.3 Competitive Scenario
11.4 Recent Developments
11.4.1 New Product Launches
11.4.2 Contracts, Agreements, and Partnerships
11.4.3 Acquisitions
12 Company Profiles (Page No. - 117)
12.1 Introduction
12.2 Atheer, Inc.
12.2.1 Business Overview
12.2.2 Product Portfolio
12.2.3 Recent Developments
12.3 Canon, Inc.
12.3.1 Business Overview
12.3.2 Product Portfolio
12.3.3 Recent Developments
12.3.4 MnM View
12.3.5 Canon, Inc.: SWOT Analysis
12.4 Daqri, Llc
12.4.1 Business Overview
12.4.2 Product Portfolio
12.4.3 Recent Developments
12.5 EON Reality, Inc.
12.5.1 Business Overview
12.5.2 Product Portfolio
12.5.3 Recent Developments
12.5.4 MnM View
12.5.5 EON Reality, Inc.: SWOT Analysis
12.6 Layar B.V.
12.6.1 Business Overview
12.6.2 Product Portfolio
12.6.3 Recent Developments
12.7 Magic Leap, Inc.
12.7.1 Business Overview
12.7.2 Product Portfolio
12.7.3 Recent Developments
12.8 Meta Company
12.8.1 Business Overview
12.8.2 Product Portfolio
12.8.3 Recent Developments
12.9 Microsoft Corporation
12.9.1 Business Overview
12.9.2 Product Portfolio
12.9.3 Recent Developments
12.9.4 MnM View
12.9.5 Microsoft Corporation: SWOT Analysis
12.10 Seiko Epson Corporation
12.10.1 Business Overview
12.10.2 Product Portfolio
12.10.3 Recent Developments
12.10.4 MnM View
12.10.5 Seiko Epson Corporation: SWOT Analysis
12.11 Sulon Technologies
12.11.1 Business Overview
12.11.2 Product Portfolio
12.11.3 Recent Developments
13 Appendix (Page No. - 136)
13.1 Insights of Industry Experts
13.2 Discussion Guide
13.3 Introducing RT: Real Time Market Intelligence
13.4 Available Customizations
13.5 Related Reports
List of Tables (69 Tables)
Table 1 Adoption of Head Mounted Display Devices in Gaming, Sports, and Entertainment Industries is Expected to Propel the Growth of the Mixed Reality Market
Table 2 Image Latency May Act as A Restraint to the Growth of the Market
Table 3 Mixed Reality Research Projects Such as 3d Live Projects Offer A Huge Growth Opportunity for the Market
Table 4 Global Market, By Component, 2016-2020 ( USD Million)
Table 5 Global Market, By Device, 2016-2020 ( USD Million)
Table 6 Head-Mounted Display (Wired) Market Size, By Application, 2016-2020 (USD Million)
Table 7 Head-Mounted Display (Wireless) Market Size, By Application, 2016-2020 (USD Million)
Table 8 Market, By Application, 2016�2020 (USD Million)
Table 9 Market: Industrial Application, By Geography, 2016�2020 (USD Million)
Table 10 Market: Industrial Application, By Device, 2016�2020 (USD Million)
Table 11 Market: Aerospace & Defense Application, By Geography, 2016�2020 (USD Million)
Table 12 Mixed Realitymarket: Aerospace & Defense Application, By Device, 2016 � 2020 (USD Million)
Table 13 Market: Medical Application, By Geography, 2016�2020 (USD Million)
Table 14 Market: Medical Application, By Device, 2016�2020 (USD Million)
Table 15 Market: Architecture Application, By Geography, 2016�2020 (USD Million)
Table 16 Market: Architecture Application, By Device, 2016�2020 (USD Million)
Table 17 Market: Consumer Application, By Geography, 2018�2020 (USD Million)
Table 18 Market: Consumer Application, By Device, 2018 � 2020 (USD Million)
Table 19 Market: Other Applications, By Geography, 2016�2020 (USD Million)
Table 20 Market; Other Applications, By Device, 2016�2020 (USD Million)
Table 21 Market, By Geography, 2016�2020 (USD Million)
Table 22 North American Mixed Reality Market, By Country, 2016�2020 (USD Million)
Table 23 North American Market, By Application, 2016�2020 (USD Million)
Table 24 U.S. Market, By Application, 2016�2020 (USD Million)
Table 25 Rest of North American Mixed Reality Market, By Application, 2016�2020
Table 26 North American Mixed Reality Market: Industrial Application, By Country, 2016�2020 (USD Million)
Table 27 North American Market: Aerospace & Defence Application, By Country, 2016�2020 (USD Million)
Table 28 North American Market: Medical Application, By Country, 2016�2020 (USD Million)
Table 29 North American Market: Architectural Application, By Country, 2016�2020 (USD Million)
Table 30 North American Market: Consumer Application, By Country, 2016�2020 (USD Million)
Table 31 North American Market: Other Applications, By Country, 2016�2020 (USD Million)
Table 32 European Mixed Reality Market, By Country, 2016�2020 (USD Million)
Table 33 European Market, By Application, 2016�2020 (USD Million)
Table 34 European Market: Industrial Application, By Country, 2016�2020 (USD Million)
Table 35 European Market: Aerospace & Defence Application, By Country, 2016�2020 (USD Million)
Table 36 European Market: Medical Application, By Country, 2016�2020 (USD Million)
Table 37 European Market: Architecture Application, By Country, 2016�2020 (USD Million)
Table 38 European Market: Consumer Application, By Country, 2016�2020 (USD Million)
Table 39 European Market: Other Applications, By Country, 2016�2020 (USD Million)
Table 40 German Mixed Reality Market, By Application, 2016�2020 (USD Million)
Table 41 U.K. Mixed Reality Market, By Application, 2016�2020 (USD Million)
Table 42 French Mixed Reality Market, By Application, 2016�2020 (USD Million)
Table 43 Rest of Europe Mixed Reality Market, By Application, 2016�2020 (USD Million)
Table 44 APAC Mixed Reality Market, By Country, 2016�2020 (USD Million)
Table 45 APAC Market, By Application, 2016�2020 (USD Million)
Table 46 APAC Market: Industrial Application, By Country, 2016�2020 (USD Million)
Table 47 APAC Market: Aerospace & Defence Application, By Country, 2016�2020 (USD Million)
Table 48 APAC Market: Medical Application, By Country, 2016�2020 (USD Million)
Table 49 APAC Market: Architecture Application, By Country, 2016�2020 (USD Thousand)
Table 50 APAC Market: Consumer Application, By Country, 2016�2020 (USD Million)
Table 51 APAC Market: Other Applications, By Country, 2016�2020 (USD Million)
Table 52 Chinese Market, By Application, 2016�2020 (USD Million)
Table 53 Japanese Market, By Application, 2016�2020 (USD Million)
Table 54 South Korean Market, By Application, 2016�2020 (USD Million)
Table 55 Rest of APAC Market, By Application, 2016�2020 (USD Thousand)
Table 56 RoW Market, By Country, 2016 � 2020 (USD Million)
Table 57 RoW Market, By Application, 2016�2020 (USD Million)
Table 58 RoW Market: Industrial Application, By Country, 2016�2020 (USD Million)
Table 59 RoW Market: Aerospace & Defence Application, By Country, 2016�2020 (USD Million)
Table 60 RoW Market: Medical Application, By Country, 2016�2020 (USD Million)
Table 61 RoW Market: Architecture Application, By Country, 2016�2020 (USD Million)
Table 62 RoW Market: Consumer Application, By Country, 2016�2020 (USD Million)
Table 63 RoW Market: Other Application, By Country, 2016�2020 (USD Million)
Table 64 Middle Eastern and African Market, By Application, 2016�2020 (USD Million)
Table 65 South American Market, By Application, 2016�2020 (USD Million)
Table 66 Top Players in the Market
Table 67 New Product Launches, 2014-2015
Table 68 Contracts, Agreements, and Partnerships, 2014-2015
Table 69 Acquisitions, 2014-2015
List of Figures (61 Figures)
Figure 1 Research Design & Factor Analysis
Figure 2 Head-Mounted Devices Market Size, 2012-2014
Figure 3 Market Size Estimation Methodology: Bottom-Up Approach
Figure 4 Market Size Estimation Methodology: Top-Down Approach
Figure 5 Assumptions for the Research Study
Figure 6 Industrial Application is Expected to Witness the Highest Growth in the Market From 2016 to 2020
Figure 7 The Software Components Segment is Expected to Witness the Highest CAGR in the Market During the Forecast Period
Figure 8 The HMD Wirelss Devices Segment is Estimated to Witness the Highest Growth Rate in the Market During the Forecast Period
Figure 9 Global Mixed Reality Market, By Geography, 2016
Figure 10 Global Market, By Country, 2016
Figure 11 Increasing Adoption of Mixed Reality Products in Various Applications is Expected to Drive the Studied Market During the Forecast Period
Figure 12 The Industrial Segment is Expected to Be the Largest Market for Mixed Reality Technology During the Forecast Period
Figure 13 The Industrial Application is Estimated to Dominate the Emerging Asia-Pacific Market for Mixed Reality Technology, 2016
Figure 14 North America is Expected to Grow at A Higher Market Size Compared to the Other Regions From 2016 to 2020
Figure 15 The Mixed Reality Market is Projected to Be in the Growth Phase in the North American Region By 2016
Figure 16 Mixed Reality Market Segmentation
Figure 17 Market, By Component
Figure 18 Mixed Reality Market, By Device
Figure 19 Market, By Application
Figure 20 Mixed Reality Market, By Geography
Figure 21 Evolution of the Mixed Reality Market
Figure 22 Market Dynamics: Overview
Figure 23 World Internet Penetration Rates, By Geography, 2014 Q4
Figure 24 Value Chain Analysis: Major Value is Added During the Manufacturing and Assembly Phases
Figure 25 Strategic Benchmarking: Key Players Largely Adopted Organic Growth Strategies for New Product and Technology Development
Figure 26 Mixed Reality Market, By Component
Figure 27 The Software Segment is Expected to Grow at A Higher CAGR During the Forecast Period
Figure 28 Mixed Reality Market, By Device
Figure 29 Industrial Application is Expected to Witness the Highest Growth in the HMD Wired Device Market During the Forecast Period
Figure 30 Aerospace & Defence Application is Estimated to Witness the Highest Growth in the HMD Wireless Device Market Between 2016 and 2020
Figure 31 Mixed Reality Market, By Application
Figure 32 Industrial Application is Expected to Witness the Highest Growth in the Mixed Reality Market During the Forecast Period
Figure 33 North America is Projected to Witness the Highest Growth in Market for Industrial Application of Mixed Reality During the Forecast Period
Figure 34 The HMD Wireless Devices Segment is Estimated to Grow at A Higher CAGR Between 2016 and 2020
Figure 35 APAC is Expected to Grow at the Highest CAGR in the Market for Mixed Reality in Industrial Application From 2016 to 2020
Figure 36 The HMD Wireless Devices Segment is Expected to Grow at A Higher CAGR in the Market for Mixed Reality in Aerospace & Defense Application Between 2016 and 2020
Figure 37 RoW is Expected to Grow at the Highest CAGR Rate in the Market for Mixed Reality in Architecture Application During the Forecast Period
Figure 38 North America is Estimated to Witness the Highest Growth Between 2016 and 2020
Figure 39 RoW is Expected to Grow at the Highest CAGR During the Forecast Period
Figure 40 Mixed Reality Market, By Region
Figure 41 Market, Geographic Analysis
Figure 42 U.S. is Expected to Dominate the Global Mixed Reality Market Between 2016 and 2020
Figure 43 North American Market Snapshot: the Market Would Be Driven By the Growing Demand By Industrial Application During the Forecast Period
Figure 44 North American Mixed Reality Market
Figure 45 Industrial Application is Expected to Account for the Largest Share of the North American Mixed Reality Market
Figure 46 European Market Snapshot: the Demand Would Be Driven By Various Potential Growth Opportunities Pertaining to the Industrial Application
Figure 47 European Mixed Reality Market
Figure 48 Germany is Projected to Lead the European Mixed Reality Marekt Due to the Increasing Adoption of Reality Technologies in Industrial and Aerospace & Defence Sectors
Figure 49 The Industrial Application Held the Largest Share in the European Mixed Reality Market
Figure 50 APAC Market Snapshot: the Demand Would Be Driven By the Growing Usage of Reality Technoligies in Industrial Applications
Figure 51 APAC Mixed Reality Market
Figure 52 China is Projected to Lead the APAC Mixed Reality Market From 2016 to 2020
Figure 53 Industrial Application is Projected to Witness the Highest Growth in the Mixed Reality Market By 2016
Figure 54 RoW Mixed Reality Market
Figure 55 South America is Expected to Be the Largest Market for Mixed Reality in the RoW Region By 2016
Figure 56 Key Growth Strategies Adopted By the Top Companies Between 2012 and 2015
Figure 57 Market Evaluation Framework-New Product Launches Fuelled Growth and Innovation in 2014 and 2015
Figure 58 Battle for Market Share: New Product Launches Was the Key Strategy
Figure 59 Canon, Inc.: Company Snapshot
Figure 60 Microsoft Coproration: Company Snapshot
Figure 61 Seiko Epson Corporation: Company Snapshot


Growth opportunities and latent adjacency in Mixed Reality Market