The research study involved four major activities in estimating the size of the Head-mounted Display (HMD) market. Exhaustive secondary research has been done to collect important information about the market and peer markets. The validation of these findings, assumptions, and sizing with the help of primary research with industry experts across the value chain has been the next step. Both top-down and bottom-up approaches have been used to estimate the market size. Post which the market breakdown and data triangulation have been adopted to estimate the market size of segments and sub-segments.
Secondary Research
In secondary research, various secondary sources have been referred to for obtaining the information that was needed for the study. Various secondary sources that were used for the research include, corporate filings such as annual reports, press releases, investor presentations, and financial statements; trade, business, and professional associations; whitepapers, journals, certified publications, and articles from recognized authors and databases.
In the head-mounted display report, the top-down as well as bottom-up approaches have been used for the estimation of the global market size, along with several other dependent submarkets. The major players in the market were identified with the help of extensive secondary research and their presence in the market was determined using secondary and primary research. All the percentage shares, splits, and breakdowns have been determined using secondary sources and verified through primary sources.
Primary Research
Extensive primary research has been conducted after understanding the HMD market scenario through secondary research. Several primary interviews have been conducted with key opinion leaders from both demand- and supply-side vendors across four major regions— Americas, Europe, Asia Pacific, and the Rest of the World. Approximately 25% of the primary interviews have been conducted with the demand-side vendors and 75% with the supply-side vendors. Primary data has been collected mainly through telephonic interviews, which consist of 80% of the total primary interviews; questionnaires and emails have also been used to collect the data.
After successful interaction with industry experts, brief sessions were conducted with highly experienced independent consultants to reinforce the findings of our primary research. This, along with the in-house subject matter experts’ opinions, has led us to the findings as described in the report.
 Market Size, and Share")
To know about the assumptions considered for the study, download the pdf brochure
Market Size Estimation
In the market engineering process, both top-down and bottom-up approaches along with data triangulation methods have been used to estimate and validate the size of the head-mounted mounted (HMD) market and other dependent submarkets. The research methodology used to estimate the market sizes includes the following:
-
Initially, the focus was on top line investments and spending in the ecosystem. Further the segment level splits and major developments in the market have been considered.
-
Identifying different stakeholders in the HMD market that influence the entire market, along with participants across the supply chain
-
Analyzing major manufacturers of HMD devices as well as studying their product portfolios
-
Analyzing trends related to the adoption of HMDs based on application type
-
Tracking the recent and upcoming developments in the market that include investments, R&D activities, product launches, collaborations, mergers & acquisitions, and partnerships, as well as forecasting the market size based on these developments and other critical parameters
-
Carrying out multiple discussions with key opinion leaders to identify the adoption trends of HMD
-
Segmenting the overall market into various other market segments
-
Validating the estimates at every level through discussions with key opinion leaders, such as chief executives (CXOs), directors, and operation managers, and finally with the domain experts at MarketsandMarkets
Market Size Estimation Methodology-Bottom-up Approach
 Market Size, and Bottom-up approach")
Market Size Estimation Methodology-Top-down Approach
 Market Size, and Top-down Approach")
Data Triangulation
After arriving at the overall market size through the HMDs market size estimation process explained in the earlier section, the overall HMD market size has been divided into several segments and subsegments. To complete the overall market engineering process and arrive at the exact statistics for all segments, the data triangulation and market breakdown procedures have been used, wherever applicable. The data has been triangulated by studying various factors and trends from both the demand and supply side perspectives. Along with data triangulation and market breakdown, the market has been validated by top-down and bottom-up approaches.
Market Definition
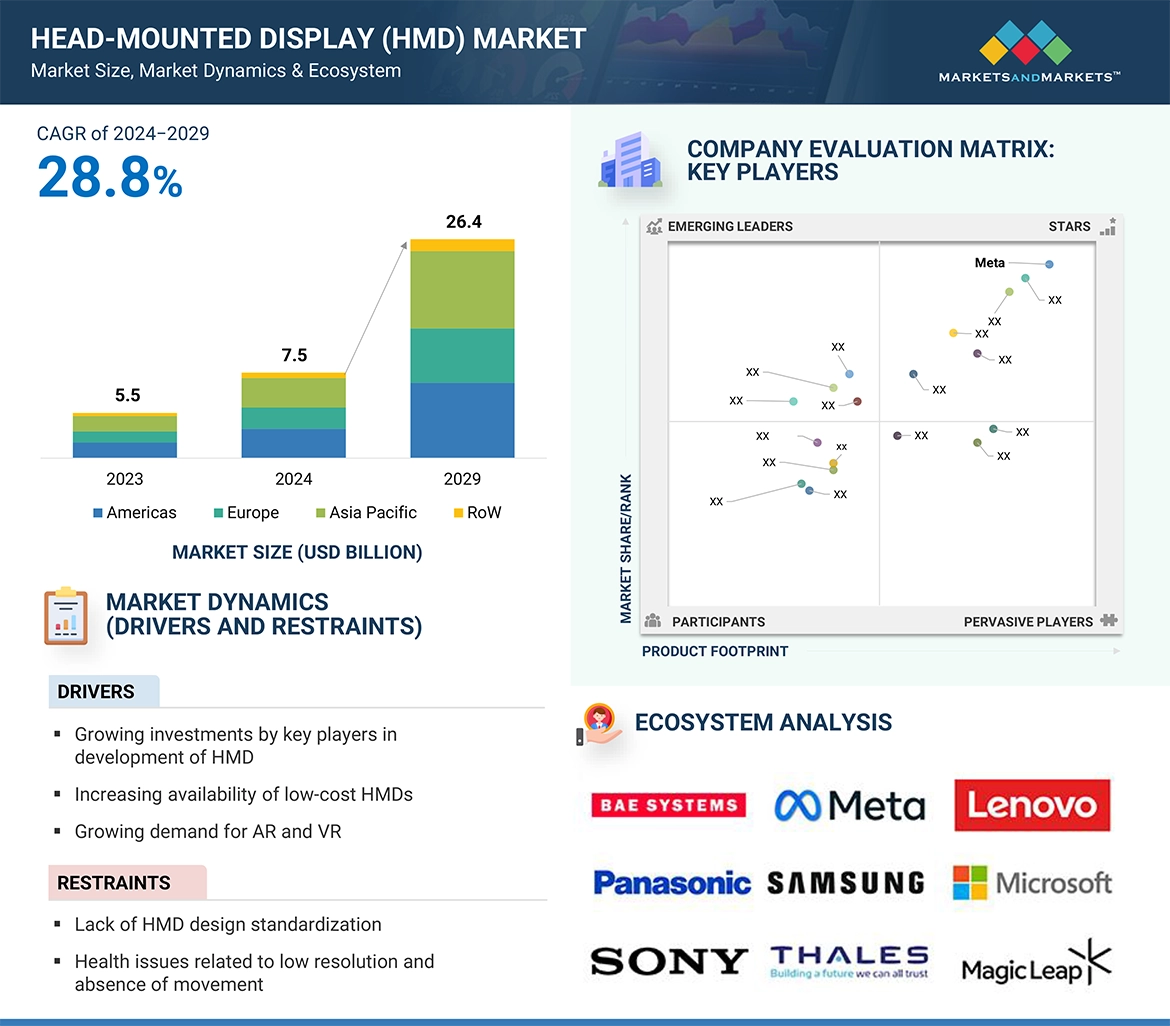
A Head-Mounted Display (HMD) refers to a wearable device designed to present visual information directly to the user's eyes. This display system is typically worn on the head and may cover the eyes partially or completely, creating an immersive experience for the user. HMDs can be used for various applications, including virtual reality (VR), augmented reality (AR), and mixed reality (MR). The device incorporates components such as displays, optics, sensors, and audio systems to provide users with a simulated environment or overlay digital information onto the real world. HMDs find applications in entertainment, gaming, healthcare, education, training, and various industrial sectors, offering users a more immersive and interactive way to engage with digital content and experiences.
Key Stakeholders
-
Suppliers of raw materials and manufacturing equipment
-
Semiconductor foundries
-
Original equipment manufacturers (OEMs)
-
Manufacturers of AR and VR devices
-
Original design manufacturers (ODMs) and OEM technology solution providers
-
Research organizations
-
Technology standard organizations, forums, alliances, and associations
-
Technology investors
-
Governments, financial institutions, and investment communities
-
Analysts and strategic business planners
The main objectives of this study are as follows:
-
To define, analyze, and forecast the HMD market size, by type, technology, component, product type, connectivity, and application in terms of value
-
To define, analyze, and forecast the HMD market size, by technology, in terms of volume
-
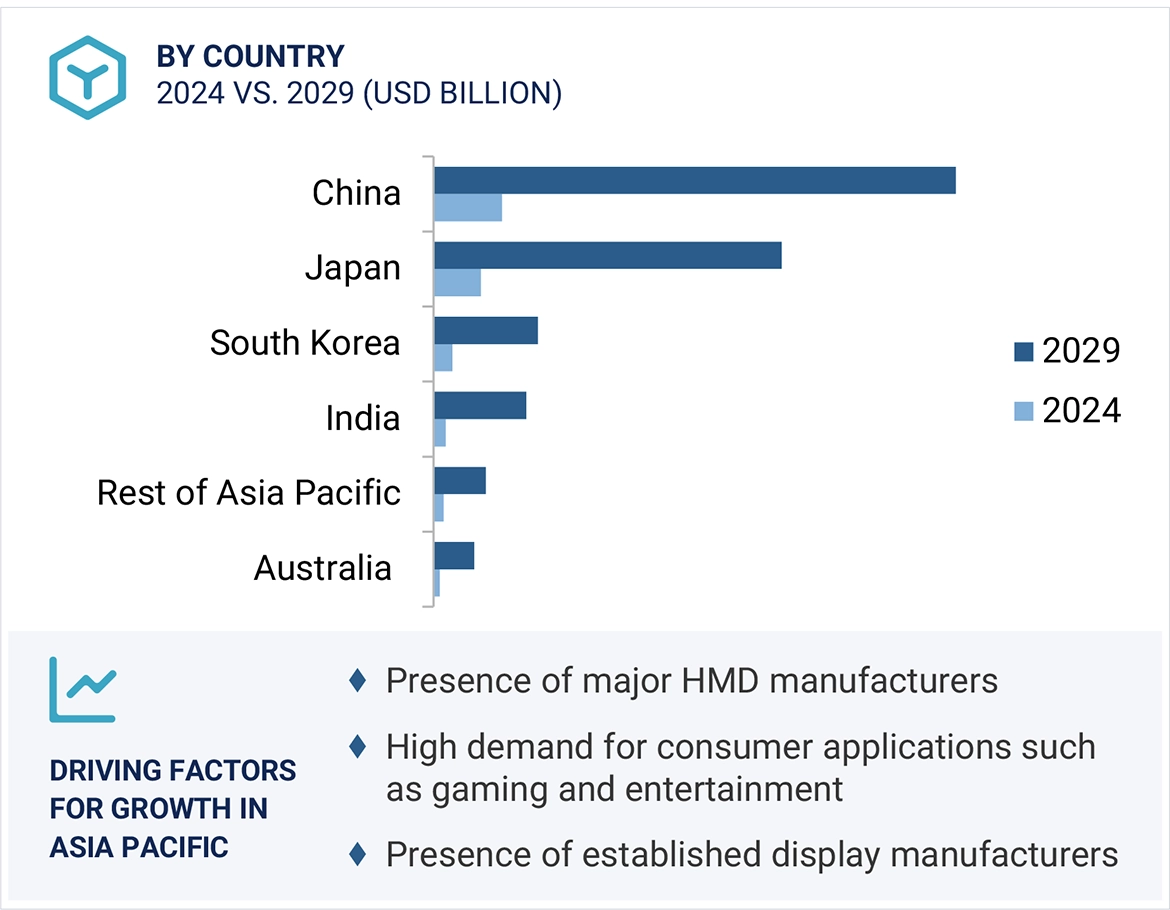
To forecast the market size for various segments with respect to four main regions, namely, Americas, Europe, Asia Pacific, and Rest of the World
-
To provide detailed information regarding the major drivers, restraints, opportunities, and challenges influencing the growth of the HMD market
-
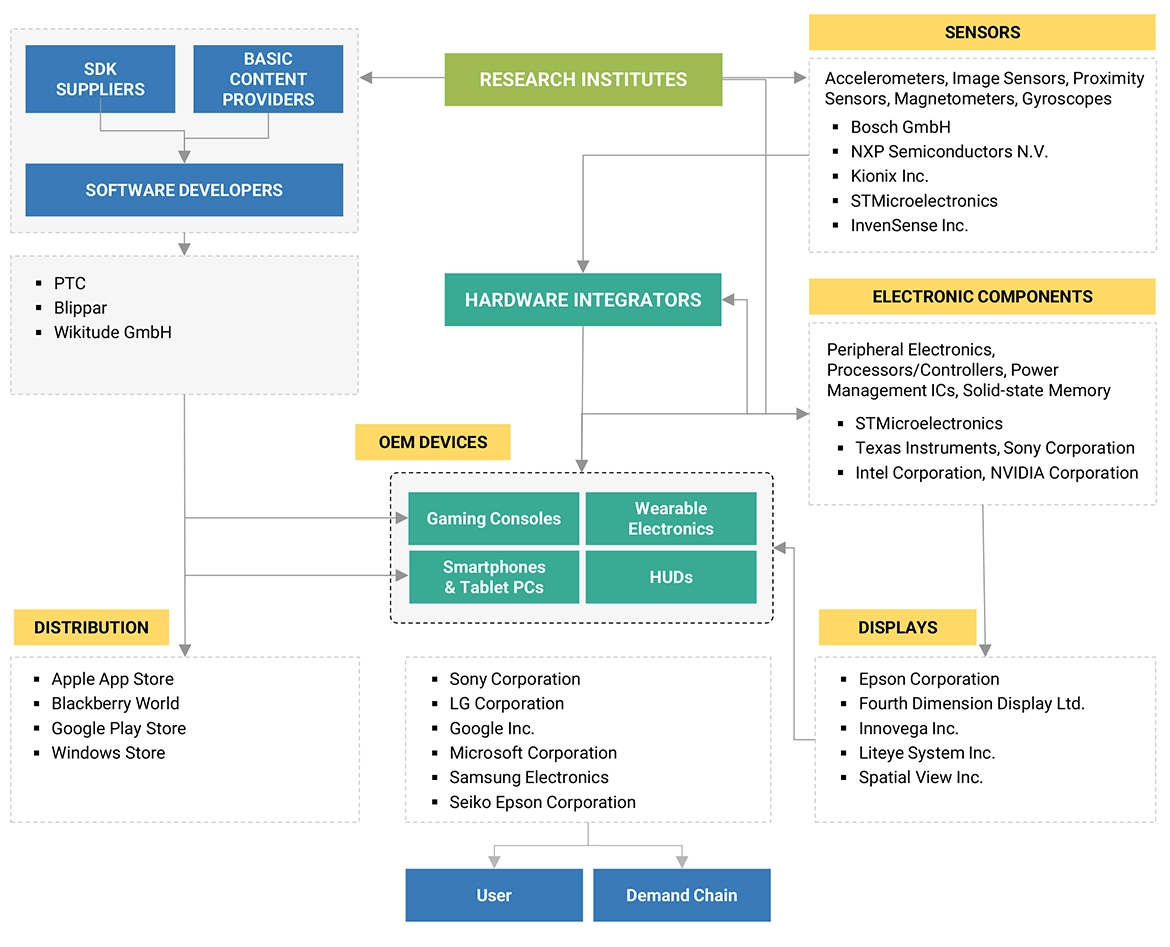
To study the complete value chain and related industry segments for the HMD market size
-
To strategically analyze the micromarkets1 with respect to individual growth trends, prospects, and contributions to the total market
-
To analyze trends and disruptions; pricing trends; patents and innovations; trade data (export and import data); regulatory environment; Porter’s five forces analysis; case studies; key stakeholders & buying criteria; technology trends; the market ecosystem; and key conferences and events related to the HMD market.
-
To analyze opportunities in the market for various stakeholders by identifying the high-growth segments of the market
-
To strategically profile the key players and comprehensively analyze their market position in terms of ranking and core competencies2, along with detailing the competitive landscape for the market leaders
-
To analyze competitive developments such as product launches/developments, expansions, acquisitions, partnerships, collaborations, agreements, and research and development (R&D) activities carried out by players in the HMD market
Available Customizations:
With the given market data, MarketsandMarkets offers customizations according to the specific requirements of companies. The following customization options are available for the report:
Country-wise Information:
-
Country-wise breakdown for Americas, Europe, Asia Pacific, and Rest of the World
Company Information:
-
Detailed analysis and profiling of additional market players (up to five)


Adi
Mar, 2019
We are trying to better understand the HMD market in terms of applications breakdown versus technologies, and more specifically the aspects of electro-optics.
Grant
Jan, 2019
I am doing market research to determine which companies are in the HMD space, as well as other spaces related to VR/MoCap/AR. I am running an study as part of an innovation award to determine best fit with our applications. Any help will be appreciated. .
Jonghyun
Jan, 2013
Please send me some market insights or key findings that I can use to get a client to buy the full report OR come back with a custom request. .
Teanna
Nov, 2015
I am an Industrial student at the University and working on a project on virtual reality industry and different variety of HMDs. I was wondering if you had a student discount rate for your site?.
Ikue
Sep, 2015
I want to get forecast not only HMD device, but also service and solution revenue forecast by using HMD. I want to know categorized service and solution revenue forecast by using HMD are included in this report or not..
Cristina
Sep, 2015
Can you provide data about systems integrated in the helmet for the firefighting? Thanks in advance for your support..
Akiko
Aug, 2012
I would like to know more details regarding research methodology and validation sources. Also, looking for customized research in this area..
Seonaidh
Aug, 2016
Interested to more about Eyewear Segment Expected to Grow at the highest CAGR during forecast period..
Elango
Apr, 2018
Please provide the global data and some validate statistics for head mounted devices for Indian market. .