Mobile Engagement Market by User Type (SME, LSE), Solution (SMS & MMS, Push Notification, In-App Messaging, E-mail, App/Web Content), Vertical (Financial Services, Retail, Travel & Hospitality, Telecom & IT), and Region - Global Forecast to 2023


[141 Pages Report] The mobile engagement market was valued at USD 2.33 Billion in 2016 and is expected to reach USD 38.70 Billion by 2023, at a CAGR of 43.46% during the forecast period. In this report, 2016 has been considered as the base year, and the market size forecast is provided for 2017–2023.
Objective of the Study:
- To define, describe, and forecast the mobile engagement market based on vertical, user type, solution, and geography
- To forecast the size of the market segments with respect to the North America, Europe, Asia Pacific (APAC), and Rest of the World (RoW)
- To provide detailed information regarding major factors influencing the growth of the market (drivers, restraints, opportunities, and challenges)
The mobile engagement market will be valued at 4.44 Billion in 2017 and is expected to reach USD 38.70 Billion by 2023, at a CAGR of 43.46% between 2017 and 2023. The increasing use of mobile device applications is among the major driving factors for this market. Moreover, companies are adopting the mobile first approach that helps them recognize the significant role of mobile devices in enhancing the consumer experience. The increased adoption of the mobile first approach has allowed companies to gain in-depth understanding of brands and consumers, meet consumer needs through mobile devices, and communicate their value proposition effectively.
The mobile engagement market has been segmented on the basis of user type, solution, vertical, and geography. The mobile engagement market, by user type, has been segmented into SMEs and LSEs. The market for SMEs is expected to grow at a higher CAGR during the forecast period. An increasing number of vendors are likely to come up with solutions specifically to cater to the demands of SMEs.
On the basis of solution, the market has been classified into SMS and MMS, push notifications, in-app messaging, e-mails, and app/web content. The market for push notifications is expected to grow at the highest CAGR during the forecast period. For instance, in March 2017, Urban Airship launched Urban Airship Web Notify, a web push notification solution, to help marketers engage new website visitors and boost connections with returning visitors through personalized, real-time messaging.
Mobile engagement offers a number of effective and economical marketing channels for all verticals. Mobile marketing solutions have been widely adopted by several verticals owing to the increased usage of mobile devices as well as the need to attract, engage, acquire, and retain customers. The retail vertical accounted for the largest share of the market in 2016. Mobile marketing plays an important role in helping retailers adjust to this changed consumer behavior. Retailers also look for mobile marketing solutions to improve their CRM and increase application engagement. The finance vertical is expected to witness the highest growth during the forecast period. Mobile marketing channels help banks and financial institutions collect and analyze data, understand customer needs better, and accordingly target them with appropriate offers. This, in turn, is expected propel the growth of the mobile engagement market for the finance vertical during the forecast period.
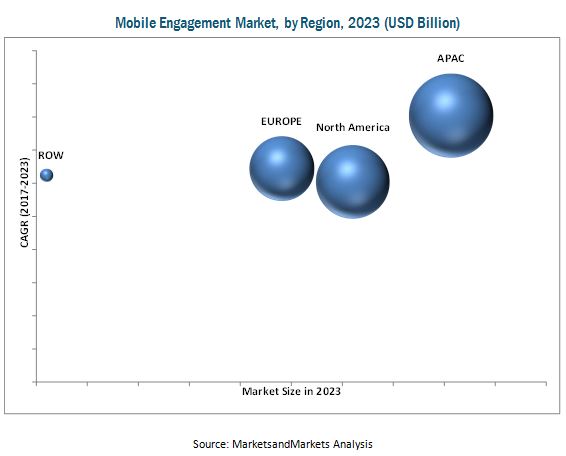
The mobile engagement market in APAC is expected to grow at the highest CAGR during the forecast period owing to the rapid deployment of mobile telecommunication infrastructure and the increasing use of smartphones.
One of the major restraints for the mobile engagement market is the difficulty in monetizing mobile apps. The majority of the world has switched from PCs to mobile phones for internet usage. This has helped the native mobile app developers to establish monetization strategies for their respective websites. With the explosion of free apps, revenues have become highly dependent on these free apps. Paid downloads have also played a good role in attracting the maximum app revenues.
Key players in this market focus on strategic partnerships and collaborations, acquisitions, agreements, contracts, and new launches to increase their revenue. IBM (US) is a leading player in the mobile engagement market, followed by Salesforce (US), and Oracle (US). In June 2016, IBM partnered with The Boots Company to launch Sales Assist, an IBM MobileFirst for iOS app, across its stores in the UK to make products easily available for its customers.
To speak to our analyst for a discussion on the above findings, click Speak to Analyst
 Exclusive indicates content/data unique to MarketsandMarkets and not available with any competitors.
Table of Contents
1 Introduction (Page No. - 13)
1.1 Objectives of the Study
1.2 Definition
1.3 Study Scope
1.3.1 Markets Covered
1.3.2 Geographic Score
1.3.3 Years Considered for the Study
1.4 Currency
1.5 Limitations
1.6 Stakeholders
2 Research Methodology (Page No. - 16)
2.1 Research Data
2.1.1 Secondary Data
2.1.1.1 Key Data From Secondary Sources
2.1.2 Primary Data
2.1.2.1 Key Data From Primary Sources
2.1.2.2 Key Industry Insights
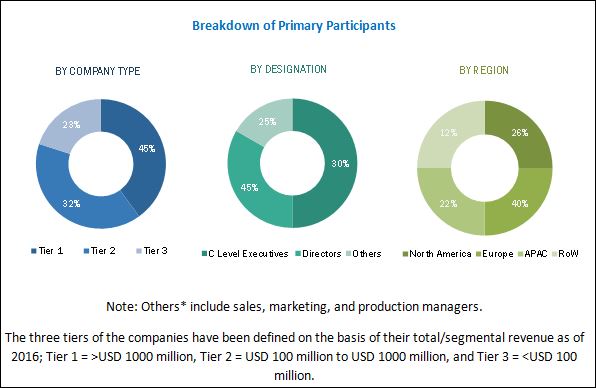
2.1.2.3 Breakdown of Primaries
2.2 Market Size Estimation
2.2.1 Bottom-Up Approach
2.2.2 Top-Down Approach
2.3 Market Breakdown and Data Triangulation
2.4 Research Assumptions
3 Executive Summary (Page No. - 24)
4 Premium Insight (Page No. - 29)
4.1 Increasing Demand for Mobile Engagement Solutions in Retail and Financial Services Verticals to Drive Market Growth
4.2 Mobile Engagement Market, By Vertical
4.3 Mobile Engagement Market, 2017
4.4 Mobile Engagement Market, By Region & By Solution
4.5 Mobile Engagemnent Automation Market: Industry Adoption Analysis
5 Market Overview (Page No. - 33)
5.1 Introduction
5.2 Market Dynamics
5.2.1 Drivers
5.2.1.1 High Penetration of Mobile Phones
5.2.1.2 Increasing Use of Mobile Device Applications
5.2.1.3 Growing Focus Toward Mobile First Strategy
5.2.2 Restraints
5.2.2.1 High Initial Investment to Set Up Mobile Engagement Campaigns
5.2.2.2 Difficulty in Monetizing Mobile Apps
5.2.3 Opportunities
5.2.3.1 Development of Mobile Engagement Applications for Healthcare Vertical
5.2.3.2 Increased Use of Social Media Platforms Enhancing Mobile Engagement
5.2.3.3 Rapid Development of Information Technology and Digital Services Increasing Connectivity With Consumers in Travel and Hospitality Vertical
5.2.4 Challenges
5.2.4.1 Increasing Concerns Related to Data Privacy
6 Mobile Engagement Market, By Vertical (Page No. - 38)
6.1 Introduction
6.2 Financial Services
6.3 Media and Entertainment
6.4 Retail
6.5 Travel and Hospitality
6.6 Telecom and IT
6.7 Others
7 Mobile Engagement Market, By User Type (Page No. - 53)
7.1 Introduction
7.2 Small and Medium-Sized Enterprises
7.3 Large-Scale Enterprises
8 Mobile Engagement Market, By Solution (Page No. - 59)
8.1 Introduction
8.2 SMS and MMS
8.3 Push Notifications
8.4 In-App Messaging
8.5 E-Mails
8.6 App /Web Content
8.7 Other Solutions
9 Geographic Analysis (Page No. - 73)
9.1 Introduction
9.2 North America
9.2.1 US
9.2.2 Canada
9.2.3 Mexico
9.3 Europe
9.3.1 UK
9.3.2 Germany
9.3.3 France
9.3.4 Rest of Europe
9.4 APAC
9.4.1 Japan
9.4.2 China
9.4.3 India
9.4.4 Australia
9.4.5 Rest of APAC
9.5 RoW
9.5.1 Middle East & Africa
9.5.2 South America
10 Competitive Landscape (Page No. - 93)
10.1 Introduction
10.2 Market Ranking Analysis: Mobile Engagement Market
10.3 Competitive Scenario
10.4 Recent Developments
10.4.1 Product Launches
10.4.2 Partnerships/Agreements
10.4.3 Acquisitions
11 Company Profiles (Page No. - 97)
(Business Overview, Products Offered, Product Offering Scorecard, Business Strategy Scorecard, Recent Developments, Key Relationships)*
11.1 IBM
11.2 Salesforce
11.3 Oracle
11.4 Adobe
11.5 Vibes
11.6 Selligent
11.7 Urban Airship
11.8 Appboy
11.9 Localytics
11.10 Swrve
11.11 Tapjoy
11.12 Marketo
11.13 Key Innovators
11.13.1 Accengage
11.13.2 Followanalytics
11.13.3 Leanplum
11.13.4 Smartfocus
11.13.5 Webtrekk
*Details on Business Overview, Products Offered, Product Offering Scorecard, Business Strategy Scorecard, Recent Developments, Key Relationships Might Not Be Captured in Case of Unlisted Companies.
12 Appendix (Page No. - 133)
12.1 Insights of Industry Experts
12.2 Discussion Guide
12.3 Knowledge Store: Marketsandmarkets’ Subscription Portal
12.4 Introducing RT: Real-Time Market Intelligence
12.5 Available Customizations
12.6 Related Reports
12.7 Author Details
List of Tables (66 Tables)
Table 1 Mobile Engagement Market, By Vertical, 2015–2023 (USD Million)
Table 2 Mobile Engagement Market for Financial Services, By User Type, 2015–2023 (USD Million)
Table 3 Market for Financial Services, By Region, 2015–2023 (USD Million)
Table 4 Market for Financial Services, By Solution, 2015–2023 (USD Million)
Table 5 Market for Media and Entertainment, By User Type, 2015–2023 (USD Million)
Table 6 Market for Media and Entertainment, By Region, 2015–2023 (USD Million)
Table 7 Market for Media and Entertainment, By Solution, 2015–2023 (USD Million)
Table 8 Mobile Engagement Market for Retail, By User Type, 2015–2023 (USD Million)
Table 9 Market for Retail, By Region, 2015–2023 (USD Million)
Table 10 Mobile Engagement Market for Retail, By Solution, 2015–2023 (USD Million)
Table 11 Market for Travel and Hospitality, By User Type, 2015–2023 (USD Million)
Table 12 Market for Travel and Hospitality, By Region, 2015–2023 (USD Million)
Table 13 Market for Travel and Hospitality, By Solution, 2015–2023 (USD Million)
Table 14 Market for Telecom and IT, By User Type, 2015–2023 (USD Million)
Table 15 Market for Telecom and IT, By Region, 2015–2023 (USD Million)
Table 16 Market for Telecom and IT, By Solution, 2015–2023 (USD Million)
Table 17 Market for Others, By User Type, 2015–2023 (USD Million)
Table 18 Market for Others, By Region, 2015–2023 (USD Million)
Table 19 Market for Others, By Solution, 2015–2023 (USD Million)
Table 20 Mobile Engagement Market, By User Type, 2015–2023 (USD Million)
Table 21 Market for SMES, By Geography, 2015–2023 (USD Million)
Table 22 Market for SMES, By Solution, 2015–2023 (USD Million)
Table 23 Market for SMES, By Vertical, 2015–2023 (USD Million)
Table 24 Market for LSES, By Geography, 2015–2023 (USD Million)
Table 25 Market for LSES, By Solution, 2015–2023 (USD Million)
Table 26 Market for LSES, By Vertical, 2015–2023 (USD Million)
Table 27 Mobile Engagement Market, By Solution, 2015–2023 (USD Million)
Table 28 Market for SMS/MMS, By Vertical, 2015–2023 (USD Million)
Table 29 Market for SMS/MMS, By User Type, 2015–2023 (USD Million)
Table 30 Market for SMS/MMS, By Geography, 2015–2023 (USD Million)
Table 31 Market for Push Notifications, By Vertical, 2015–2023 (USD Million)
Table 32 Market for Push Notifications, By User Type, 2015–2023 (USD Million)
Table 33 Market for Push Notifications, By Geography, 2015–2023 (USD Million)
Table 34 Mobile Engagement Market for In-App Messaging, By Vertical, 2015–2023 (USD Million)
Table 35 Market for In-App Messaging, By User Type, 2015–2023 (USD Million)
Table 36 Market for In-App Messaging, By Geography, 2015–2023 (USD Million)
Table 37 Market for E-Mails, By Vertical, 2015–2023 (USD Million)
Table 38 Market for E-Mails, By User Type, 2015–2023 (USD Million)
Table 39 Market for E-Mails, By Geography, 2015–2023 (USD Million)
Table 40 Mobile Engagement Market for App/ Web Content, By Vertical, 2015–2023 (USD Million)
Table 41 Market for App/Web Content, By User Type, 2015–2023 (USD Million)
Table 42 Market for App/Web Content, By Geography, 2015–2023 (USD Million)
Table 43 Market for Other Solutions, By Vertical, 2015–2023 (USD Million)
Table 44 Market for Other Solutions, By User Type, 2015–2023 (USD Million)
Table 45 Market for Other Solutions, By Geography, 2015–2023 (USD Million)
Table 46 Mobile Engagement Market, By Region, 2015–2023 (USD Million)
Table 47 Market in North America, By Country, 2015–2023 (USD Million)
Table 48 Market in North America, By Vertical, 2015–2023 (USD Million)
Table 49 Market in North America, By Solution, 2015–2023 (USD Million)
Table 50 Market in North America, By User Type, 2015–2023 (USD Million)
Table 51 Mobile Engagement Market in Europe, By Country/Region, 2015–2023 (USD Million)
Table 52 Market in Europe, By Vertical, 2015–2023 (USD Million)
Table 53 Market in Europe, By Solution, 2015–2023 (USD Million)
Table 54 Market in Europe, By User Type, 2015–2023 (USD Million)
Table 55 Market in APAC, By Country/Region, 2015–2023 (USD Million)
Table 56 Market in APAC, By Vertical, 2015–2023 (USD Million)
Table 57 Market in APAC, By Solution, 2015–2023 (USD Million)
Table 58 Market in APAC, By User Type, 2015–2023 (USD Million)
Table 59 Market in RoW, By Region, 2015–2023 (USD Million)
Table 60 Market in RoW, By Vertical, 2015–2023 (USD Million)
Table 61 Market in RoW, By Vertical, 2015–2023 (USD Million)
Table 62 Market in RoW, By User Type, 2015–2023 (USD Million)
Table 63 Ranking of Top 5 Players in Mobile Engagement Market (2016)
Table 64 Product Launches, 2015–July 2017
Table 65 Partnerships/Agreements, 2015–July 2017
Table 66 Acquisitions, 2015–July 2017
List of Figures (47 Figures)
Figure 1 Segmentation of the Mobile Engagement Market
Figure 2 Research Design
Figure 3 Process Flow of Market Size Estimation
Figure 4 Data Triangulation
Figure 5 Retail Vertical to Hold the Largest Size of the Market in 2017
Figure 6 Market for SMES to Grow at A Higher Rate Between 2017 and 2023
Figure 7 Push Notifications to Lead the Mobile Engagement Market Between 2017 and 2023
Figure 8 Market for Push Notifications for Financial Services Vertical to Grow at the Highest Rate During the Forecast Period
Figure 9 Market in APAC to Grow at the Highest Rate Between 2017 and 2023
Figure 10 Attractive Growth Opportunities for the Market
Figure 11 Retail Vertical to Hold the Largest Size of the Market By 2023
Figure 12 Market in India to Grow at the Highest CAGR During the Forecast Period
Figure 13 Push Notifications to Hold the Largest Share of the Market in 2017
Figure 14 Market for Financial Services Vertical is at ITs Growth Stage
Figure 15 Market Dynamics: Mobile Engagement Market
Figure 16 Penetration of Sim Cards in Different Regions Between 2015 and 2020
Figure 17 Global Average Time Spent in Hours/Day on In-App Messaging Between 2016 and 2017
Figure 18 Mobile Engagement Market, By Vertical
Figure 19 SMES Expected to Lead Mobile Engagement Market for Media and Entertainment During Forecast Period
Figure 20 SMES Expected to Lead Mobile Engagement Market for Retail During Forecast Period
Figure 21 Market for Push Notification Expected to Grow at Highest CAGR During Forecast Period
Figure 22 Market for SMES Expected to Grow at Higher CAGR During Forecast Period
Figure 23 Market for Others in APAC Expected to Grow at Highest CAGR During Forecast Period
Figure 24 Mobile Engagement Market, By User Type
Figure 25 Market for LSES in RoW to Grow at the Highest CAGR During the Forecast Period
Figure 26 Mobile Engagement Market, By Solution
Figure 27 Market for In-App Messaging for Retail Vertical to Grow at the Highest CAGR During the Forecast Period
Figure 28 Market for E-Mails for SMES to Grow at A Higher CAGR During the Forecast Period
Figure 29 Market for App/Web Content for SMES to Grow at A Higher CAGR During the Forecast Period
Figure 30 Market for Other Solutions in APAC to Grow at the Highest CAGR During the Forecast Period
Figure 31 Mobile Engagement Market, By Geography
Figure 32 Geographic Snapshot: Mobile Engagement Market in APAC to Grow at the Highest Rate During the Forecast Period
Figure 33 Market in India to Grow at the Highest CAGR Between 2017 and 2023
Figure 34 Segmentation of the Mobile Engagement Market in North America
Figure 35 North America: Market Snapshot
Figure 36 Segmentation of the Market in Europe
Figure 37 Europe: Mobile Engagement Market Snapshot
Figure 38 Segmentation of the Market in APAC
Figure 39 APAC: Market Snapshot
Figure 40 Segmentation of the Market in RoW
Figure 41 Key Growth Strategies Adopted By Top Companies, 2015–July 2017
Figure 42 Market Evaluation Framework: Product Launches Fueled Growth and Innovation Between 2015 and July 2017
Figure 43 Battle for Market Share: Product Launches Was Considered Key Strategy Between 2015 and July 2017
Figure 44 IBM: Company Snapshot
Figure 45 Salesforce: Company Snapshot
Figure 46 Oracle: Company Snapshot
Figure 47 Adobe: Company Snapshot
The research methodology used to estimate and forecast the mobile engagement market begins with obtaining data on the revenues of key vendors through secondary research sources such as Mobile Marketing Association, Business Marketing Association, Software and Information Industry Association, and Club Texting, Vendor offerings are taken into consideration to determine the market segmentation. Top-down approach has been employed to arrive at the overall market size of the global mobile engagement market, including integration of software across various verticals and applications and determining the average project cost in terms of USD. After arriving at the overall market size, the total market is split into several segments and subsegments. This is further verified through primary research by conducting extensive interviews with key people—such as CEOs, VPs, directors, and executives. Data triangulation and market breakdown procedures are employed to complete the overall market engineering process and arrive at the exact statistics for all the segments and subsegments.
To know about the assumptions considered for the study, download the pdf brochure
This study also answers several questions, such as which market segments to focus on in the next 2–5 years for prioritizing efforts and investments for stakeholders. Major players operating in the mobile engagement market include IBM (US), Salesforce (US), Oracle (US), Adobe (US), Vibes Media (US), Selligent (Belgium), Urban Airship (US), Appboy (US), Localytics (US), Swrve (US), Tapjoy (US), and Marketo (US).
Target Audience:
- Mobile engagement solution providers
- Small and medium-sized enterprises (SMEs) and large-scale enterprises (LSEs)
- Mobile marketing service providers
- Marketing automation solution providers
- Operations support system (OSS)/business support system (BSS) solution providers
- Cloud computing and software developers
- Advertising agents
- Content providers
- Mobile application developers
Scope of the Report:
The global mobile engagement market, in this research report, has been segmented on the basis of user type, solution, vertical, and geography.
Mobile engagement Market, by User Type:
- SMEs
- LSEs
Mobile engagement Market, by Solution:
- SMS and MMS
- Push Notifications
- In-App Messaging
- E-mails
- App/ Web Content
- Other Solutions
Mobile engagement Market, by Vertical:
- Financial Services
- Media and Entertainment
- Retail
- Travel and Hospitality
- Telecom and IT
- Others
Mobile engagement Market, by Region:
- North America
- Europe
- APAC
- RoW
Available Customizations
With the given market data, MarketsandMarkets offers customizations according to the company’s specific needs. The following customization options are available for the report:
-
Geographic Analysis
- Comprehensive coverage of regulations followed in each region (North America, Europe, APAC, and RoW)
-
Company Information
- Detailed analysis and profiling of additional market players (up to 10)


Growth opportunities and latent adjacency in Mobile Engagement Market