Mobile Threat Defense Market

Mobile Threat Defense Market by Offering, Operating System (iOS, Android, Other OS), Deployment Mode (On-premises and Cloud), Organization Size, Application (Phishing, Ransomware, Malware), Vertical, Region - Global Forecast to 2028

Report Code: TC 8841 Nov, 2023, by marketsandmarkets.com

[273 Pages Report] The global mobile threat defense market is estimated to be worth USD 2.6 billion in 2023 and is projected to reach USD 7.2 billion by 2028, at a CAGR of 22.9% during the forecast period. The driving force behind the mobile threat defense market lies in the relentless expansion of the mobile ecosystem and the persistent evolution of cyber threats targeting it. The rapid proliferation of smartphones and tablets in personal and professional settings has made mobile devices integral to everyday life and business operations. This ubiquity, however, has also made them an attractive target for cyber adversaries. Simultaneously, the continuous advancement of mobile technology introduces new vulnerabilities and risks. The imperative to protect sensitive data, maintain regulatory compliance, and adapt to an ever-shifting threat landscape fuels the demand for MTD solutions. Organizations are recognizing the necessity of comprehensive mobile security measures in a landscape where mobile endpoints are the primary interface to critical data and network access, and this recognition is the primary driver of the MTD market's growth.

Mobile Threat Defense Market

To know about the assumptions considered for the study, Request for Free Sample Report

Mobile Threat Defense Market

To know about the assumptions considered for the study, download the pdf brochure

Driver: Proliferation of Mobile Devices

The proliferation of mobile devices represents a fundamental driver of the MTD market. The world is increasingly mobile-centric, from smartphones and tablets to an ever-expanding array of IoT devices. As mobile endpoints multiply and diversify, they create a vast attack surface for cyber threats. This ubiquity makes mobile devices prime targets for cybercriminals seeking unauthorized access to sensitive data and networks. Organizations across sectors have realized that a comprehensive and adaptable mobile threat defense (MTD) solution is not just desirable but indispensable.

Restraint: Privacy Concerns

One central constraint facing the MTD market is the need to strike a delicate balance between security and user privacy. MTD solutions must be robust enough to protect mobile devices and data from threats without compromising user privacy. Overly intrusive security measures can raise significant privacy concerns among users, potentially leading to resistance and pushback. Furthermore, excessively invasive security measures can run afoul data protection regulations, leading to legal and compliance challenges.

Opportunity: Industry-Specific Solutions

The diverse landscape of industries, each with its distinct security requirements and regulatory compliance mandates, provides an opportunity for MTD providers to offer industry-specific solutions. Sectors such as healthcare, finance, and government have unique security challenges. Tailoring MTD solutions to address these specific needs and align with industry-specific standards opens avenues for providers to deliver specialized security services. By catering to these niche markets, MTD providers can establish themselves as experts in addressing the sector-specific security concerns of their clients, enhancing their market presence and relevance.

Challenge: Evolving Threat Landscape

The ever-evolving and dynamic nature of mobile threats is a persistent and significant challenge in the MTD market. Cybercriminals innovate new attack techniques, leverage zero-day vulnerabilities, and deploy advanced malware to target mobile endpoints. MTD solutions must remain vigilant and adaptable to effectively counter these emerging threats. The speed at which new threats emerge necessitates proactive threat intelligence and rapid response mechanisms within MTD solutions, making it an ongoing challenge for providers to stay ahead of the threat landscape.

Mobile Threat Defense Market Ecosystem

Mobile Threat Defense Market

The major players in the mobile threat defense market are Cisco Systems, Citrix Systems, Kaspersky Labs, Broadcom, Micro Focus, and so on. The mobile threat defense market is driven by prominent companies that have established themselves as leaders in the industry. These companies are well-established, financially stable, and have a proven track record of providing innovative solutions and services in mobile threat defense. Their diverse product portfolio spans infrastructure, solutions, applications, and services, enabling them to cater to the market’s evolving needs. With state-of-the-art technologies and extensive capabilities, these companies are at the forefront of advancing mobile threat defense technology.

By offering, the services segment to register the highest growth rate during the forecast period

As organizations increasingly recognize the importance of MTD, they are seeking professional services to implement, manage, and optimize these solutions effectively. The complexity of mobile security threats and the evolving threat landscape make expert guidance and support crucial in deploying and maintaining MTD solutions. The managed services component within the services segment is gaining traction as organizations look to outsource their mobile security needs to specialized providers. Managed service providers can proactively monitor, detect, and respond to mobile threats on behalf of organizations, relieving them of the burden of in-house management and enhancing overall security. The services segment is instrumental in customizing MTD solutions to meet specific security requirements, compliance standards, and industry-specific regulations. Tailored services help organizations maximize the effectiveness of their MTD solutions in addressing their unique security challenges. The growth of the services segment underscores the importance of having not only robust technology solutions but also expert guidance and support to navigate the complex landscape of mobile security effectively.

Based on OS, the android segment to account for the largest market size in the MTD market

In the Mobile Threat Defense market, the Android segment is projected to take the lead by accounting for the largest market size. This prominence is rooted in several compelling factors. Android stands as the undisputed champion in the global mobile operating system arena, boasting the largest user base among smartphones and tablets worldwide. Its widespread adoption positions the Android segment as a pivotal focus area within the MTD market. The prevalence of Android devices extends to both consumer and enterprise environments, where many businesses deploy Android devices for their workforce. The security of corporate data, user authentication, and communication is paramount in these settings, thereby escalating the demand for MTD solutions finely tuned to the Android ecosystem. Android's influence extends beyond traditional mobile devices, encompassing a diverse array of IoT devices and embedded systems. These components demand robust security measures to ensure the integrity and authentication of IoT connections and data, and MTD solutions play a crucial role in meeting these requirements.

Asia Pacific to register the highest growth rate during the forecast period.

The Asia Pacific region is poised to experience the highest growth rate during the forecast period. This surge in demand can be attributed to a convergence of several key factors. The region is undergoing a profound digital transformation, with businesses and industries rapidly embracing digital technologies and mobile devices. As this transformation unfolds, the attack surface for cyber threats widens significantly, intensifying the imperative for robust MTD solutions to protect sensitive data and secure digital operations. The Asia Pacific region is witnessing a substantial increase in mobile device adoption. A significant portion of the population relies on smartphones and tablets for a wide range of activities, from communication to online services and e-commerce. This surge in mobile endpoints magnifies the urgency of safeguarding personal information and sensitive data from cyber threats. Evolving regulatory standards within several countries in the Asia Pacific region are also playing a pivotal role. The implementation and reinforcement of data protection regulations require organizations to adopt advanced mobile security solutions to ensure the privacy and security of user data. The growth of remote work and the increasing sophistication of mobile-specific threats further contribute to the rising demand for MTD solutions. Organizations are grappling with securing remote endpoints and fortifying their defenses against advanced threats, which are more prevalent in a mobile-centric work environment.

Mobile Threat Defense Market Size, and Share

Key Market Players:

The major players in the mobile threat defense market are Cisco Systems (California), SAP (Germany), Broadcom (California), VMware (California), Citrix Systems (Florida), Kaspersky Labs (Russia), Ivanti (Utah), Micro Focus (United Kingdom), ZOHO (India), SolarWinds (Texas), Zimperium (Texas), Matrix42 (Germany), Sophos (United Kingdom), Blackberry (Canada), Esper (California), Lookout (California), Wandera (California), Pradeo (France), ZecOps (Israel), GuardSquare (Belgium), Upstream Security (Israel), Nexthink (Switzerland), Snyk (United Kingdom), Barracuda Networks (California), Zimbra (Texas), Bromium (California), AppGuard (Maryland), CellTrust (Arizona), SentinelOne (California).

Get online access to the report on the World's First Market Intelligence Cloud

  • Easy to Download Historical Data & Forecast Numbers
  • Company Analysis Dashboard for high growth potential opportunities
  • Research Analyst Access for customization & queries
  • Competitor Analysis with Interactive dashboard
  • Latest News, Updates & Trend analysis
Request Sample

Scope of the Report

Report Metrics

Details

Market size available for years

2018-2028

Base year considered

2022

Forecast period

2023-2028

Forecast units

Value (USD) Million/Billion

Segments Covered

By offering, OS, deployment mode, organization size, application, and vertical

Region covered

North America, Europe, Asia Pacific, Middle East and Africa, and Latin America

Companies covered

Cisco Systems (California), SAP (Germany), Broadcom (California), VMware (California), Citrix Systems (Florida), Kaspersky Labs (Russia), Ivanti (Utah), Micro Focus (United Kingdom), ZOHO (India), SolarWinds (Texas), Zimperium (Texas), Matrix42 (Germany), Sophos (United Kingdom), Blackberry (Canada), Esper (California), Lookout (California), Wandera (California), Pradeo (France), ZecOps (Israel), GuardSquare (Belgium), Upstream Security (Israel), Nexthink (Switzerland), Snyk (United Kingdom), Barracuda Networks (California), Zimbra (Texas), Bromium (California), AppGuard (Maryland), CellTrust (Arizona), SentinelOne (California)

This research report categorizes the mobile threat defense market to forecast revenues and analyze trends in each of the following submarkets:

Based on offering:
  • Solutions
  • Services
Based on services:
  • Professional
  • Managed
Based on OS:
  • iOS
  • Android
  • Other OS
Based on deployment mode:
  • Cloud
  • On-Premises
Based on organization size:
  • Large Enterprises
  • SMEs
Based on application:
  • Phishing
  • Ransomware
  • Malware
  • DDoS
  • APT
  • Other threat types
Based on the vertical:
  • BFSI
  • IT & Telecom
  • Retail & E-commerce
  • Healthcare & Life Sciences
  • Governement & Defense
  • Manufacturing
  • Other Verticals
Based on the region:
  • North America
    • US
    • Canada
  • Europe
    • UK
    • Germany
    • France
    • Rest of Europe
  • Asia Pacific
    • ANZ
    • China
    • Japan
    • Rest of Asia Pacific
  • Middle East and Africa
    • UAE
    • KSA
    • South Africa
    • Rest of Middle East & Africa
  • Latin America
    • Brazil
    • Mexico
    • Rest of Latin America

Recent Developments

  • May 2023 - Ulaa is a privacy-focused browser that was developed by Zoho Corporation with the purpose of protecting personal information. It has built-in features that prevent tracking and website monitoring on all platforms. With features that support privacy customization, integrated user profile modes, and productivity aids, the privacy-focused browser ensures the protection and privacy of user data.
  • Apr 2023 - Cisco unveiled the enhanced Duo MFA features and the new XDR solution to assist enterprises in strengthening the security of their whole IT ecosystem. Cisco keeps up its motto of "if it's connected, you're also protected" by empowering security operations teams to react to intrusions and take them out before they have a chance to do significant damage.
  • Jan 2023 - As part of their strategic relationship, Ivanti and Lookout have expanded to incorporate Lookout Mobile Endpoint Security as a component of the Ivanti Neurons automation platform.
  • With the help of the integrated solution, which also consists of Ivanti Go and Ivanti Neurons for Modern Device Management, Ivanti customers can implement a mobile strategy to safeguard their hybrid workforce and lower overall organisational risk.
  • Oct 2022 - BlackBerry introduced its Cyber Threat Intelligence service, a skilled threat intelligence solution designed to assist clients in identifying, averting, and efficiently handling cyberattacks. This service provides actionable intelligence on threat actors and campaigns driven by cybercrime, targeted attacks, and intelligence reports tailored to particular nations, industries, and areas. With BlackBerry's CTI, enterprises may focus on particular areas of interest relating to their security needs and save time and money.

Frequently Asked Questions (FAQ):

To speak to our analyst for a discussion on the above findings, click Speak to Analyst

TABLE OF CONTENTS
 
1 INTRODUCTION (Page No. - 48)
    1.1 STUDY OBJECTIVES 
    1.2 MARKET DEFINITION 
           1.2.1 INCLUSIONS AND EXCLUSIONS
    1.3 MARKET SCOPE 
           1.3.1 MARKET SEGMENTATION
           1.3.2 YEARS CONSIDERED
    1.4 CURRENCY CONSIDERED 
           TABLE 1 USD EXCHANGE RATES, 2020–2022
    1.5 STAKEHOLDERS 
 
2 RESEARCH METHODOLOGY (Page No. - 53)
    2.1 RESEARCH DATA 
           FIGURE 1 MOBILE THREAT DEFENSE MARKET: RESEARCH DESIGN
           2.1.1 SECONDARY DATA
           2.1.2 PRIMARY DATA
                    2.1.2.1 Breakup of primary profiles
                    2.1.2.2 Key insights from industry experts
    2.2 DATA TRIANGULATION AND MARKET BREAKUP 
           FIGURE 2 DATA TRIANGULATION
    2.3 MARKET SIZE ESTIMATION 
           FIGURE 3 MARKET SIZE ESTIMATION METHODOLOGY, APPROACH 1 (SUPPLY SIDE): REVENUE OF SOLUTIONS AND SERVICES IN MARKET
           FIGURE 4 MARKET SIZE ESTIMATION METHODOLOGY—APPROACH 1, SUPPLY-SIDE ANALYSIS
           FIGURE 5 MARKET SIZE ESTIMATION METHODOLOGY—APPROACH 1—BOTTOM-UP (SUPPLY SIDE): COLLECTIVE REVENUE OF SOLUTIONS AND SERVICES IN MARKET
           FIGURE 6 MARKET SIZE ESTIMATION METHODOLOGY—APPROACH 2—BOTTOM-UP (DEMAND SIDE)
    2.4 MARKET FORECAST 
           TABLE 2 FACTOR ANALYSIS
    2.5 RESEARCH ASSUMPTIONS 
    2.6 LIMITATIONS 
    2.7 RECESSION IMPACT 
           FIGURE 7 MOBILE THREAT DEFENSE MARKET: RECESSION IMPACT
 
3 EXECUTIVE SUMMARY (Page No. - 63)
    FIGURE 8 MARKET TO WITNESS FAST GROWTH DURING FORECAST PERIOD 
    FIGURE 9 MARKET: FASTEST-GROWING SEGMENTS,  2023–2028 
    FIGURE 10 NORTH AMERICA TO ACCOUNT FOR LARGEST MARKET SHARE IN 2023 
 
4 PREMIUM INSIGHTS (Page No. - 66)
    4.1 BRIEF OVERVIEW OF MOBILE THREAT DEFENSE MARKET 
           FIGURE 11 INCREASING INSTANCES OF MALWARE AND FILE-BASED ATTACKS AND STRINGENT REGULATORY NORMS TO DRIVE MARKET
    4.2 MARKET, BY OFFERING, 2023 
           FIGURE 12 SOLUTIONS SEGMENT TO HOLD LARGER MARKET SHARE DURING FORECAST PERIOD
    4.3 MARKET, BY OS, 2023 VS. 2028 
           FIGURE 13 ANDROID SEGMENT TO HOLD LARGEST MARKET DURING FORECAST PERIOD
    4.4 MARKET, BY DEPLOYMENT MODE, 2023 VS. 2028 
           FIGURE 14 CLOUD SEGMENT TO HOLD LARGER MARKET DURING FORECAST PERIOD
    4.5 MARKET, BY ORGANIZATION SIZE, 2023 VS. 2028 
           FIGURE 15 LARGE ENTERPRISES SEGMENT TO HOLD LARGER MARKET DURING FORECAST PERIOD
    4.6 MARKET, BY VERTICAL, 2023 VS. 2028 
           FIGURE 16 IT & TELECOM SEGMENT TO HOLD LARGEST MARKET DURING FORECAST PERIOD
    4.7 MARKET INVESTMENT SCENARIO 
           FIGURE 17 ASIA PACIFIC TO EMERGE AS BEST MARKET FOR INVESTMENT
 
5 MARKET OVERVIEW AND INDUSTRY TRENDS (Page No. - 70)
    5.1 INTRODUCTION 
    5.2 MARKET DYNAMICS 
           FIGURE 18 DRIVERS, RESTRAINTS, OPPORTUNITIES, AND CHALLENGES: MOBILE THREAT DEFENSE MARKET
           5.2.1 DRIVERS
                    5.2.1.1 Growing sophistication of mobile threats
                    5.2.1.2 Increasing adoption of mobile devices
                    5.2.1.3 Increasing productivity of employees and enterprises through BYOD
           5.2.2 RESTRAINTS
                    5.2.2.1 Complexity of integrating mobile threat defense solutions across wide spectrum of mobile device types
           5.2.3 OPPORTUNITIES
                    5.2.3.1 Increasing adoption of BYOD devices
           5.2.4 CHALLENGES
                    5.2.4.1 Increasing complexity of advanced threats
                    5.2.4.2 Lack of awareness regarding mobile security and related cyber threats
    5.3 INDUSTRY TRENDS 
           5.3.1 BRIEF HISTORY OF MOBILE THREAT DEFENSE
                    FIGURE 19 BRIEF HISTORY OF MOBILE THREAT DEFENSE
                    5.3.1.1 2000s
                    5.3.1.2 2010s
                    5.3.1.3 2020s
                    5.3.1.4 2022
           5.3.2 ECOSYSTEM/MARKET MAP
                    TABLE 3 MOBILE THREAT DEFENSE MARKET: ECOSYSTEM
                    FIGURE 20 MARKET: ECOSYSTEM
           5.3.3 CASE STUDY ANALYSIS
                    5.3.3.1 Case Study 1: Laclede Gas Company protected corporate data in BYOD and CYOD environments with Symantec
                    5.3.3.2 Case study 2: European financial institution deployed Promon SHIELD to offer cybersecurity on mobile and desktop devices
                    5.3.3.3 Case study 3: Quest Diagnostics installed Symantec Mobility Suite to capture test data and send it securely to lab to ensure compliance
           5.3.4 VALUE CHAIN ANALYSIS
                    FIGURE 21 VALUE CHAIN ANALYSIS: MARKET
           5.3.5 REGULATORY BODIES, GOVERNMENT AGENCIES, AND OTHER ORGANIZATIONS
                    TABLE 4 REGULATORY BODIES, GOVERNMENT AGENCIES, AND OTHER ORGANIZATIONS
                    5.3.5.1 North America
                               5.3.5.1.1 US
                    5.3.5.2 Europe
                    5.3.5.3 Asia Pacific
                               5.3.5.3.1 India
                               5.3.5.3.2 China
                    5.3.5.4 Middle East & Africa
                               5.3.5.4.1 UAE
                    5.3.5.5 Latin America
                               5.3.5.5.1 Brazil
                               5.3.5.5.2 Mexico
           5.3.6 PORTER’S FIVE FORCES ANALYSIS
                    TABLE 5 PORTER’S FIVE FORCES IMPACT ON MOBILE THREAT DEFENSE MARKET
                    FIGURE 22 MARKET: PORTER’S FIVE FORCES MODEL
                    5.3.6.1 Threat of new entrants
                    5.3.6.2 Threat of substitutes
                    5.3.6.3 Bargaining power of buyers
                    5.3.6.4 Bargaining power of suppliers
                    5.3.6.5 Intensity of competitive rivalry
           5.3.7 TRENDS AND DISRUPTIONS IMPACTING CUSTOMER’S BUSINESS
                    FIGURE 23 TRENDS AND DISRUPTIONS IMPACTING CUSTOMER’S BUSINESS
           5.3.8 MOBILE THREAT DEFENSE TOOLS, FRAMEWORKS, AND TECHNIQUES
           5.3.9 PRICING ANALYSIS
                    5.3.9.1 Average selling price trend of key players, by mobile threat defense solution
                               FIGURE 24 AVERAGE SELLING PRICE TREND OF KEY PLAYERS MARKET FOR TOP 3 MOBILE THREAT DEFENSE SOLUTIONS
                               TABLE 6 AVERAGE SELLING PRICES OF KEY PLAYERS, BY SOLUTION
                    5.3.9.2 Indicative pricing analysis of mobile threat defense offerings
                               TABLE 7 INDICATIVE PRICING LEVELS OF MOBILE THREAT DEFENSE OFFERINGS
           5.3.10 PATENT ANALYSIS
                    5.3.10.1 Methodology
                               FIGURE 25 LIST OF MAJOR PATENTS FOR MOBILE THREAT DEFENSE
                               TABLE 8 LIST OF MAJOR PATENTS
           5.3.11 KEY STAKEHOLDERS & BUYING CRITERIA
                    5.3.11.1 Key stakeholders in buying criteria
                               FIGURE 26 INFLUENCE OF STAKEHOLDERS ON BUYING PROCESS FOR TOP THREE VERTICALS
                               TABLE 9 INFLUENCE OF STAKEHOLDERS ON BUYING PROCESS FOR TOP THREE VERTICALS
                    5.3.11.2 Buying criteria
                               FIGURE 27 KEY BUYING CRITERIA FOR TOP THREE VERTICALS
                               TABLE 10 KEY BUYING CRITERIA FOR TOP THREE VERTICALS
           5.3.12 KEY CONFERENCES & EVENTS, 2023–2024
                    TABLE 11 DETAILED LIST OF CONFERENCES & EVENTS, 2023–2024
           5.3.13 BEST PRACTICES IN MOBILE THREAT DEFENSE MARKET
                    5.3.13.1 Choose comprehensive MTD solution
                    5.3.13.2 Integrate MTD with existing security solutions
                    5.3.13.3 Keep MTD solution up to date
           5.3.14 CURRENT AND EMERGING BUSINESS MODELS
                    5.3.14.1 On-premises MTD model
                    5.3.14.2 Cloud-based MTD model
                    5.3.14.3 Subscription-based model
           5.3.15 TECHNOLOGY ANALYSIS
                    5.3.15.1 Key technologies
                               5.3.15.1.1 Artificial Intelligence (AI) and Machine Learning (ML)
                               5.3.15.1.2 Zero Trust Security in Mobile Threat Defense
                               5.3.15.1.3 Mobile Application Management (MAM)
                               5.3.15.1.4 Mobile Device Management (MDM)
                    5.3.15.2 Adjacent technologies
                               5.3.15.2.1 Identity and Access Management (IAM)
                               5.3.15.2.2 Endpoint Detection and Response (EDR)
                               5.3.15.2.3 Unified Endpoint Management (UEM)
                               5.3.15.2.4 Cloud Access Security Broker (CASB)
           5.3.16 FUTURE LANDSCAPE OF MOBILE THREAT DEFENSE MARKET
                    5.3.16.1 Mobile threat defense technology roadmap till 2030
                               5.3.16.1.1 Short-term roadmap (2023–2025)
                               5.3.16.1.2 Mid-term roadmap (2026–2028)
                               5.3.16.1.3 Long-term roadmap (2029–2030)
 
6 MOBILE THREAT DEFENSE MARKET, BY OFFERING (Page No. - 93)
    6.1 INTRODUCTION 
           FIGURE 28 SERVICES SEGMENT TO GROW AT HIGHER CAGR DURING FORECAST PERIOD
           6.1.1 OFFERING: MARKET DRIVERS
                    TABLE 12 MARKET, BY OFFERING, 2018–2022 (USD MILLION)
                    TABLE 13 MARKET, BY OFFERING, 2023–2028 (USD MILLION)
    6.2 SOLUTIONS 
           6.2.1 MTD SOLUTION TO SAFEGUARD ORGANIZATIONS AND INDIVIDUAL USERS FROM SECURITY THREATS
                    TABLE 14 SOLUTIONS: MARKET, BY REGION, 2018–2022 (USD MILLION)
                    TABLE 15 SOLUTIONS: MARKET, BY REGION, 2023–2028 (USD MILLION)
    6.3 SERVICES 
           6.3.1 MTD SERVICES TO PROVIDE FLEXIBLE AND INTEGRATED SOLUTIONS PRIORITIZING REAL-TIME THREAT DETECTION, COMPLIANCE ADHERENCE, AND USER AWARENESS
                    TABLE 16 MARKET, BY SERVICE, 2018–2022 (USD MILLION)
                    TABLE 17 MARKET, BY SERVICE, 2023–2028 (USD MILLION)
                    TABLE 18 SERVICES: MARKET, BY REGION, 2018–2022 (USD MILLION)
                    TABLE 19 SERVICES: MARKET, BY REGION, 2023–2028 (USD MILLION)
           6.3.2 PROFESSIONAL SERVICES
                    TABLE 20 PROFESSIONAL SERVICES: MARKET, BY REGION,  2018–2022 (USD MILLION)
                    TABLE 21 PROFESSIONAL SERVICES: MARKET, BY REGION,  2023–2028 (USD MILLION)
           6.3.3 MANAGED SERVICES
                    TABLE 22 MANAGED SERVICES: MARKET, BY REGION,  2018–2022 (USD MILLION)
                    TABLE 23 MANAGED SERVICES: MARKET, BY REGION,  2023–2028 (USD MILLION)
 
7 MOBILE THREAT DEFENSE MARKET, BY OPERATING SYSTEM (Page No. - 99)
    7.1 INTRODUCTION 
           FIGURE 29 ANDROID SEGMENT TO DOMINATE MARKET DURING FORECAST PERIOD
           7.1.1 OPERATING SYSTEM: MARKET DRIVERS
                    TABLE 24 MARKET, BY OPERATING SYSTEM, 2018–2022 (USD MILLION)
                    TABLE 25 MARKET, BY OPERATING SYSTEM, 2023–2028 (USD MILLION)
    7.2 IOS 
           7.2.1 MTD IN IOS TO COUNTERACT SECURITY THREATS, PREVENT DATA LEAKAGE, AND ENSURE ADHERENCE TO DATA PRIVACY REGULATIONS
                    TABLE 26 IOS: MARKET, BY REGION, 2018–2022 (USD MILLION)
                    TABLE 27 IOS: MARKET, BY REGION, 2023–2028 (USD MILLION)
    7.3 ANDROID 
           7.3.1 MTD FOR ANDROID TO OFFER BEHAVIOR-BASED ANALYSIS USING AI AND ML ENABLING DETECTION OF SOPHISTICATED THREATS
                    TABLE 28 ANDROID: MARKET, BY REGION, 2018–2022 (USD MILLION)
                    TABLE 29 ANDROID: MARKET, BY REGION, 2023–2028 (USD MILLION)
    7.4 OTHER OPERATING SYSTEMS 
           TABLE 30 OTHER OPERATING SYSTEMS: MARKET, BY REGION,  2018–2022 (USD MILLION)
           TABLE 31 OTHER OPERATING SYSTEMS: MARKET, BY REGION,  2023–2028 (USD MILLION)
 
8 MOBILE THREAT DEFENSE MARKET, BY DEPLOYMENT MODE (Page No. - 104)
    8.1 INTRODUCTION 
           FIGURE 30 CLOUD SEGMENT TO GROW AT HIGHER CAGR DURING FORECAST PERIOD
           8.1.1 DEPLOYMENT MODE: MARKET DRIVERS
                    TABLE 32 MARKET, BY DEPLOYMENT MODE, 2018–2022 (USD MILLION)
                    TABLE 33 MARKET, BY DEPLOYMENT MODE, 2023–2028 (USD MILLION)
    8.2 ON-PREMISES 
           8.2.1 ON-PREMISES DEPLOYMENT MODE TO OFFER GREATER CONTROL AND CUSTOMIZATION OVER MOBILE DEVICE SECURITY AND SENSITIVE DATA
                    TABLE 34 ON-PREMISES: MARKET, BY REGION,  2018–2022 (USD MILLION)
                    TABLE 35 ON-PREMISES: MARKET, BY REGION,  2023–2028 (USD MILLION)
    8.3 CLOUD 
           8.3.1 CLOUD DEPLOYMENT TO OFFER EASY CONFIGURATION, UPDATE, AND ENFORCEMENT OF SECURITY POLICIES WITHOUT COMPLEX ON-PREMISES INFRASTRUCTURE
                    TABLE 36 CLOUD: MARKET, BY REGION, 2018–2022 (USD MILLION)
                    TABLE 37 CLOUD: MARKET, BY REGION, 2023–2028 (USD MILLION)
 
9 MOBILE THREAT DEFENSE MARKET, BY ORGANIZATION SIZE (Page No. - 109)
    9.1 INTRODUCTION 
           FIGURE 31 LARGE ENTERPRISES SEGMENT TO DOMINATE DURING FORECAST PERIOD
           9.1.1 ORGANIZATION SIZE: MARKET DRIVERS
                    TABLE 38 MARKET, BY ORGANIZATION SIZE, 2018–2022 (USD MILLION)
                    TABLE 39 MARKET, BY ORGANIZATION SIZE, 2023–2028 (USD MILLION)
    9.2 LARGE ENTERPRISES 
           9.2.1 INCREASING ADOPTION OF MTD SOLUTIONS TO SAFEGUARD DATA IN LARGE ENTERPRISES
                    TABLE 40 LARGE ENTERPRISES: MARKET, BY REGION,  2018–2022 (USD MILLION)
                    TABLE 41 LARGE ENTERPRISES: MARKET, BY REGION,  2023–2028 (USD MILLION)
    9.3 SMALL AND MEDIUM-SIZED ENTERPRISES 
           9.3.1 SMES TO INCREASINGLY INVEST IN MOBILE THREAT DETECTION TOOLS TO IDENTIFY AND MITIGATE SECURITY RISKS
                    TABLE 42 SMALL AND MEDIUM-SIZED ENTERPRISES: MARKET,  BY REGION, 2018–2022 (USD MILLION)
                    TABLE 43 SMALL AND MEDIUM-SIZED ENTERPRISES: MARKET,  BY REGION, 2023–2028 (USD MILLION)
 
10 MOBILE THREAT DEFENSE MARKET, BY THREAT TYPE (Page No. - 114)
     10.1 INTRODUCTION 
               FIGURE 32 RANSOMWARE SEGMENT TO GROW AT HIGHEST CAGR DURING FORECAST PERIOD
             10.1.1 THREAT TYPE: MARKET DRIVERS
                       TABLE 44 MARKET, BY THREAT TYPE, 2018–2022 (USD MILLION)
                       TABLE 45 MARKET, BY THREAT TYPE, 2023–2028 (USD MILLION)
     10.2 PHISHING 
             10.2.1 MTD TO LEVERAGE ADVANCED ALGORITHMS AND MACHINE LEARNING TO COUNTER INCREASING PHISHING ATTACKS
                       TABLE 46 PHISHING: MARKET, BY REGION, 2018–2022 (USD MILLION)
                       TABLE 47 PHISHING: MARKET, BY REGION, 2023–2028 (USD MILLION)
     10.3 RANSOMWARE 
             10.3.1 MTD TO MONITOR FILE BEHAVIOR, SYSTEM ACCESS, AND NETWORK ACTIVITY TO IDENTIFY RANSOMWARE
                       TABLE 48 RANSOMWARE: MARKET, BY REGION,  2018–2022 (USD MILLION)
                       TABLE 49 RANSOMWARE: MOBILE THREAT DEFENSE MARKET, BY REGION,  2023–2028 (USD MILLION)
     10.4 MALWARE 
             10.4.1 MTD FOR MALWARE THREATS TO MONITOR DEVICE BEHAVIOR, NETWORK TRAFFIC, AND APPLICATION ACTIVITY
                       TABLE 50 MALWARE: MARKET, BY REGION, 2018–2022 (USD MILLION)
                       TABLE 51 MALWARE: MARKET, BY REGION, 2023–2028 (USD MILLION)
     10.5 DDOS 
             10.5.1 MTD TO EMPLOY ADVANCED TRAFFIC MONITORING AND ANALYSIS TO DETECT POTENTIAL DDOS ATTACKS
                       TABLE 52 DDOS: MARKET, BY REGION, 2018–2022 (USD MILLION)
                       TABLE 53 DDOS: MARKET, BY REGION, 2023–2028 (USD MILLION)
     10.6 APT 
             10.6.1 MTD TO DEPLOY ADVANCED THREAT DETECTION TECHNIQUES AND CONTINUOUS MONITORING FOR APT THREAT DETECTION
                       TABLE 54 APT: MARKET, BY REGION, 2018–2022 (USD MILLION)
                       TABLE 55 APT: MARKET, BY REGION, 2023–2028 (USD MILLION)
     10.7 OTHER THREAT TYPES 
               TABLE 56 OTHER THREAT TYPES: MARKET, BY REGION,  2018–2022 (USD MILLION)
               TABLE 57 OTHER THREAT TYPES: MARKET, BY REGION,  2023–2028 (USD MILLION)
 
11 MOBILE THREAT DEFENSE MARKET, BY VERTICAL (Page No. - 123)
     11.1 INTRODUCTION 
               FIGURE 33 RETAIL & ECOMMERCE SEGMENT TO GROW AT HIGHEST CAGR DURING FORECAST PERIOD
             11.1.1 VERTICAL: MARKET DRIVERS
                       TABLE 58 MARKET, BY VERTICAL, 2018–2022 (USD MILLION)
                       TABLE 59 MARKET, BY VERTICAL, 2023–2028 (USD MILLION)
     11.2 BANKING, FINANCIAL SERVICES, AND INSURANCE 
             11.2.1 MTD SOLUTIONS TO SAFEGUARD MOBILE DEVICES AND PROTECT SENSITIVE CUSTOMER INFORMATION
                       TABLE 60 BANKING, FINANCIAL SERVICES, AND INSURANCE: MARKET, BY REGION, 2018–2022 (USD MILLION)
                       TABLE 61 BANKING, FINANCIAL SERVICES, AND INSURANCE: MARKET, BY REGION, 2023–2028 (USD MILLION)
     11.3 IT & TELECOM 
             11.3.1 MTD SOLUTIONS TO OFFER REAL-TIME THREAT DETECTION AND MITIGATION AND SAFEGUARD AGAINST MALWARE, PHISHING ATTACKS, AND NETWORK VULNERABILITIES
                       TABLE 62 IT & TELECOM: MARKET, BY REGION,  2018–2022 (USD MILLION)
                       TABLE 63 IT & TELECOM: MARKET, BY REGION,  2023–2028 (USD MILLION)
     11.4 RETAIL & ECOMMERCE 
             11.4.1 MTD TO OFFER REAL-TIME THREAT DETECTION AND MITIGATION CAPABILITIES TO SAFEGUARD AGAINST THREATS
                       TABLE 64 RETAIL & ECOMMERCE: MOBILE THREAT DEFENSE MARKET, BY REGION,  2018–2022 (USD MILLION)
                       TABLE 65 RETAIL & ECOMMERCE: MARKET, BY REGION,  2023–2028 (USD MILLION)
     11.5 HEALTHCARE & LIFE SCIENCES 
             11.5.1 MTD TO SECURE BOTH EMPLOYEE DEVICES AND PATIENT-RELATED APPLICATIONS
                       TABLE 66 HEALTHCARE & LIFE SCIENCES: MARKET, BY REGION,  2018–2022 (USD MILLION)
                       TABLE 67 HEALTHCARE & LIFE SCIENCES: MARKET, BY REGION,  2023–2028 (USD MILLION)
     11.6 GOVERNMENT & DEFENSE 
             11.6.1 MTD TO ENSURE CONFIDENTIALITY AND SECURITY OF DATA
                       TABLE 68 GOVERNMENT & DEFENSE: MARKET, BY REGION,  2018–2022 (USD MILLION)
                       TABLE 69 GOVERNMENT & DEFENSE: MARKET, BY REGION,  2023–2028 (USD MILLION)
     11.7 MANUFACTURING 
             11.7.1 MTD TO ENSURE MOBILE DEVICE SECURITY IN MANUFACTURING OPERATIONS
                       TABLE 70 MANUFACTURING: MARKET, BY REGION,  2018–2022 (USD MILLION)
                       TABLE 71 MANUFACTURING: MARKET, BY REGION,  2023–2028 (USD MILLION)
     11.8 OTHER VERTICALS 
               TABLE 72 OTHER VERTICALS: MARKET, BY REGION,  2018–2022 (USD MILLION)
               TABLE 73 OTHER VERTICALS: MARKET, BY REGION,  2023–2028 (USD MILLION)
 
12 MOBILE THREAT DEFENSE MARKET, BY REGION (Page No. - 133)
     12.1 INTRODUCTION 
               FIGURE 34 ASIA PACIFIC TO GROW AT HIGHEST CAGR DURING FORECAST PERIOD
               TABLE 74 MARKET, BY REGION, 2018–2022 (USD MILLION)
               TABLE 75 MARKET, BY REGION, 2023–2028 (USD MILLION)
     12.2 NORTH AMERICA 
             12.2.1 NORTH AMERICA: RECESSION IMPACT
             12.2.2 NORTH AMERICA: MARKET DRIVERS
                       FIGURE 35 NORTH AMERICA: MARKET SNAPSHOT
                       TABLE 76 NORTH AMERICA: MOBILE THREAT DEFENSE MARKET, BY OFFERING,  2018–2022 (USD MILLION)
                       TABLE 77 NORTH AMERICA: MARKET, BY OFFERING,  2023–2028 (USD MILLION)
                       TABLE 78 NORTH AMERICA: MARKET, BY SERVICE,  2018–2022 (USD MILLION)
                       TABLE 79 NORTH AMERICA: MARKET, BY SERVICE,  2023–2028 (USD MILLION)
                       TABLE 80 NORTH AMERICA: MARKET, BY DEPLOYMENT MODE,  2018–2022 (USD MILLION)
                       TABLE 81 NORTH AMERICA: MARKET, BY DEPLOYMENT MODE,  2023–2028 (USD MILLION)
                       TABLE 82 NORTH AMERICA: MARKET, BY ORGANIZATION SIZE,  2018–2022 (USD MILLION)
                       TABLE 83 NORTH AMERICA: MARKET, BY ORGANIZATION SIZE,  2023–2028 (USD MILLION)
                       TABLE 84 NORTH AMERICA: MARKET, BY OPERATING SYSTEM,  2018–2022 (USD MILLION)
                       TABLE 85 NORTH AMERICA: MARKET, BY OPERATING SYSTEM,  2023–2028 (USD MILLION)
                       TABLE 86 NORTH AMERICA: MARKET, BY VERTICAL,  2018–2022 (USD MILLION)
                       TABLE 87 NORTH AMERICA: MARKET, BY VERTICAL,  2023–2028 (USD MILLION)
                       TABLE 88 NORTH AMERICA: MARKET, BY THREAT TYPE,  2018–2022 (USD MILLION)
                       TABLE 89 NORTH AMERICA: MARKET, BY THREAT TYPE,  2023–2028 (USD MILLION)
                       TABLE 90 NORTH AMERICA: MARKET, BY COUNTRY,  2018–2022 (USD MILLION)
                       TABLE 91 NORTH AMERICA: MARKET, BY COUNTRY,  2023–2028 (USD MILLION)
             12.2.3 US
                       12.2.3.1 Tech-reliant population, pervasive mobile device usage, and regulatory compliance to fuel demand for MTD solutions
                                   TABLE 92 US: MOBILE THREAT DEFENSE MARKET, BY OFFERING, 2018–2022 (USD MILLION)
                                   TABLE 93 US: MARKET, BY OFFERING, 2023–2028 (USD MILLION)
                                   TABLE 94 US: MARKET, BY SERVICE, 2018–2022 (USD MILLION)
                                   TABLE 95 US: MARKET, BY SERVICE, 2023–2028 (USD MILLION)
                                   TABLE 96 US: MARKET, BY DEPLOYMENT MODE,  2018–2022 (USD MILLION)
                                   TABLE 97 US: MARKET, BY DEPLOYMENT MODE,  2023–2028 (USD MILLION)
                                   TABLE 98 US: MARKET, BY ORGANIZATION SIZE,  2018–2022 (USD MILLION)
                                   TABLE 99 US: MARKET, BY ORGANIZATION SIZE,  2023–2028 (USD MILLION)
                                   TABLE 100 US: MARKET, BY OPERATING SYSTEM,  2018–2022 (USD MILLION)
                                   TABLE 101 US: MARKET, BY OPERATING SYSTEM,  2023–2028 (USD MILLION)
                                   TABLE 102 US: MARKET, BY VERTICAL, 2018–2022 (USD MILLION)
                                   TABLE 103 US: MARKET, BY VERTICAL, 2023–2028 (USD MILLION)
                                   TABLE 104 US: MARKET, BY THREAT TYPE, 2018–2022 (USD MILLION)
                                   TABLE 105 US: MARKET, BY THREAT TYPE, 2023–2028 (USD MILLION)
             12.2.4 CANADA
                       12.2.4.1 Rising mobile threat awareness and maintenance of regulatory compliance to drive market
                                   TABLE 106 CANADA: MOBILE THREAT DEFENSE MARKET, BY OFFERING, 2018–2022 (USD MILLION)
                                   TABLE 107 CANADA: MARKET, BY OFFERING, 2023–2028 (USD MILLION)
                                   TABLE 108 CANADA: MARKET, BY SERVICE, 2018–2022 (USD MILLION)
                                   TABLE 109 CANADA: MARKET, BY SERVICE, 2023–2028 (USD MILLION)
                                   TABLE 110 CANADA: MARKET, BY DEPLOYMENT MODE,  2018–2022 (USD MILLION)
                                   TABLE 111 CANADA: MARKET, BY DEPLOYMENT MODE,  2023–2028 (USD MILLION)
                                   TABLE 112 CANADA: MARKET, BY ORGANIZATION SIZE,  2018–2022 (USD MILLION)
                                   TABLE 113 CANADA: MARKET, BY ORGANIZATION SIZE,  2023–2028 (USD MILLION)
                                   TABLE 114 CANADA: MARKET, BY OPERATING SYSTEM,  2018–2022 (USD MILLION)
                                   TABLE 115 CANADA: MARKET, BY OPERATING SYSTEM,  2023–2028 (USD MILLION)
                                   TABLE 116 CANADA: MARKET, BY VERTICAL, 2018–2022 (USD MILLION)
                                   TABLE 117 CANADA: MARKET, BY VERTICAL, 2023–2028 (USD MILLION)
                                   TABLE 118 CANADA: MARKET, BY THREAT TYPE,  2018–2022 (USD MILLION)
                                   TABLE 119 CANADA: MARKET, BY THREAT TYPE,  2023–2028 (USD MILLION)
     12.3 EUROPE 
             12.3.1 EUROPE: RECESSION IMPACT
             12.3.2 EUROPE: MARKET DRIVERS
                       TABLE 120 EUROPE: MOBILE THREAT DEFENSE MARKET, BY OFFERING, 2018–2022 (USD MILLION)
                       TABLE 121 EUROPE: MARKET, BY OFFERING, 2023–2028 (USD MILLION)
                       TABLE 122 EUROPE: MARKET, BY SERVICE, 2018–2022 (USD MILLION)
                       TABLE 123 EUROPE: MARKET, BY SERVICE, 2023–2028 (USD MILLION)
                       TABLE 124 EUROPE: MARKET, BY DEPLOYMENT MODE,  2018–2022 (USD MILLION)
                       TABLE 125 EUROPE: MARKET, BY DEPLOYMENT MODE,  2023–2028 (USD MILLION)
                       TABLE 126 EUROPE: MARKET, BY ORGANIZATION SIZE,  2018–2022 (USD MILLION)
                       TABLE 127 EUROPE: MARKET, BY ORGANIZATION SIZE,  2023–2028 (USD MILLION)
                       TABLE 128 EUROPE: MARKET, BY OPERATING SYSTEM,  2018–2022 (USD MILLION)
                       TABLE 129 EUROPE: MARKET, BY OPERATING SYSTEM,  2023–2028 (USD MILLION)
                       TABLE 130 EUROPE: MARKET, BY VERTICAL, 2018–2022 (USD MILLION)
                       TABLE 131 EUROPE: MARKET, BY VERTICAL, 2023–2028 (USD MILLION)
                       TABLE 132 EUROPE: MARKET, BY THREAT TYPE,  2018–2022 (USD MILLION)
                       TABLE 133 EUROPE: MARKET, BY THREAT TYPE,  2023–2028 (USD MILLION)
                       TABLE 134 EUROPE: MARKET, BY COUNTRY, 2018–2022 (USD MILLION)
                       TABLE 135 EUROPE: MARKET, BY COUNTRY, 2023–2028 (USD MILLION)
             12.3.3 UK
                       12.3.3.1 Strong focus on cyber resilience and vigilance to fuel demand for MTD solutions
                                   TABLE 136 UK: MOBILE THREAT DEFENSE MARKET, BY OFFERING, 2018–2022 (USD MILLION)
                                   TABLE 137 UK: MARKET, BY OFFERING, 2023–2028 (USD MILLION)
                                   TABLE 138 UK: MARKET, BY SERVICE, 2018–2022 (USD MILLION)
                                   TABLE 139 UK: MARKET, BY SERVICE, 2023–2028 (USD MILLION)
                                   TABLE 140 UK: MARKET, BY DEPLOYMENT MODE,  2018–2022 (USD MILLION)
                                   TABLE 141 UK: MARKET, BY DEPLOYMENT MODE,  2023–2028 (USD MILLION)
                                   TABLE 142 UK: MARKET, BY ORGANIZATION SIZE,  2018–2022 (USD MILLION)
                                   TABLE 143 UK: MARKET, BY ORGANIZATION SIZE,  2023–2028 (USD MILLION)
                                   TABLE 144 UK: MARKET, BY OPERATING SYSTEM,  2018–2022 (USD MILLION)
                                   TABLE 145 UK: MARKET, BY OPERATING SYSTEM,  2023–2028 (USD MILLION)
                                   TABLE 146 UK: MARKET, BY VERTICAL, 2018–2022 (USD MILLION)
                                   TABLE 147 UK: MARKET, BY VERTICAL, 2023–2028 (USD MILLION)
                                   TABLE 148 UK: MARKET, BY THREAT TYPE, 2018–2022 (USD MILLION)
                                   TABLE 149 UK: MARKET, BY THREAT TYPE, 2023–2028 (USD MILLION)
             12.3.4 GERMANY
                       12.3.4.1 Robust business sector and tech-reliant workforce leading to mobile security to drive market
                                   TABLE 150 GERMANY: MOBILE THREAT DEFENSE MARKET, BY OFFERING,  2018–2022 (USD MILLION)
                                   TABLE 151 GERMANY: MARKET, BY OFFERING,  2023–2028 (USD MILLION)
                                   TABLE 152 GERMANY: MARKET, BY SERVICE, 2018–2022 (USD MILLION)
                                   TABLE 153 GERMANY: MARKET, BY SERVICE, 2023–2028 (USD MILLION)
                                   TABLE 154 GERMANY: MARKET, BY DEPLOYMENT MODE,  2018–2022 (USD MILLION)
                                   TABLE 155 GERMANY: MARKET, BY DEPLOYMENT MODE,  2023–2028 (USD MILLION)
                                   TABLE 156 GERMANY: MARKET, BY ORGANIZATION SIZE,  2018–2022 (USD MILLION)
                                   TABLE 157 GERMANY: MARKET, BY ORGANIZATION SIZE,  2023–2028 (USD MILLION)
                                   TABLE 158 GERMANY: MARKET, BY OPERATING SYSTEM,  2018–2022 (USD MILLION)
                                   TABLE 159 GERMANY: MARKET, BY OPERATING SYSTEM,  2023–2028 (USD MILLION)
                                   TABLE 160 GERMANY: MARKET, BY VERTICAL, 2018–2022 (USD MILLION)
                                   TABLE 161 GERMANY: MARKET, BY VERTICAL,  2023–2028 (USD MILLION)
                                   TABLE 162 GERMANY: MARKET, BY THREAT TYPE,  2018–2022 (USD MILLION)
                                   TABLE 163 GERMANY: MARKET, BY THREAT TYPE,  2023–2028 (USD MILLION)
             12.3.5 FRANCE
                       12.3.5.1 Increasing dependency on mobile devices and need for data protection to drive market
                                   TABLE 164 FRANCE: MOBILE THREAT DEFENSE MARKET, BY OFFERING, 2018–2022 (USD MILLION)
                                   TABLE 165 FRANCE: MARKET, BY OFFERING, 2023–2028 (USD MILLION)
                                   TABLE 166 FRANCE: MARKET, BY SERVICE, 2018–2022 (USD MILLION)
                                   TABLE 167 FRANCE: MARKET, BY SERVICE, 2023–2028 (USD MILLION)
                                   TABLE 168 FRANCE: MARKET, BY DEPLOYMENT MODE,  2018–2022 (USD MILLION)
                                   TABLE 169 FRANCE: MARKET, BY DEPLOYMENT MODE,  2023–2028 (USD MILLION)
                                   TABLE 170 FRANCE: MARKET, BY ORGANIZATION SIZE,  2018–2022 (USD MILLION)
                                   TABLE 171 FRANCE: MARKET, BY ORGANIZATION SIZE,  2023–2028 (USD MILLION)
                                   TABLE 172 FRANCE: MARKET, BY OPERATING SYSTEM,  2018–2022 (USD MILLION)
                                   TABLE 173 FRANCE: MARKET, BY OPERATING SYSTEM,  2023–2028 (USD MILLION)
                                   TABLE 174 FRANCE: MARKET, BY VERTICAL, 2018–2022 (USD MILLION)
                                   TABLE 175 FRANCE: MARKET, BY VERTICAL, 2023–2028 (USD MILLION)
                                   TABLE 176 FRANCE: MARKET, BY THREAT TYPE,  2018–2022 (USD MILLION)
                                   TABLE 177 FRANCE: MARKET, BY THREAT TYPE,  2023–2028 (USD MILLION)
             12.3.6 REST OF EUROPE
     12.4 ASIA PACIFIC 
             12.4.1 ASIA PACIFIC: RECESSION IMPACT
             12.4.2 ASIA PACIFIC: MARKET DRIVERS
                       FIGURE 36 ASIA PACIFIC: MARKET SNAPSHOT
                       TABLE 178 ASIA PACIFIC: MOBILE THREAT DEFENSE MARKET, BY OFFERING,  2018–2022 (USD MILLION)
                       TABLE 179 ASIA PACIFIC: MARKET, BY OFFERING,  2023–2028 (USD MILLION)
                       TABLE 180 ASIA PACIFIC: MARKET, BY SERVICE,  2018–2022 (USD MILLION)
                       TABLE 181 ASIA PACIFIC: MARKET, BY SERVICE,  2023–2028 (USD MILLION)
                       TABLE 182 ASIA PACIFIC: MARKET, BY DEPLOYMENT MODE,  2018–2022 (USD MILLION)
                       TABLE 183 ASIA PACIFIC: MARKET, BY DEPLOYMENT MODE,  2023–2028 (USD MILLION)
                       TABLE 184 ASIA PACIFIC: MARKET, BY ORGANIZATION SIZE,  2018–2022 (USD MILLION)
                       TABLE 185 ASIA PACIFIC: MARKET, BY ORGANIZATION SIZE,  2023–2028 (USD MILLION)
                       TABLE 186 ASIA PACIFIC: MARKET, BY OPERATING SYSTEM,  2018–2022 (USD MILLION)
                       TABLE 187 ASIA PACIFIC: MARKET, BY OPERATING SYSTEM,  2023–2028 (USD MILLION)
                       TABLE 188 ASIA PACIFIC: MARKET, BY VERTICAL,  2018–2022 (USD MILLION)
                       TABLE 189 ASIA PACIFIC: MARKET, BY VERTICAL,  2023–2028 (USD MILLION)
                       TABLE 190 ASIA PACIFIC: MARKET, BY THREAT TYPE,  2018–2022 (USD MILLION)
                       TABLE 191 ASIA PACIFIC: MARKET, BY THREAT TYPE,  2023–2028 (USD MILLION)
                       TABLE 192 ASIA PACIFIC: MARKET, BY COUNTRY,  2018–2022 (USD MILLION)
                       TABLE 193 ASIA PACIFIC: MARKET, BY COUNTRY,  2023–2028 (USD MILLION)
             12.4.3 CHINA
                       12.4.3.1 Need for robust security measures to safeguard sensitive data from evolving cyber threats to drive market
                                   TABLE 194 CHINA: MOBILE THREAT DEFENSE MARKET, BY OFFERING, 2018–2022 (USD MILLION)
                                   TABLE 195 CHINA: MARKET, BY OFFERING, 2023–2028 (USD MILLION)
                                   TABLE 196 CHINA: MARKET, BY SERVICE, 2018–2022 (USD MILLION)
                                   TABLE 197 CHINA: MARKET, BY SERVICE, 2023–2028 (USD MILLION)
                                   TABLE 198 CHINA: MARKET, BY DEPLOYMENT MODE,  2018–2022 (USD MILLION)
                                   TABLE 199 CHINA: MARKET, BY DEPLOYMENT MODE,  2023–2028 (USD MILLION)
                                   TABLE 200 CHINA: MARKET, BY ORGANIZATION SIZE,  2018–2022 (USD MILLION)
                                   TABLE 201 CHINA: MARKET, BY ORGANIZATION SIZE,  2023–2028 (USD MILLION)
                                   TABLE 202 CHINA: MARKET, BY OPERATING SYSTEM,  2018–2022 (USD MILLION)
                                   TABLE 203 CHINA: MARKET, BY OPERATING SYSTEM,  2023–2028 (USD MILLION)
                                   TABLE 204 CHINA: MARKET, BY VERTICAL, 2018–2022 (USD MILLION)
                                   TABLE 205 CHINA: MARKET, BY VERTICAL, 2023–2028 (USD MILLION)
                                   TABLE 206 CHINA: MARKET, BY THREAT TYPE, 2018–2022 (USD MILLION)
                                   TABLE 207 CHINA: MARKET, BY THREAT TYPE, 2023–2028 (USD MILLION)
             12.4.4 JAPAN
                       12.4.4.1 Need for protecting sensitive data and preventing advanced mobile threats to fuel demand for MTD solutions
                                   TABLE 208 JAPAN: MOBILE THREAT DEFENSE MARKET, BY OFFERING, 2018–2022 (USD MILLION)
                                   TABLE 209 JAPAN: MARKET, BY OFFERING, 2023–2028 (USD MILLION)
                                   TABLE 210 JAPAN: MARKET, BY SERVICE, 2018–2022 (USD MILLION)
                                   TABLE 211 JAPAN: MARKET, BY SERVICE, 2023–2028 (USD MILLION)
                                   TABLE 212 JAPAN: MARKET, BY DEPLOYMENT MODE,  2018–2022 (USD MILLION)
                                   TABLE 213 JAPAN: MARKET, BY DEPLOYMENT MODE,  2023–2028 (USD MILLION)
                                   TABLE 214 JAPAN: MARKET, BY ORGANIZATION SIZE,  2018–2022 (USD MILLION)
                                   TABLE 215 JAPAN: MARKET, BY ORGANIZATION SIZE,  2023–2028 (USD MILLION)
                                   TABLE 216 JAPAN: MARKET, BY OPERATING SYSTEM,  2018–2022 (USD MILLION)
                                   TABLE 217 JAPAN: MARKET, BY OPERATING SYSTEM,  2023–2028 (USD MILLION)
                                   TABLE 218 JAPAN: MARKET, BY VERTICAL, 2018–2022 (USD MILLION)
                                   TABLE 219 JAPAN: MARKET, BY VERTICAL, 2023–2028 (USD MILLION)
                                   TABLE 220 JAPAN: MARKET, BY THREAT TYPE, 2018–2022 (USD MILLION)
                                   TABLE 221 JAPAN: MARKET, BY THREAT TYPE, 2023–2028 (USD MILLION)
             12.4.5 INDIA
                       12.4.5.1 Need for threat detection, data protection, and privacy features to boost demand for MTD solutions
                                   TABLE 222 INDIA: MOBILE THREAT DEFENSE MARKET, BY OFFERING, 2018–2022 (USD MILLION)
                                   TABLE 223 INDIA: MARKET, BY OFFERING, 2023–2028 (USD MILLION)
                                   TABLE 224 INDIA: MARKET, BY SERVICE, 2018–2022 (USD MILLION)
                                   TABLE 225 INDIA: MARKET, BY SERVICE, 2023–2028 (USD MILLION)
                                   TABLE 226 INDIA: MARKET, BY DEPLOYMENT MODE,  2018–2022 (USD MILLION)
                                   TABLE 227 INDIA: MARKET, BY DEPLOYMENT MODE,  2023–2028 (USD MILLION)
                                   TABLE 228 INDIA: MARKET, BY ORGANIZATION SIZE,  2018–2022 (USD MILLION)
                                   TABLE 229 INDIA: MARKET, BY ORGANIZATION SIZE,  2023–2028 (USD MILLION)
                                   TABLE 230 INDIA: MARKET, BY OPERATING SYSTEM,  2018–2022 (USD MILLION)
                                   TABLE 231 INDIA: MARKET, BY OPERATING SYSTEM,  2023–2028 (USD MILLION)
                                   TABLE 232 INDIA: MARKET, BY VERTICAL, 2018–2022 (USD MILLION)
                                   TABLE 233 INDIA: MARKET, BY VERTICAL, 2023–2028 (USD MILLION)
                                   TABLE 234 INDIA: MARKET, BY THREAT TYPE, 2018–2022 (USD MILLION)
                                   TABLE 235 INDIA: MARKET, BY THREAT TYPE, 2023–2028 (USD MILLION)
             12.4.6 REST OF ASIA PACIFIC
     12.5 MIDDLE EAST & AFRICA 
             12.5.1 MIDDLE EAST & AFRICA: RECESSION IMPACT
             12.5.2 MIDDLE EAST & AFRICA: MARKET DRIVERS
                       TABLE 236 MIDDLE EAST & AFRICA: MOBILE THREAT DEFENSE MARKET, BY OFFERING,  2018–2022 (USD MILLION)
                       TABLE 237 MIDDLE EAST & AFRICA: MARKET, BY OFFERING,  2023–2028 (USD MILLION)
                       TABLE 238 MIDDLE EAST & AFRICA: MARKET, BY SERVICE,  2018–2022 (USD MILLION)
                       TABLE 239 MIDDLE EAST & AFRICA: MARKET, BY SERVICE,  2023–2028 (USD MILLION)
                       TABLE 240 MIDDLE EAST & AFRICA: MARKET, BY DEPLOYMENT MODE, 2018–2022 (USD MILLION)
                       TABLE 241 MIDDLE EAST & AFRICA: MARKET, BY DEPLOYMENT MODE, 2023–2028 (USD MILLION)
                       TABLE 242 MIDDLE EAST & AFRICA: MARKET, BY ORGANIZATION SIZE, 2018–2022 (USD MILLION)
                       TABLE 243 MIDDLE EAST & AFRICA: MARKET, BY ORGANIZATION SIZE, 2023–2028 (USD MILLION)
                       TABLE 244 MIDDLE EAST & AFRICA: MARKET, BY OPERATING SYSTEM, 2018–2022 (USD MILLION)
                       TABLE 245 MIDDLE EAST & AFRICA: MARKET, BY OPERATING SYSTEM, 2023–2028 (USD MILLION)
                       TABLE 246 MIDDLE EAST & AFRICA: MARKET, BY VERTICAL,  2018–2022 (USD MILLION)
                       TABLE 247 MIDDLE EAST & AFRICA: MARKET, BY VERTICAL,  2023–2028 (USD MILLION)
                       TABLE 248 MIDDLE EAST & AFRICA: MARKET, BY THREAT TYPE,  2018–2022 (USD MILLION)
                       TABLE 249 MIDDLE EAST & AFRICA: MARKET, BY THREAT TYPE,  2023–2028 (USD MILLION)
                       TABLE 250 MIDDLE EAST & AFRICA: MARKET, BY COUNTRY,  2018–2022 (USD MILLION)
                       TABLE 251 MIDDLE EAST & AFRICA: MARKET, BY COUNTRY,  2023–2028 (USD MILLION)
             12.5.3 KSA
                       12.5.3.1 Tech-savvy population, technological advancements, and need for robust mobile security measures to drive market
                       TABLE 252 KSA: MOBILE THREAT DEFENSE MARKET, BY OFFERING, 2018–2022 (USD MILLION)
                       TABLE 253 KSA: MARKET, BY OFFERING, 2023–2028 (USD MILLION)
                       TABLE 254 KSA: MARKET, BY SERVICE, 2018–2022 (USD MILLION)
                       TABLE 255 KSA: MARKET, BY SERVICE, 2023–2028 (USD MILLION)
                       TABLE 256 KSA: MARKET, BY DEPLOYMENT MODE,  2018–2022 (USD MILLION)
                       TABLE 257 KSA: MARKET, BY DEPLOYMENT MODE,  2023–2028 (USD MILLION)
                       TABLE 258 KSA: MARKET, BY ORGANIZATION SIZE,  2018–2022 (USD MILLION)
                       TABLE 259 KSA: MARKET, BY ORGANIZATION SIZE,  2023–2028 (USD MILLION)
                       TABLE 260 KSA: MARKET, BY OPERATING SYSTEM,  2018–2022 (USD MILLION)
                       TABLE 261 KSA: MARKET, BY OPERATING SYSTEM,  2023–2028 (USD MILLION)
                       TABLE 262 KSA: MARKET, BY VERTICAL, 2018–2022 (USD MILLION)
                       TABLE 263 KSA: MARKET, BY VERTICAL, 2023–2028 (USD MILLION)
                       TABLE 264 KSA: MARKET, BY THREAT TYPE, 2018–2022 (USD MILLION)
                       TABLE 265 KSA: MARKET, BY THREAT TYPE, 2023–2028 (USD MILLION)
             12.5.4 UAE
                       12.5.4.1 Rapidly advanced technology ecosystem and regulatory framework emphasizing data protection to drive market
                                   TABLE 266 UAE: MOBILE THREAT DEFENSE MARKET, BY OFFERING, 2018–2022 (USD MILLION)
                                   TABLE 267 UAE: MARKET, BY OFFERING, 2023–2028 (USD MILLION)
                                   TABLE 268 UAE: MARKET, BY SERVICE, 2018–2022 (USD MILLION)
                                   TABLE 269 UAE: MARKET, BY SERVICE, 2023–2028 (USD MILLION)
                                   TABLE 270 UAE: MARKET, BY DEPLOYMENT MODE,  2018–2022 (USD MILLION)
                                   TABLE 271 UAE: MARKET, BY DEPLOYMENT MODE,  2023–2028 (USD MILLION)
                                   TABLE 272 UAE: MARKET, BY ORGANIZATION SIZE,  2018–2022 (USD MILLION)
                                   TABLE 273 UAE: MARKET, BY ORGANIZATION SIZE,  2023–2028 (USD MILLION)
                                   TABLE 274 UAE: MARKET, BY OPERATING SYSTEM,  2018–2022 (USD MILLION)
                                   TABLE 275 UAE: MARKET, BY OPERATING SYSTEM,  2023–2028 (USD MILLION)
                                   TABLE 276 UAE: MARKET, BY VERTICAL, 2018–2022 (USD MILLION)
                                   TABLE 277 UAE: MARKET, BY VERTICAL, 2023–2028 (USD MILLION)
                                   TABLE 278 UAE: MARKET, BY THREAT TYPE, 2018–2022 (USD MILLION)
                                   TABLE 279 UAE: MARKET, BY THREAT TYPE, 2023–2028 (USD MILLION)
             12.5.5 SOUTH AFRICA
                       12.5.5.1 Technological awareness and growing focus on mobile security to propel market
                                   TABLE 280 SOUTH AFRICA: MOBILE THREAT DEFENSE MARKET, BY OFFERING,  2018–2022 (USD MILLION)
                                   TABLE 281 SOUTH AFRICA: MARKET, BY OFFERING,  2023–2028 (USD MILLION)
                                   TABLE 282 SOUTH AFRICA: MARKET, BY SERVICE,  2018–2022 (USD MILLION)
                                   TABLE 283 SOUTH AFRICA: MARKET, BY SERVICE,  2023–2028 (USD MILLION)
                                   TABLE 284 SOUTH AFRICA: MARKET, BY DEPLOYMENT MODE,  2018–2022 (USD MILLION)
                                   TABLE 285 SOUTH AFRICA: MARKET, BY DEPLOYMENT MODE,  2023–2028 (USD MILLION)
                                   TABLE 286 SOUTH AFRICA: MARKET, BY ORGANIZATION SIZE,  2018–2022 (USD MILLION)
                                   TABLE 287 SOUTH AFRICA: MARKET, BY ORGANIZATION SIZE,  2023–2028 (USD MILLION)
                                   TABLE 288 SOUTH AFRICA: MARKET, BY OPERATING SYSTEM,  2018–2022 (USD MILLION)
                                   TABLE 289 SOUTH AFRICA: MARKET, BY OPERATING SYSTEM,  2023–2028 (USD MILLION)
                                   TABLE 290 SOUTH AFRICA: MARKET, BY VERTICAL,  2018–2022 (USD MILLION)
                                   TABLE 291 SOUTH AFRICA: MARKET, BY VERTICAL,  2023–2028 (USD MILLION)
                                   TABLE 292 SOUTH AFRICA: MARKET, BY THREAT TYPE,  2018–2022 (USD MILLION)
                                   TABLE 293 SOUTH AFRICA: MARKET, BY THREAT TYPE,  2023–2028 (USD MILLION)
             12.5.6 REST OF MIDDLE EAST & AFRICA
     12.6 LATIN AMERICA 
             12.6.1 LATIN AMERICA: RECESSION IMPACT
             12.6.2 LATIN AMERICA: MARKET DRIVERS
                       TABLE 294 LATIN AMERICA: MOBILE THREAT DEFENSE MARKET, BY OFFERING,  2018–2022 (USD MILLION)
                       TABLE 295 LATIN AMERICA: MARKET, BY OFFERING,  2023–2028 (USD MILLION)
                       TABLE 296 LATIN AMERICA: MARKET, BY SERVICE,  2018–2022 (USD MILLION)
                       TABLE 297 LATIN AMERICA: MARKET, BY SERVICE,  2023–2028 (USD MILLION)
                       TABLE 298 LATIN AMERICA: MARKET, BY DEPLOYMENT MODE,  2018–2022 (USD MILLION)
                       TABLE 299 LATIN AMERICA: MARKET, BY DEPLOYMENT MODE,  2023–2028 (USD MILLION)
                       TABLE 300 LATIN AMERICA: MARKET, BY ORGANIZATION SIZE,  2018–2022 (USD MILLION)
                       TABLE 301 LATIN AMERICA: MARKET, BY ORGANIZATION SIZE,  2023–2028 (USD MILLION)
                       TABLE 302 LATIN AMERICA: MARKET, BY OPERATING SYSTEM,  2018–2022 (USD MILLION)
                       TABLE 303 LATIN AMERICA: MARKET, BY OPERATING SYSTEM,  2023–2028 (USD MILLION)
                       TABLE 304 LATIN AMERICA: MARKET, BY VERTICAL,  2018–2022 (USD MILLION)
                       TABLE 305 LATIN AMERICA: MARKET, BY VERTICAL,  2023–2028 (USD MILLION)
                       TABLE 306 LATIN AMERICA: MARKET, BY THREAT TYPE,  2018–2022 (USD MILLION)
                       TABLE 307 LATIN AMERICA: MARKET, BY THREAT TYPE,  2023–2028 (USD MILLION)
                       TABLE 308 LATIN AMERICA: MARKET, BY COUNTRY,  2018–2022 (USD MILLION)
                       TABLE 309 LATIN AMERICA: MARKET, BY COUNTRY,  2023–2028 (USD MILLION)
             12.6.3 BRAZIL
                       12.6.3.1 Dynamic digital landscape, tech-savvy population, expanding mobile workforce, and regulatory compliance to drive market
                                   TABLE 310 BRAZIL: MOBILE THREAT DEFENSE MARKET, BY OFFERING, 2018–2022 (USD MILLION)
                                   TABLE 311 BRAZIL: MARKET, BY OFFERING, 2023–2028 (USD MILLION)
                                   TABLE 312 BRAZIL: MARKET, BY SERVICE, 2018–2022 (USD MILLION)
                                   TABLE 313 BRAZIL: MARKET, BY SERVICE, 2023–2028 (USD MILLION)
                                   TABLE 314 BRAZIL: MARKET, BY DEPLOYMENT MODE,  2018–2022 (USD MILLION)
                                   TABLE 315 BRAZIL: MARKET, BY DEPLOYMENT MODE,  2023–2028 (USD MILLION)
                                   TABLE 316 BRAZIL: MARKET, BY ORGANIZATION SIZE,  2018–2022 (USD MILLION)
                                   TABLE 317 BRAZIL: MARKET, BY ORGANIZATION SIZE,  2023–2028 (USD MILLION)
                                   TABLE 318 BRAZIL: MARKET, BY OPERATING SYSTEM,  2018–2022 (USD MILLION)
                                   TABLE 319 BRAZIL: MARKET, BY OPERATING SYSTEM,  2023–2028 (USD MILLION)
                                   TABLE 320 BRAZIL: MARKET, BY VERTICAL, 2018–2022 (USD MILLION)
                                   TABLE 321 BRAZIL: MARKET, BY VERTICAL, 2023–2028 (USD MILLION)
                                   TABLE 322 BRAZIL: MARKET, BY THREAT TYPE, 2018–2022 (USD MILLION)
                                   TABLE 323 BRAZIL: MARKET, BY THREAT TYPE,  2023–2028 (USD MILLION)
             12.6.4 MEXICO
                       12.6.4.1 Focus on securing mobile devices and rising mobile workforce to boost demand for MTD solutions
                                   TABLE 324 MEXICO: MOBILE THREAT DEFENSE MARKET, BY OFFERING, 2018–2022 (USD MILLION)
                                   TABLE 325 MEXICO: MARKET, BY OFFERING, 2023–2028 (USD MILLION)
                                   TABLE 326 MEXICO: MARKET, BY SERVICE, 2018–2022 (USD MILLION)
                                   TABLE 327 MEXICO: MARKET, BY SERVICE, 2023–2028 (USD MILLION)
                                   TABLE 328 MEXICO: MARKET, BY DEPLOYMENT MODE,  2018–2022 (USD MILLION)
                                   TABLE 329 MEXICO: MARKET, BY DEPLOYMENT MODE,  2023–2028 (USD MILLION)
                                   TABLE 330 MEXICO: MARKET, BY ORGANIZATION SIZE,  2018–2022 (USD MILLION)
                                   TABLE 331 MEXICO: MARKET, BY ORGANIZATION SIZE,  2023–2028 (USD MILLION)
                                   TABLE 332 MEXICO: MARKET, BY OPERATING SYSTEM,  2018–2022 (USD MILLION)
                                   TABLE 333 MEXICO: MARKET, BY OPERATING SYSTEM,  2023–2028 (USD MILLION)
                                   TABLE 334 MEXICO: MARKET, BY VERTICAL, 2018–2022 (USD MILLION)
                                   TABLE 335 MEXICO: MARKET, BY VERTICAL, 2023–2028 (USD MILLION)
                                   TABLE 336 MEXICO: MARKET, BY THREAT TYPE,  2018–2022 (USD MILLION)
                                   TABLE 337 MEXICO: MARKET, BY THREAT TYPE,  2023–2028 (USD MILLION)
             12.6.5 REST OF LATIN AMERICA
 
13 COMPETITIVE LANDSCAPE (Page No. - 214)
     13.1 KEY PLAYER STRATEGIES/RIGHT TO WIN 
               TABLE 338 OVERVIEW OF STRATEGIES ADOPTED BY KEY PLAYERS IN MTD MARKET
     13.2 MARKET RANKING 
               FIGURE 37 MARKET RANKING IN 2022
     13.3 REVENUE ANALYSIS 
               FIGURE 38 REVENUE ANALYSIS OF KEY MOBILE THREAT DEFENSE VENDORS IN PAST FIVE YEARS
     13.4 MARKET SHARE ANALYSIS 
               FIGURE 39 MARKET (GLOBAL) SHARE, 2022
               TABLE 339 DEGREE OF COMPETITION
     13.5 COMPANY EVALUATION MATRIX 
             13.5.1 DEFINITIONS AND METHODOLOGY
                       TABLE 340 EVALUATION CRITERIA
             13.5.2 STARS
             13.5.3 EMERGING LEADERS
             13.5.4 PERVASIVE PLAYERS
             13.5.5 PARTICIPANTS
                       FIGURE 40 MOBILE THREAT DEFENSE MARKET (GLOBAL): COMPANY EVALUATION MATRIX, 2022
             13.5.6 PRODUCT FOOTPRINT
                       TABLE 341 PRODUCT FOOTPRINT
                       TABLE 342 VERTICAL FOOTPRINT
                       TABLE 343 REGION FOOTPRINT
     13.6 START-UP/SME EVALUATION MATRIX 
             13.6.1 DEFINITIONS AND METHODOLOGY
             13.6.2 PROGRESSIVE COMPANIES
             13.6.3 RESPONSIVE COMPANIES
             13.6.4 DYNAMIC COMPANIES
             13.6.5 STARTING BLOCKS
                       FIGURE 41 MARKET (GLOBAL): START-UP/SME EVALUATION MATRIX, 2022
             13.6.6 COMPETITIVE BENCHMARKING
                       TABLE 344 MARKET: DETAILED LIST OF KEY STARTUP/SMES
                       TABLE 345 MARKET: COMPETITIVE BENCHMARKING OF KEY PLAYERS [START-UP/SMES]
     13.7 COMPETITIVE SCENARIO AND TRENDS 
             13.7.1 PRODUCT LAUNCHES
                       TABLE 346 MARKET: PRODUCT LAUNCHES, JUNE 2022–SEPTEMBER 2023
             13.7.2 DEALS
                       TABLE 347 MOBILE THREAT DEFENSE MARKET: DEALS, JANUARY 2019–SEPTEMBER 2023
     13.8 MOBILE THREAT DEFENSE PRODUCT BENCHMARKING 
               TABLE 348 COMPARATIVE ANALYSIS OF PROMINENT MOBILE THREAT DEFENSE OFFERINGS
     13.9 VALUATION AND FINANCIAL METRICS OF KEY MOBILE THREAT DEFENSE VENDORS 
               FIGURE 42 VALUATION AND FINANCIAL METRICS OF KEY MOBILE THREAT DEFENSE VENDORS
 
14 COMPANY PROFILES (Page No. - 231)
     14.1 MAJOR PLAYERS 
(Business overview, Products/Solutions/Services offered, Recent developments, MnM view, Right to win, Strategic choices, and Weaknesses and Competitive threats)*
             14.1.1 CISCO
                       TABLE 349 CISCO: COMPANY OVERVIEW
                       FIGURE 43 CISCO: COMPANY SNAPSHOT
                       TABLE 350 CISCO: PRODUCTS/SOLUTIONS/SERVICES OFFERED
                       TABLE 351 CISCO: PRODUCT LAUNCHES AND ENHANCEMENTS
                       TABLE 352 CISCO: DEALS
             14.1.2 SAP
                       TABLE 353 SAP: COMPANY OVERVIEW
                       FIGURE 44 SAP: COMPANY SNAPSHOT
                       TABLE 354 SAP: PRODUCTS/SOLUTIONS/SERVICES OFFERED
             14.1.3 BROADCOM
                       TABLE 355 BROADCOM: COMPANY OVERVIEW
                       FIGURE 45 BROADCOM: COMPANY SNAPSHOT
                       TABLE 356 BROADCOM: PRODUCTS/SOLUTIONS/SERVICES OFFERED
                       TABLE 357 BROADCOM: DEALS
             14.1.4 VMWARE
                       TABLE 358 VMWARE: COMPANY OVERVIEW
                       FIGURE 46 VMWARE: COMPANY SNAPSHOT
                       TABLE 359 VMWARE: PRODUCTS/SOLUTIONS/SERVICES OFFERED
                       TABLE 360 VMWARE: PRODUCT LAUNCHES AND ENHANCEMENTS
                       TABLE 361 VMWARE: DEALS
             14.1.5 CITRIX SYSTEMS
                       TABLE 362 CITRIX SYSTEMS: COMPANY OVERVIEW
                       FIGURE 47 CITRIX SYSTEMS: COMPANY SNAPSHOT
                       TABLE 363 CITRIX SYSTEMS: PRODUCTS/SOLUTIONS/SERVICES OFFERED
                       TABLE 364 CITRIX SYSTEMS: DEALS
             14.1.6 KASPERSKY LABS
                       TABLE 365 KASPERSKY LAB: COMPANY OVERVIEW
                       TABLE 366 KASPERSKY LAB: PRODUCTS/SOLUTIONS/SERVICES OFFERED
             14.1.7 IVANTI
                       TABLE 367 IVANTI: COMPANY OVERVIEW
                       TABLE 368 IVANTI: PRODUCTS/SOLUTIONS/SERVICES OFFERED
                       TABLE 369 IVANTI: DEALS
             14.1.8 ZOHO
                       TABLE 370 ZOHO: COMPANY OVERVIEW
                       TABLE 371 ZOHO: PRODUCTS/SOLUTIONS/SERVICES OFFERED
             14.1.9 SOLARWINDS
                       TABLE 372 SOLARWINDS: COMPANY OVERVIEW
                       FIGURE 48 SOLARWINDS: COMPANY SNAPSHOT
                       TABLE 373 SOLARWINDS: PRODUCTS/SOLUTIONS/SERVICES OFFERED
                       TABLE 374 SOLARWINDS: DEALS
             14.1.10 MICRO FOCUS
                       TABLE 375 MICRO FOCUS: COMPANY OVERVIEW
                       TABLE 376 MICRO FOCUS: PRODUCTS/SOLUTIONS/SERVICES OFFERED
                       TABLE 377 MICRO FOCUS: DEALS
             14.1.11 BLACKBERRY
             14.1.12 ZIMPERIUM
             14.1.13 MATRIX42
             14.1.14 SOPHOS
             14.1.15 JAMF
     14.2 START-UPS/SMES 
             14.2.1 ESPER
             14.2.2 LOOKOUT
             14.2.3 PRADEO
             14.2.4 GUARDSQUARE
             14.2.5 UPSTREAM SECURITY
             14.2.6 NEXTHINK
             14.2.7 SNYK
             14.2.8 BARRACUDA NETWORKS
             14.2.9 ZIMBRA
             14.2.10 APPGUARD
             14.2.11 CELLTRUST
             14.2.12 SENTINELONE
             14.2.13 CYBEREASON
*Details on Business overview, Products/Solutions/Services offered, Recent developments, MnM view, Right to win, Strategic choices, and Weaknesses and Competitive threats might not be captured in case of unlisted companies.
 
15 ADJACENT MARKETS (Page No. - 262)
     15.1 INTRODUCTION TO ADJACENT MARKETS 
               TABLE 378 ADJACENT MARKETS AND FORECASTS
             15.1.1 LIMITATIONS
     15.2 MOBILE SECURITY MARKET 
               TABLE 379 SMALL AND MEDIUM-SIZED ENTERPRISES: MOBILE SECURITY MARKET,  BY REGION, 2017–2024 (USD MILLION)
               TABLE 380 LARGE ENTERPRISES: MOBILE SECURITY MARKET, BY REGION,  2017–2024 (USD MILLION)
               TABLE 381 CLOUD: MOBILE SECURITY MARKET, BY REGION, 2017–2024 (USD MILLION)
               TABLE 382 ON-PREMISES: MOBILE SECURITY MARKET, BY REGION, 2017–2024 (USD MILLION)
     15.3 MOBILE APPLICATION SECURITY MARKET 
               TABLE 383 ON-PREMISES MARKET: MOBILE APPLICATION SECURITY MARKET, BY REGION,  2013–2020 (USD MILLION)
               TABLE 384 CLOUD MARKET: MOBILE APPLICATION SECURITY MARKET, BY REGION,  2013–2020 (USD MILLION)
               TABLE 385 LARGE ENTERPRISES MARKET: MOBILE APPLICATION SECURITY MARKET,  BY REGION, 2013–2020 (USD MILLION)
               TABLE 386 SMB MARKET: MOBILE APPLICATION SECURITY MARKET, BY REGION,  2013–2020 (USD MILLION)
 
16 APPENDIX (Page No. - 266)
     16.1 DISCUSSION GUIDE 
     16.2 KNOWLEDGESTORE: MARKETSANDMARKETS’  SUBSCRIPTION PORTAL 
     16.3 CUSTOMIZATION OPTIONS 
     16.4 RELATED REPORTS 
     16.5 AUTHOR DETAILS 

The research study involved four major activities in estimating the mobile threat defense market size. Exhaustive secondary research has been done to collect important information about the market and peer markets. The next step has been to validate these findings, assumptions, and sizing with the help of primary research with industry experts across the value chain. Both top-down and bottom-up approaches have been used to estimate the market size. Post which the market breakdown and data triangulation have been adopted to estimate the market sizes of segments and sub-segments.

Secondary Research

In the secondary research process, various secondary sources were referred to identify and collect information for the study. These included journals, annual reports, press releases, investor presentations of companies and white papers, certified publications, and articles from recognized associations and government publishing sources. Secondary research was mainly used to obtain key information about industry insights, the market’s monetary chain, the overall pool of key players, market classification, and segmentation according to industry trends to the bottom-most level, regional markets, and key developments from both market and technology-oriented perspectives.

Primary Research

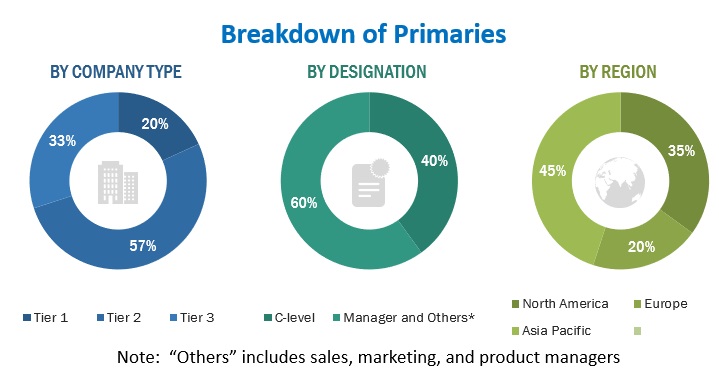
In the primary research process, various primary sources from both the supply and demand sides were interviewed to obtain qualitative and quantitative information for the report. The primary sources from the supply side included industry experts, such as Chief Executive Officers (CEOs), Chief Technology Officers (CTOs), Chief Operating Officers (COOs), Vice Presidents (VPs), marketing directors, technology and innovation directors, and related key executives from various companies and organizations operating in the mobile threat defense market. The primary sources from the demand side included consultants/specialists, Chief Information Officers (CIOs), and subject-matter experts.
Mobile Threat Defense Market Size, and Share

To know about the assumptions considered for the study, download the pdf brochure

Market Size Estimation

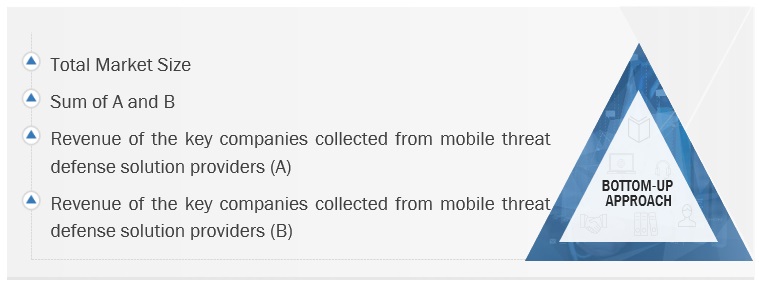
Multiple approaches were adopted to estimate and forecast the mobile threat defense market. The first approach involved estimating the market size by summating companies’ revenue generated through mobile threat defense solutions.

Both top-down and bottom-up approaches were used to estimate and validate the total size of the mobile threat defense market. The research methodology used to estimate the market size includes the following:

  • Key players in the market have been identified through extensive secondary research.
  • In terms of value, the industry’s supply chain and market size have been determined through primary and secondary research processes.
  • All percentage shares, splits, and breakups have been determined using secondary sources and verified through primary sources.

Market Size Estimation Methodology-Bottom-up approach
Mobile Threat Defense Market Size, and Share

To know about the assumptions considered for the study, Request for Free Sample Report

Market Size Estimation Methodology-top-down approach

Mobile Threat Defense Market Size, and Share

Data Triangulation

The data triangulation procedures were used to complete the overall market engineering process and arrive at the exact statistics for all segments and subsegments. The data was triangulated by studying various factors and trends from the demand and supply sides. Along with data triangulation and market breakdown, the market size was validated by the top-down and bottom-up approaches.

Market Definition

The market definition of mobile threat defense refers to a category of security solutions and practices designed to protect mobile devices, such as smartphones and tablets, from a wide range of security threats and vulnerabilities. These threats include malware, ransomware, phishing attacks, data breaches, and other cyberattacks that specifically target mobile endpoints. MTD solutions typically encompass various security measures, including mobile device management, mobile application security, secure access controls, and threat detection capabilities. The primary goal of MTD is to safeguard sensitive data, ensure regulatory compliance, and protect the integrity of mobile devices used in both personal and professional contexts. As the use of mobile devices continues to proliferate, the MTD market plays a critical role in addressing the security challenges associated with the mobile ecosystem.

Key Stakeholders

  • Chief technology and data officers
  • Software and solution developers
  • Integration and deployment service providers
  • Business analysts
  • Information Technology (IT) professionals
  • Investors and venture capitalists
  • Third-party providers
  • Consultants/consultancies/advisory firms
  • Cyber-security firms

The main objectives of this study are as follows:

  • To define, describe, and forecast the mobile threat defense market based on segments based on offering, OS, deployment mode, organization size, application, and vertical with regions covered.
  • To forecast the size of the market segments with respect to five regions: North America, Europe, Asia Pacific (APAC), Middle East and Africa (MEA), and Latin America.
  • To provide detailed information on the major factors (drivers, opportunities, threats, and challenges) influencing the growth of the market.
  • To analyze each submarket with respect to individual growth trends, prospects, and contributions to the global market.
  • To analyze opportunities in the market for stakeholders by identifying high-growth segments of the global mobile threat defense market.
  • To profile the key market players, such as top and emerging vendors; provide a comparative analysis based on their business overviews, product offerings, and business strategies; and illustrate the market’s competitive landscape.
  • To track and analyze competitive developments in the market, such as new product launches, product enhancements, partnerships, acquisitions, and agreements and collaborations.

Available Customizations

With the given market data, MarketsandMarkets offers customizations as per the company’s specific needs. The following customization options are available for the report:

Company Information

  • Detailed analysis and profiling of additional market players (up to 5)
Custom Market Research Services

We will customize the research for you, in case the report listed above does not meet with your exact requirements. Our custom research will comprehensively cover the business information you require to help you arrive at strategic and profitable business decisions.

Request Customization
Report Code
TC 8841
Published ON
Nov, 2023
Choose License Type
BUY NOW
  • SHARE
X
Request Customization
Speak to Analyst
Speak to Analyst
OR FACE-TO-FACE MEETING
PERSONALIZE THIS RESEARCH
  • Triangulate with your Own Data
  • Get Data as per your Format and Definition
  • Gain a Deeper Dive on a Specific Application, Geography, Customer or Competitor
  • Any level of Personalization
REQUEST A FREE CUSTOMIZATION
LET US HELP YOU!
  • What are the Known and Unknown Adjacencies Impacting the Mobile Threat Defense Market
  • What will your New Revenue Sources be?
  • Who will be your Top Customer; what will make them switch?
  • Defend your Market Share or Win Competitors
  • Get a Scorecard for Target Partners
CUSTOMIZED WORKSHOP REQUEST
+1-888-600-6441
  • Call Us
  • +1-888-600-6441 (Corporate office hours)
  • +1-888-600-6441 (US/Can toll free)
  • +44-800-368-9399 (UK office hours)
CONNECT WITH US
ABOUT TRUST ONLINE
©2024 MarketsandMarkets Research Private Ltd. All rights reserved
DMCA.com Protection Status Website Feedback