Moisture Analyzer Market by Analyzing Technique (Karl Fischer Titration, Loss-on-Drying, Capacitance, Microwave, Drying Oven, Near-Infrared, Radio Frequency), Equipment Type (Desktop, Handheld, In-Line), Vertical, and Geography - Global Forecast to 2036


Moisture Analyzer Market Summary
The Moisture Analyzer Market was valued at approximately USD 1.4–1.6 billion in 2024 and is projected to reach USD 2.6–2.9 billion by 2036, growing at a CAGR of 6.5%–7.5% during the forecast period (2025–2036). The market is witnessing steady expansion, driven by the increasing demand for precision measurement across industries such as pharmaceuticals, food & beverages, chemicals, and agriculture. The integration of advanced technologies such as artificial intelligence (AI), Internet of Things (IoT), and automation into analytical instruments is significantly transforming the market landscape. Industries are increasingly adopting moisture analyzers for real-time quality control, compliance with regulatory standards, and enhanced production efficiency. The ongoing digital transformation and shift toward Industry 4.0 are further accelerating the adoption of smart moisture analysis systems.
Key Market Trends & Insights
The Moisture Analyzer Market is evolving with strong technological and regional dynamics shaping its growth trajectory.
North America continues to dominate the market due to its advanced industrial infrastructure, strong regulatory framework, and high adoption of automated laboratory equipment. Meanwhile, Asia Pacific is emerging as the fastest-growing region, fueled by rapid industrialization, expanding food processing sectors, and increasing pharmaceutical production in countries like China and India.
The halogen moisture analyzer segment remains dominant due to its high accuracy, rapid results, and widespread use across industries. At the same time, portable and handheld analyzers are gaining traction for field applications and on-site testing.
AI-driven analytics and IoT-enabled moisture analyzers are emerging as key trends, enabling predictive maintenance, remote monitoring, and data-driven decision-making. Automation is playing a critical role in enhancing operational efficiency and reducing human error in laboratory environments.
The growing emphasis on quality assurance and regulatory compliance, particularly in pharmaceuticals and food safety, is significantly boosting demand for advanced moisture analysis solutions.
Market Size & Forecast
-
Base year market size (2024): USD 1.4–1.6 billion
-
Forecast value by 2036: USD 2.6–2.9 billion
-
CAGR (2025–2036): 6.5%–7.5%
-
Growth is driven by increasing demand for precision measurement, automation in laboratories, rising adoption in pharmaceuticals and food industries, and integration of AI and IoT technologies
Moisture Analyzer Market Top 10 key takeaway
-
The market is projected to nearly double in size by 2036.
-
North America leads due to technological advancements and regulatory compliance.
-
Asia Pacific is the fastest-growing region driven by industrial expansion.
-
Halogen moisture analyzers dominate due to speed and accuracy.
-
AI and IoT integration are transforming traditional moisture analysis.
-
Food and pharmaceutical industries are primary demand drivers.
-
Portable analyzers are gaining popularity for field applications.
-
Automation is reducing human error and improving efficiency.
-
Regulatory standards are pushing adoption across industries.
-
Increasing R&D investments are driving innovation in analyzer technologies.
Product Insights
The halogen moisture analyzer segment holds the largest share in the Moisture Analyzer Market due to its ability to deliver rapid and highly accurate results. These analyzers use halogen heating technology to quickly determine moisture content, making them ideal for time-sensitive applications in pharmaceuticals and food processing industries. Their precision and ease of use have made them a preferred choice in quality control laboratories.
Infrared and microwave moisture analyzers are also gaining traction, particularly in industrial applications where continuous monitoring is required. These technologies offer non-destructive testing and are suitable for bulk material analysis. Meanwhile, portable and handheld moisture analyzers are emerging as a significant growth segment, especially in agriculture and construction, where on-site testing is essential.
The integration of AI into product design is enabling advanced features such as automated calibration, predictive diagnostics, and real-time data analytics. This is enhancing the functionality of moisture analyzers and expanding their application scope across industries.
Technology / Component Insights
The Moisture Analyzer Market is being significantly influenced by advancements in sensor technology, data analytics, and connectivity solutions. Key technologies include halogen heating, infrared radiation, microwave measurement, and Karl Fischer titration, each offering unique advantages based on application requirements.
AI and machine learning algorithms are being increasingly integrated into moisture analyzers to enhance accuracy and enable predictive maintenance. These systems can analyze historical data to detect anomalies and optimize performance, reducing downtime and operational costs.
IoT-enabled moisture analyzers are transforming the way industries monitor and manage moisture levels. These devices allow real-time data transmission, remote monitoring, and integration with cloud platforms, enabling centralized control and improved decision-making.
Automation is playing a crucial role in laboratory workflows, allowing seamless integration of moisture analyzers into automated production lines. This not only improves efficiency but also ensures consistency and compliance with regulatory standards.
Future innovations are expected to focus on miniaturization, enhanced connectivity, and the development of multi-functional analyzers capable of measuring additional parameters alongside moisture content.
Application Insights
The food and beverage industry represents the largest application segment in the Moisture Analyzer Market. Moisture content plays a critical role in determining product quality, shelf life, and safety. As a result, manufacturers are increasingly adopting advanced moisture analyzers to ensure compliance with food safety regulations and maintain product consistency.
The pharmaceutical sector is another major contributor to market growth, where precise moisture measurement is essential for drug formulation, stability testing, and quality control. Regulatory requirements from authorities such as the FDA and EMA are driving the adoption of high-precision moisture analyzers.
In the chemical industry, moisture analyzers are used to monitor raw materials and final products, ensuring process efficiency and product quality. The agriculture sector is also witnessing growing adoption, particularly for soil moisture analysis and crop management.
Future opportunities lie in emerging applications such as environmental monitoring, construction materials testing, and advanced manufacturing processes, where moisture control is critical for performance and durability.
Regional Insights
North America dominates the Moisture Analyzer Market, driven by strong industrial infrastructure, high adoption of advanced technologies, and stringent regulatory standards. The presence of leading manufacturers and continuous investment in R&D further support market growth in this region.
Europe follows closely, with significant demand from the pharmaceutical and food industries. The region’s focus on sustainability and quality assurance is driving the adoption of advanced moisture analysis solutions.
Asia Pacific is the fastest-growing region, fueled by rapid industrialization, expanding manufacturing sectors, and increasing investments in food processing and pharmaceuticals. Countries like China and India are witnessing strong demand due to their growing industrial base and rising awareness of quality control.
-
North America leads due to technological advancement and regulatory compliance
-
Europe shows strong growth in pharmaceuticals and food industries
-
Asia Pacific is the fastest-growing region
-
Increasing industrialization is driving demand in emerging economies
-
Government regulations are boosting adoption globally
Country Specific Market Trends
In Asia Pacific, China is experiencing rapid growth with a CAGR of around 7%–8%, driven by its large manufacturing base and increasing adoption of automation technologies. Japan, with a CAGR of 6%–7%, is focusing on precision instruments and advanced analytical technologies, particularly in pharmaceuticals and electronics.
In North America, the United States leads the market with a CAGR of 6%–7%, supported by strong industrial demand and technological innovation. Canada and Mexico are also witnessing steady growth due to expanding manufacturing and food processing industries.
In Europe, Germany and France are key contributors, with CAGRs of 6%–7%. Germany’s strong industrial base and France’s focus on food safety and pharmaceuticals are driving market growth.
-
China leads APAC growth with strong industrial demand
-
Japan focuses on precision and advanced technologies
-
United States dominates North America market
-
Canada and Mexico show steady industrial growth
-
Germany and France drive European market expansion
Key Moisture Analyzer Market Company Insights
The Moisture Analyzer Market is characterized by the presence of several key players focusing on innovation, product development, and strategic partnerships. Companies such as Mettler-Toledo International Inc., Sartorius AG, A&D Company Ltd., Shimadzu Corporation, and Thermo Fisher Scientific Inc. are leading the market.
These companies are investing heavily in R&D to develop advanced moisture analyzers with enhanced accuracy, speed, and connectivity. AI integration is becoming a key focus, enabling smart features such as automated calibration and predictive maintenance.
Product strategies include the development of portable and user-friendly analyzers to cater to diverse industry needs. Partnerships and collaborations with technology providers are also helping companies expand their product portfolios and strengthen their market presence.
-
Companies focus on innovation and R&D investment
-
AI integration is a key strategic priority
-
Development of portable analyzers is increasing
-
Partnerships are enhancing product capabilities
-
Expansion into emerging markets is a major growth strategy
Recent Developments
Recent developments in the Moisture Analyzer Market highlight the growing emphasis on technology integration and product innovation. Several companies have launched AI-enabled moisture analyzers with real-time data analytics capabilities, enhancing accuracy and operational efficiency.
Additionally, strategic partnerships between instrument manufacturers and software companies are enabling the development of IoT-enabled solutions for remote monitoring and predictive maintenance.
There has also been a rise in product launches focused on portable and handheld analyzers, catering to field applications in agriculture and construction industries.
Market Segmentation
The Moisture Analyzer Market is segmented based on product, technology, application, and region. By product, the market includes halogen moisture analyzers, infrared analyzers, microwave analyzers, and Karl Fischer titration systems. Among these, halogen analyzers dominate due to their speed and accuracy.
In terms of technology, the market is driven by advancements in heating methods, sensor technologies, and AI-powered analytics. IoT-enabled devices are gaining traction for real-time monitoring and data integration.
By application, the market spans food and beverage, pharmaceuticals, chemicals, agriculture, and others, with food and pharmaceuticals leading the demand due to strict quality requirements.
Regionally, the market is segmented into North America, Europe, Asia Pacific, and the rest of the world, with North America leading and Asia Pacific showing the fastest growth.
-
Halogen analyzers dominate product segment
-
AI and IoT are transforming technology landscape
-
Food and pharmaceuticals lead application demand
-
North America leads regional market
-
Asia Pacific shows highest growth potential
The Moisture Analyzer Market is poised for sustained growth through 2036, driven by increasing demand for precision measurement and quality assurance across industries. The integration of AI, IoT, and automation is transforming traditional moisture analysis, enabling smarter, more efficient, and data-driven solutions.
As industries continue to embrace digital transformation, moisture analyzers will play a critical role in ensuring product quality, regulatory compliance, and operational efficiency. The market presents significant opportunities for innovation and expansion, making it a strategically important segment for businesses worldwide.
FAQs
-
What is the current size of the Moisture Analyzer Market?
The market was valued at approximately USD 1.4–1.6 billion in 2024. -
What is the expected growth rate of the market?
The market is expected to grow at a CAGR of 6.5%–7.5% from 2025 to 2036. -
What are the key drivers of the Moisture Analyzer Market?
Key drivers include increasing demand for quality control, adoption of AI and IoT technologies, and regulatory compliance requirements. -
Which region leads the market?
North America currently leads the Moisture Analyzer Market. -
Who are the major players in the market?
Key companies include Mettler-Toledo International Inc., Sartorius AG, Shimadzu Corporation, Thermo Fisher Scientific Inc., and A&D Company Ltd.
To speak to our analyst for a discussion on the above findings, click Speak to Analyst
 Exclusive indicates content/data unique to MarketsandMarkets and not available with any competitors.
Table of Contents
1 Introduction (Page No. - 15)
1.1 Objectives of the Study
1.2 Market Definition
1.3 Study Scope
1.3.1 Markets Covered
1.3.2 Geographic Scope
1.3.3 Years Considered for the Study
1.4 Currency
1.5 Package Size
1.6 Limitations
1.7 Market Stakeholders
2 Research Methodology (Page No. - 19)
2.1 Research Data
2.1.1 Secondary Data
2.1.1.1 List of Major Secondary Sources
2.1.1.2 Key Data From Secondary Sources
2.1.2 Primary Data
2.1.2.1 Primary Interviews With Experts
2.1.2.2 Key Data From Primary Sources
2.1.2.3 Key Industry Insights
2.1.2.4 Breakdown of Primaries
2.1.3 Secondary and Primary Research
2.2 Moisture Analyzer Market Size Estimation
2.2.1 Bottom-Up Approach
2.2.1.1 Approach for Capturing the Market Share By Bottom-Up Analysis (Demand Side)
2.2.2 Top-Down Approach
2.2.2.1 Approach for Capturing the Market Share By Top-Down Analysis (Supply Side)
2.3 Moisture Analyzer Market Ranking Estimation
2.4 Moisture Analyzer Market Breakdown and Data Triangulation
2.5 Research Assumptions
3 Executive Summary (Page No. - 31)
4 Premium Insights (Page No. - 36)
4.1 Attractive Moisture Analyzer Market Opportunities in the Global Moisture Analysis Equipment Market
4.2 Types of Moisture Analysis Equipment
4.3 Moisture Analyzer Market, By Technique and Vertical
4.4 Country-Wise Analysis of the Moisture Analysis Equipment Market
4.5 Moisture Analysis Equipment Market Size, By Region
5 Moisture Analyzer Market Overview (Page No. - 40)
5.1 Introduction
5.2 Moisture Analyzer Market Dynamics
5.2.1 Drivers
5.2.1.1 Rising Demand From Traditional as Well as New Verticals
5.2.1.2 Rapid Adoption in Asia
5.2.2 Restraints
5.2.2.1 Stability and Reliability Issues
5.2.3 Opportunities
5.2.3.1 Growing Process Automation Leading to High Demand of In-Line Moisture Analyzers
5.2.3.2 Technological Advancements Resulting in More Reliable Heat-Based Moisture Analyzers
5.2.4 Challenges
5.2.4.1 Lack of Highly Skilled Staff
5.3 Value Chain Analysis
6 Moisture Analysis Equipment Market, By Analysing Technique (Page No. - 47)
6.1 Introduction
6.2 Karl Fischer Titration
6.3 Loss-On-Drying (LoD)
6.4 Capacitance
6.5 Microwave
6.6 Drying Oven
6.7 Near-Infrared
6.8 Radio Frequency
6.9 Others
7 Moisture Analyzer Market, By Equipment Type (Page No. - 62)
7.1 Introduction
7.2 DesKTop-Mounted
7.3 Handheld
7.4 In-Line
8 Moisture Analyzer Market, By Vertical (Page No. - 69)
8.1 Introduction
8.2 Plastic and Polymer
8.3 Pharmaceuticals
8.4 Chemical and Petroleum
8.5 Food and Beverage
8.6 Wood, Paper, and Pulp
8.7 Research and Academics
8.8 Construction
8.9 Water Treatment and Biomass
8.10 Semiconductor
8.11 Metal and Mining
9 Moisture Analyzer Market, By Geography (Page No. - 92)
9.1 Introduction
9.2 Americas
9.2.1 US
9.2.2 Canada
9.2.3 Mexico
9.2.4 Brazil
9.2.5 Rest of Americas
9.3 Europe
9.3.1 Germany
9.3.2 France
9.3.3 UK
9.3.4 Italy
9.3.5 Spain
9.3.6 Rest of Europe
9.4 Asia Pacific
9.4.1 Japan
9.4.2 China
9.4.3 South Korea
9.4.4 India
9.4.5 Rest of APAC
9.5 Rest of the World
9.5.1 Middle East
9.5.2 Africa
10 Competitive Landscape (Page No. - 107)
10.1 Overview
10.2 Market Rank Analysis
10.3 Vendor Dive Overview
10.3.1 Vanguards
10.3.2 Dynamic
10.3.3 Innovators
10.3.4 Emerging
10.4 Business Strategy (For All 25 Players)
10.5 Product Offerings (For All 25 Players)
10.6 Competitive Scenario
10.6.1 New Product Launches
10.6.2 Acquisitions, Expansions, and Agreements
*Top 25 Companies Analyzed for This Study are - Arizona Instrument LLC (US), A&D Co., Ltd. (Japan), Adam Equipment Inc. (US), Ametek, Inc. (US), Brookhuis Applied Technologies (Netherlands), Cem Corp. (US), General Electric Co. (US), Gow-Mac Instrument Co. (US), Kam Controls, Inc. (US), Kern & Sohn GmbH (Germany), Kett (US), Kyoto Electronics Manufacturing Co., Ltd., (Japan), Metrohm AG (Switzerland), Mettler-Toledo International, Inc. (US), Michell Instruments Inc. (England), Mitsubishi Chemical Holdings Corp. (Japan), PCE Instruments (Germany), Precisa Gravimetrics AG (Switzerland), Sartorius AG (Germany), Shimadzu Corp. (Japan), Sinar Technologiy (England), Spectrasensors, Inc. (US), Systech Illinois Instruments, Inc. (US), Thermo Fisher Scientific, Inc. (US), U-Therm International (H. K.) Ltd. (China)
11 Company Profiles (Page No. - 116)
(Business Overview, Products Offered & Services Strategies, Key Insights, Recent Developments, MnM View)*
11.1 Introduction
11.2 PCE Instruments
11.3 Michell Instruments Inc.
11.4 Ametek, Inc.
11.5 Spectrasensors, Inc.
11.6 General Electric Co.
11.7 A&D Co., Ltd.
11.8 Kett Electric Laboratory
11.9 Mettler-Toledo International, Inc.
11.10 Sartorius AG
11.11 Shimadzu Corp.
11.12 Key Innovators
11.12.1 Gow-Mac Instrument Co.
11.12.2 Mitsubishi Chemical Holdings Corp.
11.12.3 Sinar Technology
11.12.4 Thermo Fisher Scientific, Inc.
11.12.5 U-Therm International (H.K.) Ltd.
*Details on Business Overview, Products Offered & Services Strategies, Key Insights, Recent Developments, MnM View Might Not Be Captured in Case of Unlisted Companies.
12 Appendix (Page No. - 148)
12.1 Insights of Industry Experts
12.2 Discussion Guide
12.3 Knowledge Store: Marketsandmarkets’ Subscription Portal
12.4 Introducing RT: Real-Time Market Intelligence
12.5 Available Customizations
12.6 Related Reports
12.7 Author Details
List of Tables (70 Tables)
Table 1 Moisture Analysis Equipment, By Analyzing Technique, 2015–2022 (USD Million)
Table 2 Moisture Analysis Equipment, By Analyzing Technique, 2015–2022 (Thousand Units)
Table 3 Moisture Analysis Equipment Market for Karl Fischer Titration Technique, By Equipment Type, 2015–2022 (USD Million)
Table 4 Moisture Analyzer Market for Karl Fischer Titration Technique, By Vertical, 2015–2022 (USD Million)
Table 5 Moisture Analyzer Market for Loss-On-Drying Technique, By Equipment Type, 2015–2022 (USD Million)
Table 6 Moisture Analysis Equipment Market for Loss-On-Drying Technique, By Vertical, 2015–2022 (USD Million)
Table 7 Moisture Analysis Equipment Market for Capacitance Technique, By Equipment Type, 2015–2022 (USD Million)
Table 8 Moisture Analyzer Market for Capacitance Technique, By Vertical, 2015–2022 (USD Million)
Table 9 Moisture Analysis Equipment Market for Microwave Technique, By Equipment Type, 2015–2022 (USD Million)
Table 10 Moisture Analysis Equipment Market for Microwave Technique, By Vertical, 2015–2022 (USD Million)
Table 11 Moisture Analyzer Market for Drying Oven Technique, By Equipment Type, 2015–2022 (USD Million)
Table 12 Moisture Analysis Equipment Market for Drying Oven Technique, By Vertical, 2015–2022 (USD Million)
Table 13 Moisture Analysis Equipment Market for Near-Infrared Technique, By Equipment Type, 2015–2022 (USD Million)
Table 14 Moisture Analysis Equipment Market for Near-Infrared Technique, By Vertical, 2015–2022 (USD Million)
Table 15 Moisture Analysis Equipment Market for Radio Frequency Technique, By Equipment Type, 2015–2022 (USD Million)
Table 16 Moisture Analysis Equipment Market for Radio Frequency Technique, By Vertical, 2015–2022 (USD Million)
Table 17 Moisture Analyzer Market for Other Techniques, By Equipment Type, 2015–2022 (USD Million)
Table 18 Moisture Analysis Equipment Market for Other Techniques, By Vertical, 2015–2022 (USD Million)
Table 19 Moisture Analysis Equipment Market, By Equipment Type, 2015–2022 (USD Million)
Table 20 Moisture Analysis Equipment Market, By Equipment Type, 2015–2022 (Thousand Units)
Table 21 Moisture Analysis Equipment Market for DesKTop-Mounted Device, By Analyzing Technique, 2015–2022 (USD Million)
Table 22 Moisture Analyzer Market for DesKTop-Mounted Device, By Vertical, 2015–2022 (USD Million)
Table 23 Moisture Analysis Equipment Market for Handheld Device, By Analyzing Technique, 2015–2022 (USD Million)
Table 24 Moisture Analysis Equipment Market for Handheld Device, By Vertical, 2015–2022 (USD Million)
Table 25 Moisture Analyzer Market for In-Line Device, By Analyzing Technique, 2015–2022 (USD Million)
Table 26 Moisture Analysis Equipment Market for In-Line Device, By Vertical, 2015–2022 (USD Million)
Table 27 Moisture Analysis Equipment Market, By Vertical, 2015–2022 (USD Million)
Table 28 Moisture Analysis Equipment Market, By Vertical, 2015–2022 (Thousand Units)
Table 29 Moisture Analysis Equipment Market for Plastic and Polymer, By Analyzing Technique, 2015–2022 (USD Million)
Table 30 Moisture Analysis Equipment Market for Plastic and Polymer, By Equipment Type, 2015–2022 (USD Million)
Table 31 Moisture Analyzer Market for Plastic and Polymer, By Region, 2015–2022 (USD Million)
Table 32 Moisture Analysis Equipment Market for Pharmaceuticals, By Analyzing Technique, 2015–2022 (USD Million)
Table 33 Moisture Analysis Equipment Market for Pharmaceuticals, By Equipment Type, 2015–2022 (USD Million)
Table 34 Moisture Analysis Equipment Market for Pharmaceuticals, By Region, 2015–2022 (USD Million)
Table 35 Moisture Analyzer Market for Chemical and Petroleum, By Analyzing Technique, 2015–2022 (USD Million)
Table 36 Moisture Analysis Equipment Market for Chemical and Petroleum, By Equipment Type, 2015–2022 (USD Million)
Table 37 Moisture Analysis Equipment Market for Chemical and Petroleum, By Region, 2015–2022 (USD Million)
Table 38 Moisture Analyzer Market for Food and Beverage, By Analyzing Technique, 2015–2022 (USD Million)
Table 39 Moisture Analysis Equipment Market for Food and Beverage, By Equipment Type, 2015–2022 (USD Million)
Table 40 Moisture Analysis Equipment Market for Food and Beverage, By Region, 2015–2022 (USD Million)
Table 41 Moisture Analysis Equipment Market for Wood, Paper, and Pulp, By Analyzing Technique, 2015–2022 (USD Million)
Table 42 Moisture Analyzer Market for Wood, Paper, and Pulp, By Equipment Type, 2015–2022 (USD Million)
Table 43 Moisture Analysis Equipment Market for Wood, Paper, and Pulp, By Region, 2015–2022 (USD Million)
Table 44 Moisture Analysis Equipment Market for Research and Academics, By Analyzing Technique, 2015–2022 (USD Million)
Table 45 Moisture Analysis Equipment Market for Research and Academics, By Equipment Type, 2015–2022 (USD Million)
Table 46 Moisture Analyzer Market for Research and Academics, By Region, 2015–2022 (USD Million)
Table 47 Moisture Analysis Equipment Market for Construction, By Analyzing Technique, 2015–2022 (USD Million)
Table 48 Moisture Analysis Equipment Market for Construction, By Equipment Type, 2015–2022 (USD Million)
Table 49 Moisture Analysis Equipment Market for Construction, By Region, 2015–2022 (USD Million)
Table 50 Moisture Analysis Equipment Market for Water Treatment and Biomass, By Analyzing Technique, 2015–2022 (USD Million)
Table 51 Moisture Analysis Equipment Market for Water Treatment and Biomass, By Equipment Type, 2015–2022 (USD Million)
Table 52 Moisture Analyzer Market for Water Treatment and Biomass, By Region, 2015–2022 (USD Million)
Table 53 Moisture Analysis Equipment Market for Semiconductor, By Analyzing Technique, 2015–2022 (USD Million)
Table 54 Moisture Analysis Equipment Market for Semiconductor, By Equipment Type, 2015–2022 (USD Million)
Table 55 Moisture Analysis Equipment Market for Semiconductor, By Region, 2015–2022 (USD Million)
Table 56 Moisture Analysis Equipment Market for Metal and Mining, By Analyzing Technique, 2015–2022 (USD Million)
Table 57 Moisture Analyzer Market for Metal and Mining, By Equipment Type, 2015–2022 (USD Million)
Table 58 Moisture Analysis Equipment Market for Metal and Mining, By Region, 2015–2022 (USD Million)
Table 59 Moisture Analysis Equipment Market, By Region, 2015–2022 (USD Million)
Table 60 Moisture Analysis Equipment Market in the Americas, By Country, 2015–2022 (USD Million)
Table 61 Moisture Analysis Equipment Market in the Americas, By Vertical, 2015–2022 (USD Million)
Table 62 Moisture Analyzer Market in Europe, By Country, 2015–2022 (USD Million)
Table 63 Moisture Analysis Equipment Market in Europe, By Vertical, 2015–2022 (USD Million)
Table 64 Moisture Analysis Equipment Market in APAC, By Country, 2015–2022 (USD Million)
Table 65 Moisture Analysis Equipment Market in APAC, By Vertical, 2015–2022 (USD Million)
Table 66 Moisture Analysis Equipment Market in RoW, By Region, 2015–2022 (USD Million)
Table 67 Moisture Analyzer Market in RoW, By Vertical, 2015–2022 (USD Million)
Table 68 Top 5 Players in the Moisture Analysis Equipment Market, 2016
Table 69 Most Recent New Product Launches in the Moisture Analysis Equipment Market
Table 70 Most Recent Acquisitions, Expansions, and Agreements in the Moisture Analysis Equipment Market
List of Figures (57 Figures)
Figure 1 Moisture Analysis Equipment Market: Research Design
Figure 2 Process Flow
Figure 3 Moisture Analyzer Market Size Estimation Methodology: Bottom-Up Approach
Figure 4 Moisture Analyzer Market Size Estimation Methodology: Top-Down Approach
Figure 5 Moisture Analyzer Market Breakdown & Data Triangulation
Figure 6 Assumptions of the Research Study
Figure 7 Near-Infrared Estimated to Be the Fastest-Growing Technique of Moisture Analysis Equipment Market Throughout the Forecast Period
Figure 8 The DesKTop-Mounted Equipment Holds the Major Share of the Moisture Analysis Equipment Market in 2016
Figure 9 Food and Beverage and Pharmaceuticals: the Most Promising Verticals of Moisture Analysis Equipment Market
Figure 10 APAC Likely to Be the Fastest-Growing Region in Moisture Analysis Equipment Market During the Forecast Period
Figure 11 Demand in Traditional as Well as New Verticals Driving the Moisture Analysis Equipment Market During the Forecast Period
Figure 12 DesKTop-Mounted Devices are Expected to Dominate the Moisture Analysis Equipment Market During the Forecast Period
Figure 13 Loss-On-Drying Analyzing Technique and Food & Beverage Vertical Hold the Largest Market Shares in the Moisture Analysis Equipment Market During the Forecast Period
Figure 14 US Accounted for the Largest Share of the Moisture Analysis Equipment Market in 2016
Figure 15 Moisture Analysis Equipment Market in APAC is Expected to Grow at the Highest CAGR During the Forecast Period
Figure 16 Rising Demand From Traditional as Well as New Verticals and the Rapid Adoption of Moisture Analyzers in Asia Boosting the Moisture Analysis Equipment Market
Figure 17 Value Chain Analysis: Major Value is Added During the Original Equipment Manufacturing and Supplier and Distributor Phases
Figure 18 Moisture Analysis Equipment Market for Near-Infrared Analyzing Technique Expected to Grow at the Highest Rate During the Forecast Period
Figure 19 In-Line Equipment Type to Witness the Highest Growth in the Moisture Analysis Equipment Market During the Forecast Period
Figure 20 Food and Beverage to Be the Fastest-Growing Vertical for the Moisture Analysis Equipment Market During the Forecast Period
Figure 21 Moisture Analysis Equipment Market: Geographic Snapshot
Figure 22 Snapshot of the Moisture Analysis Equipment Market in the Americas
Figure 23 Snapshot of Moisture Analysis Equipment Market in Europe
Figure 24 Snapshot of Moisture Analysis Equipment Market in APAC
Figure 25 Snapshot of Moisture Analysis Equipment Market in RoW
Figure 26 The Key Growth Strategy Between January 2014 and March 2017
Figure 27 Dive Chart
Figure 28 Moisture Analysis Equipment Market Evaluation Framework
Figure 29 Battle for the Market Share
Figure 30 Geographic Revenue Mix of Top 5 Moisture Analysis Equipment Market Players
Figure 31 PCE Instruments: Product Offerings Scorecard
Figure 32 PCE Instruments: Business Strategy Scorecard
Figure 33 Michell Instruments Inc.: Product Offerings Scorecard
Figure 34 Michell Instruments Inc.: Business Strategy Scorecard
Figure 35 Ametek, Inc.: Company Snapshot
Figure 36 Ametek, Inc.: Product Offerings Scorecard
Figure 37 Ametek, Inc.: Business Strategy Scorecard
Figure 38 Spectrasensors, Inc.: Company Snapshot
Figure 39 Spectrasensors, Inc.: Product Offerings Scorecard
Figure 40 Spectrasensors, Inc.: Business Strategy Scorecard
Figure 41 General Electric Co.: Company Snapshot
Figure 42 General Electric Co.: Product Offerings Scorecard
Figure 43 General Electric Co.: Business Strategy Scorecard
Figure 44 A&D Co., Ltd.: Company Snapshot
Figure 45 A&D Co., Ltd.: Product Offerings Scorecard
Figure 46 A&D Co., Ltd.: Business Strategy Scorecard
Figure 47 Kett Electric Laboratory: Product Offerings Scorecard
Figure 48 Kett Electric Laboratory: Business Offerings Scorecard
Figure 49 Mettler-Toledo International Inc.: Company Snapshot
Figure 50 Mettler-Toledo International Inc.: Product Offerings Scorecard
Figure 51 Mettler-Toledo International Inc.: Business Strategy Scorecard
Figure 52 Sartorius AG: Company Snapshot
Figure 53 Sartorius AG: Product Offerings Scorecard
Figure 54 Sartorius AG: Business Strategy Scorecard
Figure 55 Shimadzu Corp.: Company Snapshot
Figure 56 Shimadzu Corp.: Product Offerings Scorecard
Figure 57 Shimadzu Corp.: Business Strategy Scorecard
The sizing of the moisture analyzer market has been done by the top-down and bottom-up approach. The bottom-up approach has been employed to arrive at the overall size of the moisture analyzer market from the revenues of key players (companies) and their share in the market. Calculations are made on the basis of the number of moisture analyzers used in each type of applications and verticals, which is further multiplied by the production of various applications for all major countries. Finally, the volume is multiplied by the average selling price of each moisture analyzer to arrive at the overall market size. In the top-down approach, the overall market size has been used to estimate the size of the individual markets (mentioned in the market segmentation) through percentage splits from secondary research (including the study of associations, databases, journals, and primary research). For the calculation of specific market segments, the most appropriate parent market size has been used to implement the top-down approach.
In the process of determining and verifying the market size for several segments and subsegments obtained through secondary research, extensive primary interviews have been conducted with key opinion leaders. The break-up of the profiles of primary participants is given below:
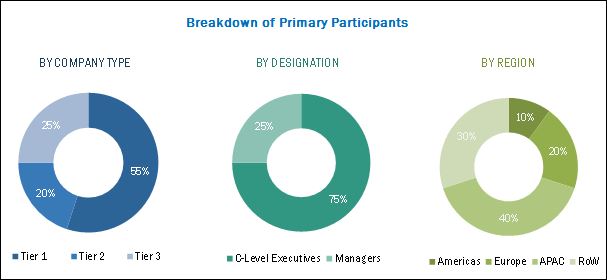
To know about the assumptions considered for the study, download the pdf brochure
The moisture analyzer ecosystem comprises major players for the moisture analyzer market. The key players in the moisture analyzer market are PCE Instruments (Germany), Michell Instruments Inc. (England), Ametek Inc. (US), SpectraSesnsors Inc. (US), General Electric Co. (US), A&D Co., Ltd. (Japan), Kett Electric Laboratory (Japan), Mettler-Toledo International Inc. (US), Sartorius AG (Germany), Shimadzu Corp. (Japan), Gow-Mac Instrument Co. (US), Mitsubishi Chemical Holdings Corp. (Japan), Sinar Technology (England), Thermo Fisher Scientific Inc. (US), and U-Therm International (H.K.) Ltd. (Hong Kong).
All these companies have their own R&D facilities and extensive sales offices and distribution channels. The products of these companies can be used across various verticals for various applications. The report provides the competitive landscape of the key players, which indicates their growth strategies in the moisture analyzer market.
Scope of the Report:
|
Report Metric |
Details |
|
Base year |
2016 |
|
Forecast period |
2017–2022 |
|
Units |
Value (USD) |
|
Segments covered |
Type, End User, Offerings, and Region |
|
Geographic regions covered |
North America, APAC, Europe, and RoW |
|
Companies covered |
PCE Instruments (Germany), Michell Instruments Inc. (England), Ametek Inc. (US), SpectraSesnsors Inc. (US), General Electric Co. (US), A&D Co., Ltd. (Japan), Kett Electric Laboratory (Japan), Mettler-Toledo International Inc. (US), Sartorius AG (Germany), Shimadzu Corp. (Japan), Gow-Mac Instrument Co. (US), Mitsubishi Chemical Holdings Corp. (Japan), Sinar Technology (England), Thermo Fisher Scientific Inc. (US), and U-Therm International (H.K.) Ltd. (Hong Kong) |
Target Audience:
- Raw material and manufacturing equipment suppliers
- Electronic design automation (EDA) and design tool vendors
- Original equipment manufacturers (OEMs)
- Integrated device manufacturers (IDMs)
- Original design manufacturers (ODMs)
- ODM and OEM technology solution providers
- Assembly, testing, and packaging vendors
- Technology, service, and solution providers
- Intellectual property (IP) core and licensing providers
- Suppliers and distributors
- Government and other regulatory bodies
- Technology investors
- Research institutes and organizations
- Market research and consulting firms
“The study answers several questions for the stakeholders, primarily which market segments to focus in next two to five years (depends on range of forecast period) for prioritizing the efforts and investments”
Scope of the Report:
The market covered in this report has been segmented as follows:
-
Moisture Analyzer Market, by Analyzing Technique:
- Karl Fischer Titration
- Loss-on-Drying
- Capacitance
- Microwave
- Drying Oven
- Near-infrared
- Radio Frequency
- Others
-
Moisture Analyzer Market, by Equipment Type:
- Desktop-Mounted
- Handheld
- In-line
-
Moisture Analyzer Market, by Vertical:
- Plastic and Polymer
- Pharmaceuticals
- Chemical and Petroleum
- Food and Beverage
- Wood, Paper, and Pulp
- Research and Academics
- Construction
- Water Treatment and Biomass
- Semiconductor
- Metal and Mining
-
Moisture Analyzer Market, by Geography:
- The Americas
- Europe
- Asia Pacific
- Rest of the World
Available Customizations:
- Further breakdown of the other application’s segment into subcategories
- Further breakdown of the subcategories of other application’s segment, by geography
- Further breakdown of the equipment type, by geography
- Further breakdown of the application segment, by equipment type.


Growth opportunities and latent adjacency in Moisture Analyzer Market
Preferably interested in Grain moisture meter markets and adjacent food segments up- and down-streams.