TABLE OF CONTENTS
1 INTRODUCTION (Page No. - 47)
1.1 STUDY OBJECTIVES
1.2 MARKET DEFINITION
1.2.1 INCLUSIONS AND EXCLUSIONS
1.3 MARKET SCOPE
1.3.1 MARKET SEGMENTATION
1.3.2 REGIONS COVERED
1.3.3 YEARS CONSIDERED
1.4 CURRENCY CONSIDERED
TABLE 1 USD EXCHANGE RATES, 2018–2022
1.5 STAKEHOLDERS
1.6 SUMMARY OF CHANGES
2 RESEARCH METHODOLOGY (Page No. - 53)
2.1 RESEARCH DATA
FIGURE 1 MULTI-FACTOR AUTHENTICATION MARKET: RESEARCH DESIGN
2.1.1 SECONDARY DATA
2.1.2 PRIMARY DATA
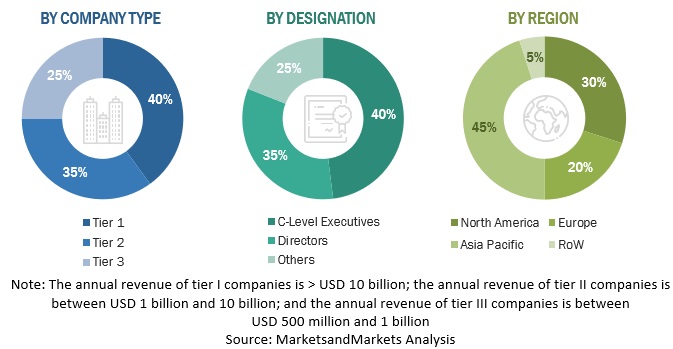
2.1.2.1 Breakdown of primary profiles
FIGURE 2 BREAKDOWN OF PRIMARY INTERVIEWS: BY COMPANY TYPE, DESIGNATION, AND REGION
2.1.2.2 Key insights from industry experts
2.2 DATA TRIANGULATION AND MARKET BREAKUP
FIGURE 3 MULTI-FACTOR AUTHENTICATION MARKET: DATA TRIANGULATION
2.3 MARKET SIZE ESTIMATION
FIGURE 4 MULTI-FACTOR AUTHENTICATION MARKET ESTIMATION: RESEARCH FLOW
2.3.1 REVENUE ESTIMATES
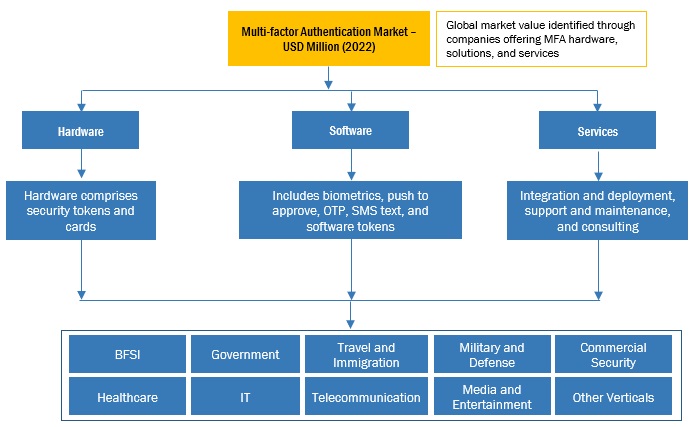
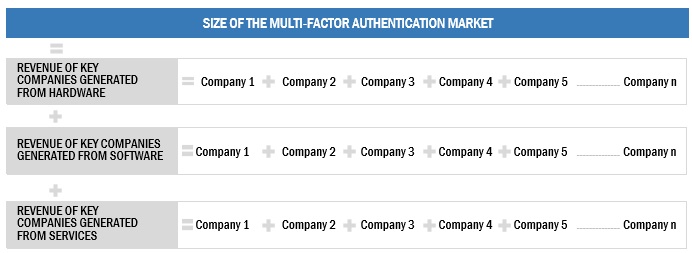
FIGURE 5 MARKET SIZE ESTIMATION METHODOLOGY—APPROACH 1, SUPPLY-SIDE ANALYSIS: REVENUE OF HARDWARE, SOLUTIONS, AND SERVICES FROM VENDORS
FIGURE 6 MARKET SIZE ESTIMATION METHODOLOGY—APPROACH 1, SUPPLY-SIDE ANALYSIS
FIGURE 7 MARKET SIZE ESTIMATION METHODOLOGY—APPROACH 2, BOTTOM-UP (SUPPLY SIDE): COLLECTIVE REVENUE FROM ALL HARDWARE, SOLUTIONS, AND SERVICES OF VENDORS
2.3.2 DEMAND-SIDE ANALYSIS
FIGURE 8 MARKET SIZE ESTIMATION METHODOLOGY—APPROACH 3, TOP-DOWN (DEMAND SIDE)
2.4 MARKET FORECAST
TABLE 2 FACTOR ANALYSIS
2.5 RECESSION IMPACT AND ASSUMPTIONS
2.5.1 RECESSION IMPACT
2.5.2 ASSUMPTIONS
2.6 LIMITATIONS
FIGURE 9 LIMITATIONS
3 EXECUTIVE SUMMARY (Page No. - 63)
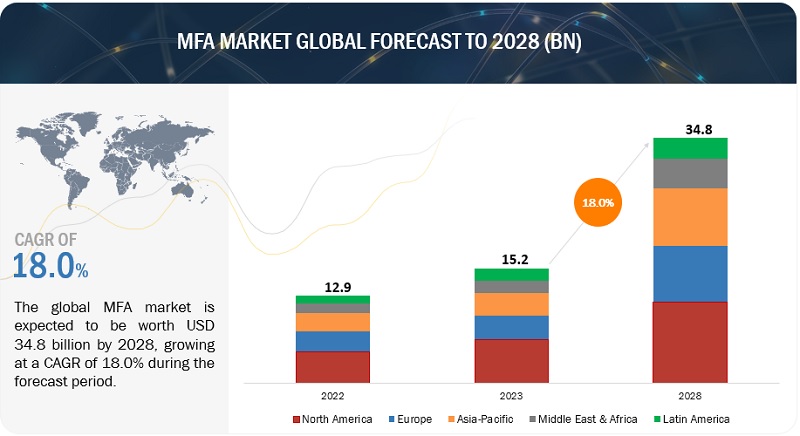
TABLE 3 MULTI-FACTOR AUTHENTICATION MARKET SIZE AND GROWTH RATE, 2017–2022 (USD MILLION, Y-O-Y %)
TABLE 4 MULTI-FACTOR AUTHENTICATION MARKET SIZE AND GROWTH RATE, 2023–2028 (USD MILLION, Y-O-Y %)
FIGURE 10 GLOBAL MULTI-FACTOR AUTHENTICATION MARKET SIZE AND Y-O-Y GROWTH RATE
FIGURE 11 NORTH AMERICA TO DOMINATE MARKET IN 2023
4 PREMIUM INSIGHTS (Page No. - 66)
4.1 BRIEF OVERVIEW OF MULTI-FACTOR AUTHENTICATION MARKET
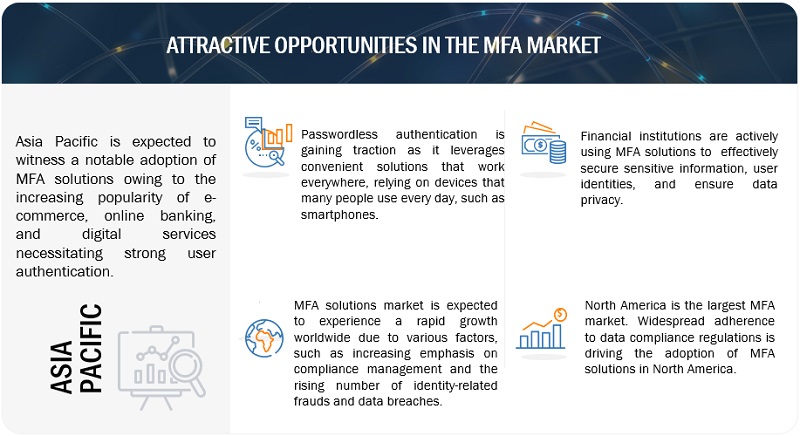
FIGURE 12 GROWING INSTANCES OF DATA BREACHES, RISING ADOPTION OF BYOD TRENDS, AND STRINGENT REGULATIONS TO DRIVE MARKET
4.2 MULTI-FACTOR AUTHENTICATION MARKET: BY AUTHENTICATION TYPE, 2023
FIGURE 13 PASSWORD-BASED AUTHENTICATION SEGMENT TO HOLD LARGER MARKET SHARE DURING FORECAST PERIOD
4.3 MULTI-FACTOR AUTHENTICATION MARKET: BY COMPONENT, 2023
FIGURE 14 SOFTWARE SEGMENT TO HOLD LARGEST MARKET SIZE DURING FORECAST PERIOD
4.4 MULTI-FACTOR AUTHENTICATION MARKET: BY MODEL TYPE, 2023
FIGURE 15 TWO-FACTOR AUTHENTICATION TO HOLD LARGEST MARKET SIZE DURING FORECAST PERIOD
4.5 MULTI-FACTOR AUTHENTICATION MARKET SHARE: TOP THREE END-USE INDUSTRIES AND REGIONS, 2023
FIGURE 16 BFSI END-USE INDUSTRY AND NORTH AMERICA TO ACCOUNT FOR LARGEST MARKET SHARE IN 2023
4.6 MARKET INVESTMENT SCENARIO
FIGURE 17 ASIA PACIFIC TO EMERGE AS BEST MARKET FOR INVESTMENTS IN NEXT FIVE YEARS
5 MARKET OVERVIEW AND INDUSTRY TRENDS (Page No. - 70)
5.1 INTRODUCTION
5.2 MARKET DYNAMICS
FIGURE 18 DRIVERS, RESTRAINTS, OPPORTUNITIES, AND CHALLENGES: MULTI-FACTOR AUTHENTICATION MARKET
5.2.1 DRIVERS
5.2.1.1 Growing adoption of BYOD, CYOD, and WFH trends
5.2.1.2 Rising security breaches and sophisticated cyberattacks to lead to financial and reputational loss
5.2.1.3 Stringent government regulations to increase adoption of MFA solutions
5.2.1.4 Rising instances of identity theft and fraud
5.2.2 RESTRAINTS
5.2.2.1 High cost and technical complexities
5.2.2.2 More time-consuming than two-factor authentication systems
5.2.3 OPPORTUNITIES
5.2.3.1 Proliferation of cloud-based MFA solutions and services
5.2.3.2 Growing adoption of interconnected devices in IoT environment
5.2.3.3 Increasing digital banking and online transactions
5.2.4 CHALLENGES
5.2.4.1 Lack of awareness regarding MFA solutions
5.2.4.2 Scarcity of skilled cybersecurity professionals
5.3 CASE STUDY ANALYSIS
5.3.1 PING IDENTITY IMPROVED BOOKING RECONCILIATION PROCESS OF PAMEIJER ACROSS ALL BUSINESS UNITS
5.3.2 AMERIGAS DEPLOYED DUO SECURITY’S MFA TO ACHIEVE PCI-DSS COMPLIANCE
5.3.3 BROWARD COLLEGE IMPLEMENTED ONELOGIN MULTI-FACTOR AUTHENTICATION TO OFFER ACCESS MANAGEMENT
5.3.4 OKTA DELIVERED BLACKHAWK NETWORK CENTRALIZED, SCALABLE PLATFORM AND SAFEGUARDED BACKEND BY EXTENDING SSO AND MFA
5.4 VALUE CHAIN ANALYSIS
FIGURE 19 MULTI-FACTOR AUTHENTICATION MARKET: VALUE CHAIN ANALYSIS
5.5 ECOSYSTEM
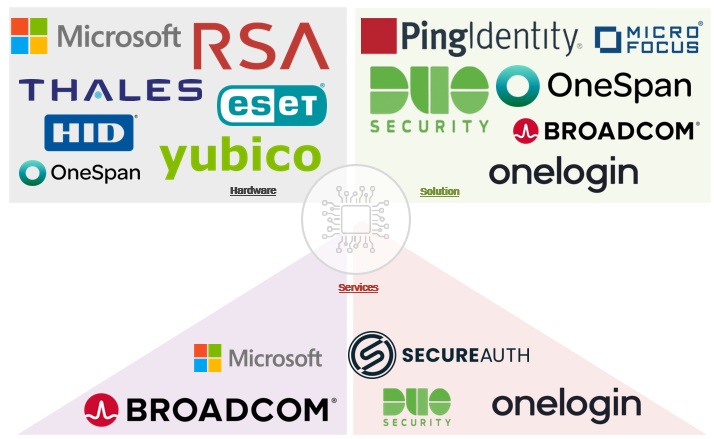
FIGURE 20 MULTI-FACTOR AUTHENTICATION MARKET: ECOSYSTEM
5.6 PORTER’S FIVE FORCES ANALYSIS
TABLE 5 PORTER’S FIVE FORCES ANALYSIS
FIGURE 21 MULTI-FACTOR AUTHENTICATION MARKET: PORTER’S FIVE FORCES ANALYSIS
5.6.1 THREAT OF NEW ENTRANTS
5.6.2 THREAT OF SUBSTITUTES
5.6.3 BARGAINING POWER OF SUPPLIERS
5.6.4 BARGAINING POWER OF BUYERS
5.6.5 INTENSITY OF COMPETITIVE RIVALRY
5.7 PRICING ANALYSIS
5.7.1 AVERAGE SELLING PRICE TREND OF KEY PLAYER, BY OFFERING
TABLE 6 OKTA: PRICING ANALYSIS
TABLE 7 ONELOGIN: PRICING ANALYSIS
5.7.2 INDICATIVE PRICING ANALYSIS, BY OFFERING
5.8 TECHNOLOGY ANALYSIS
5.8.1 OUT-OF-BAND AUTHENTICATION
5.8.2 BUILT-IN FINGERPRINT READERS
5.8.3 BAKED-IN AUTHENTICATION
5.9 PATENT ANALYSIS
FIGURE 22 LIST OF MAJOR PATENTS FOR MULTI-FACTOR AUTHENTICATION MARKET
TABLE 8 LIST OF PATENTS IN MULTI-FACTOR AUTHENTICATION MARKET, 2023
5.10 TRENDS AND DISRUPTIONS IMPACTING CUSTOMERS/CLIENTS’ BUSINESSES
FIGURE 23 MULTI-FACTOR AUTHENTICATION MARKET: TRENDS AND DISRUPTIONS IMPACTING CUSTOMERS/CLIENTS’ BUSINESSES
5.11 TECHNOLOGY ROADMAP
TABLE 9 MULTI-FACTOR AUTHENTICATION MARKET: TECHNOLOGY ROADMAP
5.12 BUSINESS MODEL ANALYSIS
TABLE 10 MULTI-FACTOR AUTHENTICATION MARKET: BUSINESS MODEL ANALYSIS
5.13 EVOLUTION OF MULTI-FACTOR AUTHENTICATION
5.14 REGULATORY LANDSCAPE
5.14.1 REGULATORY BODIES, GOVERNMENT AGENCIES, AND OTHER ORGANIZATIONS
TABLE 11 LIST OF REGULATORY BODIES, GOVERNMENT AGENCIES, AND OTHER ORGANIZATIONS
5.14.2 CRIMINAL JUSTICE INFORMATION SYSTEM SECURITY POLICY
5.14.3 PAYMENT CARD INDUSTRY DATA SECURITY STANDARD
5.14.4 FFIEC AUTHENTICATION IN AN INTERNET BANKING ENVIRONMENT
5.14.5 FAIR AND ACCURATE CREDIT TRANSACTION ACT
5.14.6 IDENTITY THEFT RED FLAGS
5.14.7 HEALTH INSURANCE PORTABILITY AND ACCOUNTABILITY ACT
5.14.8 SARBANES-OXLEY ACT
5.14.9 GRAMM-LEACH-BLILEY ACT
5.15 HS CODES
TABLE 12 EXPORT SCENARIO FOR HS CODE 8301, BY COUNTRY, 2022 (KG)
TABLE 13 IMPORT SCENARIO FOR HS CODE 8301, BY COUNTRY, 2022 (KG)
5.16 KEY STAKEHOLDERS AND BUYING CRITERIA
5.16.1 KEY STAKEHOLDERS IN BUYING PROCESS
FIGURE 24 INFLUENCE OF STAKEHOLDERS ON BUYING PROCESS FOR TOP THREE END USERS
TABLE 14 INFLUENCE OF STAKEHOLDERS ON BUYING PROCESS FOR TOP THREE END USERS
5.16.2 BUYING CRITERIA
FIGURE 25 KEY BUYING CRITERIA FOR TOP THREE END USERS
TABLE 15 KEY BUYING CRITERIA FOR TOP THREE END USERS
5.17 KEY CONFERENCES AND EVENTS, 2023–2024
TABLE 16 MULTI-FACTOR AUTHENTICATION MARKET: LIST OF CONFERENCES AND EVENTS, 2023–2024
6 MULTI-FACTOR AUTHENTICATION MARKET, BY AUTHENTICATION TYPE (Page No. - 96)
6.1 INTRODUCTION
6.1.1 AUTHENTICATION TYPE: MULTI-FACTOR AUTHENTICATION MARKET DRIVERS
FIGURE 26 PASSWORDLESS AUTHENTICATION SEGMENT TO GROW AT HIGHER CAGR DURING FORECAST PERIOD
TABLE 17 MULTI-FACTOR AUTHENTICATION MARKET, BY AUTHENTICATION TYPE, 2017–2022 (USD MILLION)
TABLE 18 MULTI-FACTOR AUTHENTICATION MARKET, BY AUTHENTICATION TYPE, 2023–2028 (USD MILLION)
6.2 PASSWORD-BASED AUTHENTICATION
6.2.1 EASY INTEGRATION OF PASSWORD-BASED AUTHENTICATION INTO VARIOUS SYSTEMS, APPLICATIONS, AND DEVICES TO DRIVE ITS ADOPTION
TABLE 19 PASSWORD-BASED AUTHENTICATION: MULTI-FACTOR AUTHENTICATION MARKET, BY REGION, 2017–2022 (USD MILLION)
TABLE 20 PASSWORD-BASED AUTHENTICATION: MULTI-FACTOR AUTHENTICATION MARKET, BY REGION, 2023–2028 (USD MILLION)
6.3 PASSWORDLESS AUTHENTICATION
6.3.1 PASSWORDLESS AUTHENTICATION TO USE UNIQUE BIOMETRIC ATTRIBUTES AND ELIMINATE ISSUE OF REMEMBERING PASSWORDS
TABLE 21 PASSWORDLESS AUTHENTICATION: MULTI-FACTOR AUTHENTICATION MARKET, BY REGION, 2017–2022 (USD MILLION)
TABLE 22 PASSWORDLESS AUTHENTICATION: MULTI-FACTOR AUTHENTICATION MARKET, BY REGION, 2023–2028 (USD MILLION)
7 MULTI-FACTOR AUTHENTICATION MARKET, BY COMPONENT (Page No. - 101)
7.1 INTRODUCTION
7.1.1 COMPONENT: MULTI-FACTOR AUTHENTICATION MARKET DRIVERS
FIGURE 27 SOFTWARE SEGMENT TO HOLD LARGEST MARKET SIZE DURING FORECAST PERIOD
TABLE 23 MULTI-FACTOR AUTHENTICATION MARKET, BY COMPONENT, 2017–2022 (USD MILLION)
TABLE 24 MULTI-FACTOR AUTHENTICATION MARKET, BY COMPONENT, 2023–2028 (USD MILLION)
7.2 HARDWARE
7.2.1 HARDWARE-BASED MFA METHODS TO PROVIDE ROBUST AUTHENTICATION AND SIGNIFICANTLY REDUCE RISK OF UNAUTHORIZED ACCESS
TABLE 25 HARDWARE: MULTI-FACTOR AUTHENTICATION MARKET, BY REGION, 2017–2022 (USD MILLION)
TABLE 26 HARDWARE: MULTI-FACTOR AUTHENTICATION MARKET, BY REGION, 2023–2028 (USD MILLION)
7.3 SOFTWARE
7.3.1 MFA SOFTWARE TO HELP BUSINESSES COMPLY WITH REGULATORY NORMS WHILE SECURING THEIR CONFIDENTIAL DATA
TABLE 27 SOFTWARE: MULTI-FACTOR AUTHENTICATION MARKET, BY REGION, 2017–2022 (USD MILLION)
TABLE 28 SOFTWARE: MULTI-FACTOR AUTHENTICATION MARKET, BY REGION, 2023–2028 (USD MILLION)
7.4 SERVICES
7.4.1 MFA SERVICES TO DEPLOY, EXECUTE, AND MAINTAIN MFA PLATFORMS IN ORGANIZATIONS
TABLE 29 SERVICES: MULTI-FACTOR AUTHENTICATION MARKET, BY REGION, 2017–2022 (USD MILLION)
TABLE 30 SERVICES: MULTI-FACTOR AUTHENTICATION MARKET, BY REGION, 2023–2028 (USD MILLION)
8 MULTI-FACTOR AUTHENTICATION MARKET, BY MODEL TYPE (Page No. - 107)
8.1 INTRODUCTION
8.1.1 MODEL TYPE: MULTI-FACTOR AUTHENTICATION MARKET DRIVERS
FIGURE 28 TWO-FACTOR AUTHENTICATION SEGMENT TO HOLD LARGEST MARKET SIZE DURING FORECAST PERIOD
TABLE 31 MULTI-FACTOR AUTHENTICATION MARKET, BY MODEL TYPE, 2017–2022 (USD MILLION)
TABLE 32 MULTI-FACTOR AUTHENTICATION MARKET, BY MODEL TYPE, 2023–2028 (USD MILLION)
8.2 TWO-FACTOR AUTHENTICATION
8.2.1 NEED FOR ADDITIONAL LAYER OF SECURITY AND REMAIN COMPLIANT TO DRIVE ADOPTION OF TWO-FACTOR AUTHENTICATION
TABLE 33 TWO-FACTOR AUTHENTICATION: MULTI-FACTOR AUTHENTICATION MARKET, BY REGION, 2017–2022 (USD MILLION)
TABLE 34 TWO-FACTOR AUTHENTICATION: MULTI-FACTOR AUTHENTICATION MARKET, BY REGION, 2023–2028 (USD MILLION)
TABLE 35 TWO-FACTOR AUTHENTICATION: MULTI-FACTOR AUTHENTICATION MARKET, BY TYPE, 2017–2022 (USD MILLION)
TABLE 36 TWO-FACTOR AUTHENTICATION: MULTI-FACTOR AUTHENTICATION MARKET, BY TYPE, 2023–2028 (USD MILLION)
8.2.2 SMART CARD WITH PIN
8.2.2.1 Need for high level of security and protect sensitive consumer and company data with smart cards and PINs to drive market
TABLE 37 TWO-FACTOR AUTHENTICATION: SMART CARD WITH PIN MARKET, BY REGION, 2017–2022 (USD MILLION)
TABLE 38 TWO-FACTOR AUTHENTICATION: SMART CARD WITH PIN MARKET, BY REGION, 2023–2028 (USD MILLION)
8.2.3 SMART CARD WITH BIOMETRIC TECHNOLOGY
8.2.3.1 Smart cards with biometric technology to control access to buildings, secure areas, and IT systems
TABLE 39 TWO-FACTOR AUTHENTICATION: SMART CARD WITH BIOMETRIC TECHNOLOGY MARKET, BY REGION, 2017–2022 (USD MILLION)
TABLE 40 TWO-FACTOR AUTHENTICATION: SMART CARD WITH BIOMETRIC TECHNOLOGY MARKET, BY REGION, 2023–2028 (USD MILLION)
8.2.4 BIOMETRIC TECHNOLOGY WITH PIN
8.2.4.1 Biometric technology with PIN to be used for various financial applications
TABLE 41 TWO-FACTOR AUTHENTICATION: BIOMETRIC TECHNOLOGY WITH PIN MARKET, BY REGION, 2017–2022 (USD MILLION)
TABLE 42 TWO-FACTOR AUTHENTICATION: BIOMETRIC TECHNOLOGY WITH PIN MARKET, BY REGION, 2023–2028 (USD MILLION)
8.2.5 TWO-FACTOR BIOMETRIC TECHNOLOGY
8.2.5.1 Two-factor biometric technology to safeguard assets and maintain trust
TABLE 43 TWO-FACTOR AUTHENTICATION: TWO-FACTOR BIOMETRIC TECHNOLOGY MARKET, BY REGION, 2017–2022 (USD MILLION)
TABLE 44 TWO-FACTOR AUTHENTICATION: TWO-FACTOR BIOMETRIC TECHNOLOGY MARKET, BY REGION, 2023–2028 (USD MILLION)
8.2.6 ONE-TIME PASSWORD WITH PIN
8.2.6.1 OTP with PIN to secure access to corporate systems and mobile apps
TABLE 45 TWO-FACTOR AUTHENTICATION: ONE-TIME PASSWORD WITH PIN MARKET, BY REGION, 2017–2022 (USD MILLION)
TABLE 46 TWO-FACTOR AUTHENTICATION: ONE-TIME PASSWORD WITH PIN MARKET, BY REGION, 2023–2028 (USD MILLION)
8.3 THREE-FACTOR AUTHENTICATION
8.3.1 INCREASING CLOUD COMPUTING USAGE TO DRIVE ADOPTION OF THREE-FACTOR AUTHENTICATION
TABLE 47 THREE-FACTOR AUTHENTICATION: MULTI-FACTOR AUTHENTICATION MARKET, BY REGION, 2017–2022 (USD MILLION)
TABLE 48 THREE-FACTOR AUTHENTICATION: MULTI-FACTOR AUTHENTICATION MARKET, BY REGION, 2023–2028 (USD MILLION)
TABLE 49 THREE-FACTOR AUTHENTICATION: MULTI-FACTOR AUTHENTICATION MARKET, BY TYPE, 2017–2022 (USD MILLION)
TABLE 50 THREE-FACTOR AUTHENTICATION: MULTI-FACTOR AUTHENTICATION MARKET, BY TYPE, 2023–2028 (USD MILLION)
8.3.2 SMART CARD WITH PIN AND BIOMETRIC TECHNOLOGY
8.3.2.1 High resilience to various forms of attacks, including phishing, credential theft, and identity fraud, to drive market
TABLE 51 THREE-FACTOR AUTHENTICATION: SMART CARD WITH PIN AND BIOMETRIC TECHNOLOGY MARKET, BY REGION, 2017–2022 (USD MILLION)
TABLE 52 THREE-FACTOR AUTHENTICATION: SMART CARD WITH PIN AND BIOMETRIC TECHNOLOGY MARKET, BY REGION, 2023–2028 (USD MILLION)
8.3.3 SMART CARD WITH TWO-FACTOR BIOMETRIC TECHNOLOGY
8.3.3.1 Need for handling sensitive data in healthcare and finance and preventing data breaches to drive demand for smart card
TABLE 53 THREE-FACTOR AUTHENTICATION: SMART CARD WITH TWO-FACTOR BIOMETRIC TECHNOLOGY MARKET, BY REGION, 2017–2022 (USD MILLION)
TABLE 54 THREE-FACTOR AUTHENTICATION: SMART CARD WITH TWO-FACTOR BIOMETRIC TECHNOLOGY MARKET, BY REGION, 2023–2028 (USD MILLION)
8.3.4 PIN WITH TWO-FACTOR BIOMETRIC TECHNOLOGY
8.3.4.1 Need for superior security, compliance with legal requirements, and durability against online threats to drive market
TABLE 55 THREE-FACTOR AUTHENTICATION: PIN WITH TWO-FACTOR BIOMETRIC TECHNOLOGY MARKET, BY REGION, 2017–2022 (USD MILLION)
TABLE 56 THREE-FACTOR AUTHENTICATION: PIN WITH TWO-FACTOR BIOMETRIC TECHNOLOGY MARKET, BY REGION, 2023–2028 (USD MILLION)
8.3.5 THREE-FACTOR BIOMETRIC TECHNOLOGY
8.3.5.1 Three-factor biometric technology to impersonate legitimate users and reduce risk of identity theft
TABLE 57 THREE-FACTOR AUTHENTICATION: THREE-FACTOR BIOMETRIC TECHNOLOGY MARKET, BY REGION, 2017–2022 (USD MILLION)
TABLE 58 THREE-FACTOR AUTHENTICATION: THREE-FACTOR BIOMETRIC TECHNOLOGY MARKET, BY REGION, 2023–2028 (USD MILLION)
8.4 FOUR-FACTOR AUTHENTICATION
8.4.1 NEED TO LEVERAGE FOUR DISTINCT AUTHENTICATION FACTORS TO VERIFY USER IDENTITY AND ENHANCE SECURITY TO UNPRECEDENTED LEVELS
TABLE 59 FOUR-FACTOR AUTHENTICATION: MULTI-FACTOR AUTHENTICATION MARKET, BY REGION, 2017–2022 (USD MILLION)
TABLE 60 FOUR-FACTOR AUTHENTICATION: MULTI-FACTOR AUTHENTICATION MARKET, BY REGION, 2023–2028 (USD MILLION)
8.5 FIVE-FACTOR AUTHENTICATION
8.5.1 5FA TO OFFER HIGH LEVEL OF SECURITY TO SAFEGUARD DATA AND TECHNOLOGY
TABLE 61 FIVE-FACTOR AUTHENTICATION: MULTI-FACTOR AUTHENTICATION MARKET, BY REGION, 2017–2022 (USD MILLION)
TABLE 62 FIVE-FACTOR AUTHENTICATION: MULTI-FACTOR AUTHENTICATION MARKET, BY REGION, 2023–2028 (USD MILLION)
9 MULTI-FACTOR AUTHENTICATION MARKET, BY END-USE INDUSTRY (Page No. - 125)
9.1 INTRODUCTION
9.1.1 END-USE INDUSTRY: MULTI-FACTOR AUTHENTICATION MARKET DRIVERS
FIGURE 29 BFSI SEGMENT TO HOLD LARGEST MARKET SIZE DURING FORECAST PERIOD
TABLE 63 MULTI-FACTOR AUTHENTICATION MARKET, BY END-USE INDUSTRY, 2017–2022 (USD MILLION)
TABLE 64 MULTI-FACTOR AUTHENTICATION MARKET, BY END-USE INDUSTRY, 2023–2028 (USD MILLION)
9.2 BFSI
9.2.1 NEED TO PROTECT HIGHLY CONFIDENTIAL INFORMATION AND HELP SECURE GOVERNMENT DATA TO DRIVE MARKET
TABLE 65 BFSI: MULTI-FACTOR AUTHENTICATION MARKET, BY REGION, 2017–2022 (USD MILLION)
TABLE 66 BFSI: MULTI-FACTOR AUTHENTICATION MARKET, BY REGION, 2023–2028 (USD MILLION)
9.3 GOVERNMENT
9.3.1 DIGITALIZATION OF GOVERNMENT AND DEFENSE PROCESSES AND SAFEGUARD GOVERNMENT DATA FROM BREACHES TO DRIVE MARKET
TABLE 67 GOVERNMENT: MULTI-FACTOR AUTHENTICATION MARKET, BY REGION, 2017–2022 (USD MILLION)
TABLE 68 GOVERNMENT: MULTI-FACTOR AUTHENTICATION MARKET, BY REGION, 2023–2028 (USD MILLION)
9.4 TRAVEL & IMMIGRATION
9.4.1 MULTI-FACTOR AUTHENTICATION TO CAPTURE, MANAGE, AND APPLY IDENTITY DATA ACROSS DIGITAL CHANNELS
TABLE 69 TRAVEL & IMMIGRATION: MULTI-FACTOR AUTHENTICATION MARKET, BY REGION, 2017–2022 (USD MILLION)
TABLE 70 TRAVEL & IMMIGRATION: MULTI-FACTOR AUTHENTICATION MARKET, BY REGION, 2023–2028 (USD MILLION)
9.5 MILITARY & DEFENSE
9.5.1 DEFENSE SEGMENT TO UTILIZE BIOMETRICS TO TACKLE CYBERATTACKS
TABLE 71 MILITARY & DEFENSE: MULTI-FACTOR AUTHENTICATION MARKET, BY REGION, 2017–2022 (USD MILLION)
TABLE 72 MILITARY & DEFENSE: MULTI-FACTOR AUTHENTICATION MARKET, BY REGION, 2023–2028 (USD MILLION)
9.6 COMMERCIAL SECURITY
9.6.1 ORGANIZATIONS TO SAFEGUARD CLIENT DATA AND ASSETS WITH MULTI-FACTOR AUTHENTICATION
TABLE 73 COMMERCIAL SECURITY: MULTI-FACTOR AUTHENTICATION MARKET, BY REGION, 2017–2022 (USD MILLION)
TABLE 74 COMMERCIAL SECURITY: MULTI-FACTOR AUTHENTICATION MARKET, BY REGION, 2023–2028 (USD MILLION)
9.7 HEALTHCARE
9.7.1 MULTI-FACTOR AUTHENTICATION SOLUTIONS TO ADDRESS DATA SECURITY, PATIENT SAFETY, AND PRODUCTIVITY
TABLE 75 HEALTHCARE: MULTI-FACTOR AUTHENTICATION MARKET, BY REGION, 2017–2022 (USD MILLION)
TABLE 76 HEALTHCARE: MULTI-FACTOR AUTHENTICATION MARKET, BY REGION, 2023–2028 (USD MILLION)
9.8 IT & ITES
9.8.1 RAPID ADOPTION IN WFH POLICY AND FOCUS ON MAINTAINING SECURITY OF HYBRID IT ENVIRONMENTS TO DRIVE MARKET
TABLE 77 IT & ITES: MULTI-FACTOR AUTHENTICATION MARKET, BY REGION, 2017–2022 (USD MILLION)
TABLE 78 IT & ITES: MULTI-FACTOR AUTHENTICATION MARKET, BY REGION, 2023–2028 (USD MILLION)
9.9 TELECOM
9.9.1 ADVENT OF 5G TECHNOLOGY AND INTERNET OF THINGS TO DRIVE MARKET
TABLE 79 TELECOM: MULTI-FACTOR AUTHENTICATION MARKET, BY REGION, 2017–2022 (USD MILLION)
TABLE 80 TELECOM: MULTI-FACTOR AUTHENTICATION MARKET, BY REGION, 2023–2028 (USD MILLION)
9.10 MEDIA & ENTERTAINMENT
9.10.1 MULTI-FACTOR AUTHENTICATION TO SECURE VALUABLE INTELLECTUAL PROPERTY
TABLE 81 MEDIA & ENTERTAINMENT: MULTI-FACTOR AUTHENTICATION MARKET, BY REGION, 2017–2022 (USD MILLION)
TABLE 82 MEDIA & ENTERTAINMENT: MULTI-FACTOR AUTHENTICATION MARKET, BY REGION, 2023–2028 (USD MILLION)
9.11 OTHER END-USE INDUSTRIES
TABLE 83 OTHER END-USE INDUSTRIES: MULTI-FACTOR AUTHENTICATION MARKET, BY REGION, 2017–2022 (USD MILLION)
TABLE 84 OTHER END-USE INDUSTRIES: MULTI-FACTOR AUTHENTICATION MARKET, BY REGION, 2023–2028 (USD MILLION)
10 MULTI-FACTOR AUTHENTICATION MARKET, BY REGION (Page No. - 140)
10.1 INTRODUCTION
FIGURE 30 ASIA PACIFIC TO GROW AT HIGHEST CAGR DURING FORECAST PERIOD
TABLE 85 MULTI-FACTOR AUTHENTICATION MARKET, BY REGION, 2017–2022 (USD MILLION)
TABLE 86 MULTI-FACTOR AUTHENTICATION MARKET, BY REGION, 2023–2028 (USD MILLION)
10.2 NORTH AMERICA
10.2.1 NORTH AMERICA: MULTI-FACTOR AUTHENTICATION MARKET DRIVERS
10.2.2 NORTH AMERICA: RECESSION IMPACT
10.2.3 NORTH AMERICA: REGULATORY LANDSCAPE
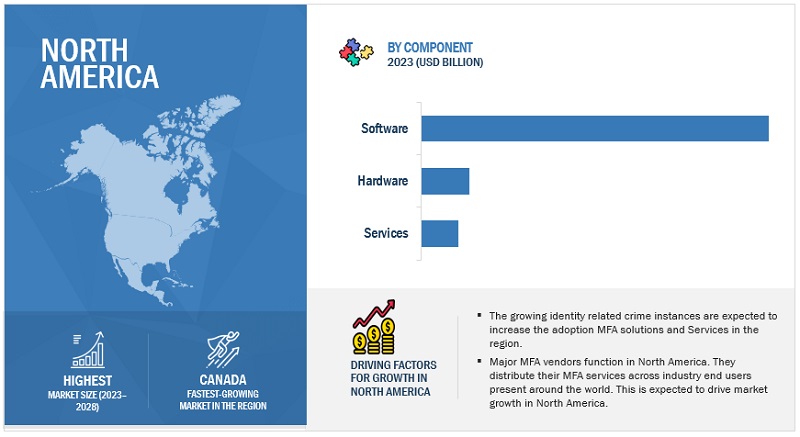
FIGURE 31 NORTH AMERICA: MARKET SNAPSHOT
TABLE 87 NORTH AMERICA: MULTI-FACTOR AUTHENTICATION MARKET, BY AUTHENTICATION TYPE, 2017–2022 (USD MILLION)
TABLE 88 NORTH AMERICA: MULTI-FACTOR AUTHENTICATION MARKET, BY AUTHENTICATION TYPE, 2023–2028 (USD MILLION)
TABLE 89 NORTH AMERICA: MULTI-FACTOR AUTHENTICATION MARKET, BY COMPONENT, 2017–2022 (USD MILLION)
TABLE 90 NORTH AMERICA: MULTI-FACTOR AUTHENTICATION MARKET, BY COMPONENT, 2023–2028 (USD MILLION)
TABLE 91 NORTH AMERICA: MULTI-FACTOR AUTHENTICATION MARKET, BY MODEL TYPE, 2017–2022 (USD MILLION)
TABLE 92 NORTH AMERICA: MULTI-FACTOR AUTHENTICATION MARKET, BY MODEL TYPE, 2023–2028 (USD MILLION)
TABLE 93 NORTH AMERICA: MULTI-FACTOR AUTHENTICATION MARKET, BY TWO-FACTOR AUTHENTICATION, 2017–2022 (USD MILLION)
TABLE 94 NORTH AMERICA: MULTI-FACTOR AUTHENTICATION MARKET, BY TWO-FACTOR AUTHENTICATION, 2023–2028 (USD MILLION)
TABLE 95 NORTH AMERICA: MULTI-FACTOR AUTHENTICATION MARKET, BY THREE-FACTOR AUTHENTICATION, 2017–2022 (USD MILLION)
TABLE 96 NORTH AMERICA: MULTI-FACTOR AUTHENTICATION MARKET, BY THREE-FACTOR AUTHENTICATION, 2023–2028 (USD MILLION)
TABLE 97 NORTH AMERICA: MULTI-FACTOR AUTHENTICATION MARKET, BY END-USE INDUSTRY, 2017–2022 (USD MILLION)
TABLE 98 NORTH AMERICA: MULTI-FACTOR AUTHENTICATION MARKET, BY END-USE INDUSTRY, 2023–2028 (USD MILLION)
TABLE 99 NORTH AMERICA: MULTI-FACTOR AUTHENTICATION MARKET, BY COUNTRY, 2017–2022 (USD MILLION)
TABLE 100 NORTH AMERICA: MULTI-FACTOR AUTHENTICATION MARKET, BY COUNTRY, 2023–2028 (USD MILLION)
10.2.4 US
10.2.4.1 Presence of stringent laws, growing internet penetration, and government initiatives to adopt MFA to drive market
TABLE 101 US: MULTI-FACTOR AUTHENTICATION MARKET, BY AUTHENTICATION TYPE, 2017–2022 (USD MILLION)
TABLE 102 US: MULTI-FACTOR AUTHENTICATION MARKET, BY AUTHENTICATION TYPE, 2023–2028 (USD MILLION)
TABLE 103 US: MULTI-FACTOR AUTHENTICATION MARKET, BY COMPONENT, 2017–2022 (USD MILLION)
TABLE 104 US: MULTI-FACTOR AUTHENTICATION MARKET, BY COMPONENT, 2023–2028 (USD MILLION)
TABLE 105 US: MULTI-FACTOR AUTHENTICATION MARKET, BY MODEL TYPE, 2017–2022 (USD MILLION)
TABLE 106 US: MULTI-FACTOR AUTHENTICATION MARKET, BY MODEL TYPE, 2023–2028 (USD MILLION)
TABLE 107 US: MULTI-FACTOR AUTHENTICATION MARKET, BY END-USE INDUSTRY, 2017–2022 (USD MILLION)
TABLE 108 US: MULTI-FACTOR AUTHENTICATION MARKET, BY END-USE INDUSTRY, 2023–2028 (USD MILLION)
10.2.5 CANADA
10.2.5.1 Increased occurrence of online fraud, terrorist attacks, and bad bot attacks to drive market
TABLE 109 CANADA: MULTI-FACTOR AUTHENTICATION MARKET, BY AUTHENTICATION TYPE, 2017–2022 (USD MILLION)
TABLE 110 CANADA: MULTI-FACTOR AUTHENTICATION MARKET, BY AUTHENTICATION TYPE, 2023–2028 (USD MILLION)
TABLE 111 CANADA: MULTI-FACTOR AUTHENTICATION MARKET, BY COMPONENT, 2017–2022 (USD MILLION)
TABLE 112 CANADA: MULTI-FACTOR AUTHENTICATION MARKET, BY COMPONENT, 2023–2028 (USD MILLION)
TABLE 113 CANADA: MULTI-FACTOR AUTHENTICATION MARKET, BY MODEL TYPE, 2017–2022 (USD MILLION)
TABLE 114 CANADA: MULTI-FACTOR AUTHENTICATION MARKET, BY MODEL TYPE, 2023–2028 (USD MILLION)
TABLE 115 CANADA: MULTI-FACTOR AUTHENTICATION MARKET, BY END-USE INDUSTRY, 2017–2022 (USD MILLION)
TABLE 116 CANADA: MULTI-FACTOR AUTHENTICATION MARKET, BY END-USE INDUSTRY, 2023–2028 (USD MILLION)
10.3 EUROPE
10.3.1 EUROPE: MULTI-FACTOR AUTHENTICATION MARKET DRIVERS
10.3.2 EUROPE: RECESSION IMPACT
10.3.3 EUROPE: REGULATORY LANDSCAPE
TABLE 117 EUROPE: MULTI-FACTOR AUTHENTICATION MARKET, BY AUTHENTICATION TYPE, 2017–2022 (USD MILLION)
TABLE 118 EUROPE: MULTI-FACTOR AUTHENTICATION MARKET, BY AUTHENTICATION TYPE, 2023–2028 (USD MILLION)
TABLE 119 EUROPE: MULTI-FACTOR AUTHENTICATION MARKET, BY COMPONENT, 2017–2022 (USD MILLION)
TABLE 120 EUROPE: MULTI-FACTOR AUTHENTICATION MARKET, BY COMPONENT, 2023–2028 (USD MILLION)
TABLE 121 EUROPE: MULTI-FACTOR AUTHENTICATION MARKET, BY MODEL TYPE, 2017–2022 (USD MILLION)
TABLE 122 EUROPE: MULTI-FACTOR AUTHENTICATION MARKET, BY MODEL TYPE, 2023–2028 (USD MILLION)
TABLE 123 EUROPE: MULTI-FACTOR AUTHENTICATION MARKET, BY TWO-FACTOR AUTHENTICATION, 2017–2022 (USD MILLION)
TABLE 124 EUROPE: MULTI-FACTOR AUTHENTICATION MARKET, BY TWO-FACTOR AUTHENTICATION, 2023–2028 (USD MILLION)
TABLE 125 EUROPE: MULTI-FACTOR AUTHENTICATION MARKET, BY THREE-FACTOR AUTHENTICATION, 2017–2022 (USD MILLION)
TABLE 126 EUROPE: MULTI-FACTOR AUTHENTICATION MARKET, BY THREE-FACTOR AUTHENTICATION, 2023–2028 (USD MILLION)
TABLE 127 EUROPE: MULTI-FACTOR AUTHENTICATION MARKET, BY END-USE INDUSTRY, 2017–2022 (USD MILLION)
TABLE 128 EUROPE: MULTI-FACTOR AUTHENTICATION MARKET, BY END-USE INDUSTRY, 2023–2028 (USD MILLION)
TABLE 129 EUROPE: MULTI-FACTOR AUTHENTICATION MARKET, BY COUNTRY, 2017–2022 (USD MILLION)
TABLE 130 EUROPE: MULTI-FACTOR AUTHENTICATION MARKET, BY COUNTRY, 2023–2028 (USD MILLION)
10.3.4 UK
10.3.4.1 Increasing identity fraud to boost adoption of MFA
TABLE 131 UK: MULTI-FACTOR AUTHENTICATION MARKET, BY AUTHENTICATION TYPE, 2017–2022 (USD MILLION)
TABLE 132 UK: MULTI-FACTOR AUTHENTICATION MARKET, BY AUTHENTICATION TYPE, 2023–2028 (USD MILLION)
TABLE 133 UK: MULTI-FACTOR AUTHENTICATION MARKET, BY COMPONENT, 2017–2022 (USD MILLION)
TABLE 134 UK: MULTI-FACTOR AUTHENTICATION MARKET, BY COMPONENT, 2023–2028 (USD MILLION)
TABLE 135 UK: MULTI-FACTOR AUTHENTICATION MARKET, BY MODEL TYPE, 2017–2022 (USD MILLION)
TABLE 136 UK: MULTI-FACTOR AUTHENTICATION MARKET, BY MODEL TYPE, 2023–2028 (USD MILLION)
TABLE 137 UK: MULTI-FACTOR AUTHENTICATION MARKET, BY END-USE INDUSTRY, 2017–2022 (USD MILLION)
TABLE 138 UK: MULTI-FACTOR AUTHENTICATION MARKET, BY END-USE INDUSTRY, 2023–2028 (USD MILLION)
10.3.5 GERMANY
10.3.5.1 Rising innovative technologies and need to combat financial crimes to drive market
TABLE 139 GERMANY: MULTI-FACTOR AUTHENTICATION MARKET, BY AUTHENTICATION TYPE, 2017–2022 (USD MILLION)
TABLE 140 GERMANY: MULTI-FACTOR AUTHENTICATION MARKET, BY AUTHENTICATION TYPE, 2023–2028 (USD MILLION)
TABLE 141 GERMANY: MULTI-FACTOR AUTHENTICATION MARKET, BY COMPONENT, 2017–2022 (USD MILLION)
TABLE 142 GERMANY: MULTI-FACTOR AUTHENTICATION MARKET, BY COMPONENT, 2023–2028 (USD MILLION)
TABLE 143 GERMANY: MULTI-FACTOR AUTHENTICATION MARKET, BY MODEL TYPE, 2017–2022 (USD MILLION)
TABLE 144 GERMANY: MULTI-FACTOR AUTHENTICATION MARKET, BY MODEL TYPE, 2023–2028 (USD MILLION)
TABLE 145 GERMANY: MULTI-FACTOR AUTHENTICATION MARKET, BY END-USE INDUSTRY, 2017–2022 (USD MILLION)
TABLE 146 GERMANY: MULTI-FACTOR AUTHENTICATION MARKET, BY END-USE INDUSTRY, 2023–2028 (USD MILLION)
10.3.6 FRANCE
10.3.6.1 Guidelines of French Data Protection Authority to adopt MFA to drive market
TABLE 147 FRANCE: MULTI-FACTOR AUTHENTICATION MARKET, BY AUTHENTICATION TYPE, 2017–2022 (USD MILLION)
TABLE 148 FRANCE: MULTI-FACTOR AUTHENTICATION MARKET, BY AUTHENTICATION TYPE, 2023–2028 (USD MILLION)
TABLE 149 FRANCE: MULTI-FACTOR AUTHENTICATION MARKET, BY COMPONENT, 2017–2022 (USD MILLION)
TABLE 150 FRANCE: MULTI-FACTOR AUTHENTICATION MARKET, BY COMPONENT, 2023–2028 (USD MILLION)
TABLE 151 FRANCE: MULTI-FACTOR AUTHENTICATION MARKET, BY MODEL TYPE, 2017–2022 (USD MILLION)
TABLE 152 FRANCE: MULTI-FACTOR AUTHENTICATION MARKET, BY MODEL TYPE, 2023–2028 (USD MILLION)
TABLE 153 FRANCE: MULTI-FACTOR AUTHENTICATION MARKET, BY END-USE INDUSTRY, 2017–2022 (USD MILLION)
TABLE 154 FRANCE: MULTI-FACTOR AUTHENTICATION MARKET, BY END-USE INDUSTRY, 2023–2028 (USD MILLION)
10.3.7 ITALY
10.3.7.1 Consistent growth in cybersecurity and need to comply with GDPR to drive market
TABLE 155 ITALY: MULTI-FACTOR AUTHENTICATION MARKET, BY AUTHENTICATION TYPE, 2017–2022 (USD MILLION)
TABLE 156 ITALY: MULTI-FACTOR AUTHENTICATION MARKET, BY AUTHENTICATION TYPE, 2023–2028 (USD MILLION)
TABLE 157 ITALY: MULTI-FACTOR AUTHENTICATION MARKET, BY COMPONENT, 2017–2022 (USD MILLION)
TABLE 158 ITALY: MULTI-FACTOR AUTHENTICATION MARKET, BY COMPONENT, 2023–2028 (USD MILLION)
TABLE 159 ITALY: MULTI-FACTOR AUTHENTICATION MARKET, BY MODEL TYPE, 2017–2022 (USD MILLION)
TABLE 160 ITALY: MULTI-FACTOR AUTHENTICATION MARKET, BY MODEL TYPE, 2023–2028 (USD MILLION)
TABLE 161 ITALY: MULTI-FACTOR AUTHENTICATION MARKET, BY END-USE INDUSTRY, 2017–2022 (USD MILLION)
TABLE 162 ITALY: MULTI-FACTOR AUTHENTICATION MARKET, BY END-USE INDUSTRY, 2023–2028 (USD MILLION)
10.3.8 REST OF EUROPE
TABLE 163 REST OF EUROPE: MULTI-FACTOR AUTHENTICATION MARKET, BY AUTHENTICATION TYPE, 2017–2022 (USD MILLION)
TABLE 164 REST OF EUROPE: MULTI-FACTOR AUTHENTICATION MARKET, BY AUTHENTICATION TYPE, 2023–2028 (USD MILLION)
TABLE 165 REST OF EUROPE: MULTI-FACTOR AUTHENTICATION MARKET, BY COMPONENT, 2017–2022 (USD MILLION)
TABLE 166 REST OF EUROPE: MULTI-FACTOR AUTHENTICATION MARKET, BY COMPONENT, 2023–2028 (USD MILLION)
TABLE 167 REST OF EUROPE: MULTI-FACTOR AUTHENTICATION MARKET, BY MODEL TYPE, 2017–2022 (USD MILLION)
TABLE 168 REST OF EUROPE: MULTI-FACTOR AUTHENTICATION MARKET, BY MODEL TYPE, 2023–2028 (USD MILLION)
TABLE 169 REST OF EUROPE: MULTI-FACTOR AUTHENTICATION MARKET, BY END-USE INDUSTRY, 2017–2022 (USD MILLION)
TABLE 170 REST OF EUROPE: MULTI-FACTOR AUTHENTICATION MARKET, BY END-USE INDUSTRY, 2023–2028 (USD MILLION)
10.4 ASIA PACIFIC
10.4.1 ASIA PACIFIC: MULTI-FACTOR AUTHENTICATION MARKET DRIVERS
10.4.2 ASIA PACIFIC: RECESSION IMPACT
10.4.3 ASIA PACIFIC: REGULATORY LANDSCAPE
FIGURE 32 ASIA PACIFIC: MARKET SNAPSHOT
TABLE 171 ASIA PACIFIC: MULTI-FACTOR AUTHENTICATION MARKET, BY AUTHENTICATION TYPE, 2017–2022 (USD MILLION)
TABLE 172 ASIA PACIFIC: MULTI-FACTOR AUTHENTICATION MARKET, BY AUTHENTICATION TYPE, 2023–2028 (USD MILLION)
TABLE 173 ASIA PACIFIC: MULTI-FACTOR AUTHENTICATION MARKET, BY COMPONENT, 2017–2022 (USD MILLION)
TABLE 174 ASIA PACIFIC: MULTI-FACTOR AUTHENTICATION MARKET, BY COMPONENT, 2023–2028 (USD MILLION)
TABLE 175 ASIA PACIFIC: MULTI-FACTOR AUTHENTICATION MARKET, BY MODEL TYPE, 2017–2022 (USD MILLION)
TABLE 176 ASIA PACIFIC: MULTI-FACTOR AUTHENTICATION MARKET, BY MODEL TYPE, 2023–2028 (USD MILLION)
TABLE 177 ASIA PACIFIC: MULTI-FACTOR AUTHENTICATION MARKET, BY TWO-FACTOR AUTHENTICATION, 2017–2022 (USD MILLION)
TABLE 178 ASIA PACIFIC: MULTI-FACTOR AUTHENTICATION MARKET, BY TWO-FACTOR AUTHENTICATION, 2023–2028 (USD MILLION)
TABLE 179 ASIA PACIFIC: MULTI-FACTOR AUTHENTICATION MARKET, BY THREE-FACTOR AUTHENTICATION, 2017–2022 (USD MILLION)
TABLE 180 ASIA PACIFIC: MULTI-FACTOR AUTHENTICATION MARKET, BY THREE-FACTOR AUTHENTICATION, 2023–2028 (USD MILLION)
TABLE 181 ASIA PACIFIC: MULTI-FACTOR AUTHENTICATION MARKET, BY END-USE INDUSTRY, 2017–2022 (USD MILLION)
TABLE 182 ASIA PACIFIC: MULTI-FACTOR AUTHENTICATION MARKET, BY END-USE INDUSTRY, 2023–2028 (USD MILLION)
TABLE 183 ASIA PACIFIC: MULTI-FACTOR AUTHENTICATION MARKET, BY COUNTRY, 2017–2022 (USD MILLION)
TABLE 184 ASIA PACIFIC: MULTI-FACTOR AUTHENTICATION MARKET, BY COUNTRY, 2023–2028 (USD MILLION)
10.4.4 AUSTRALIA
10.4.4.1 Need to safeguard data, websites, and mobile applications and focus of Australian TPB to enhance its online portal with MFA to drive market
TABLE 185 AUSTRALIA: MULTI-FACTOR AUTHENTICATION MARKET, BY AUTHENTICATION TYPE, 2017–2022 (USD MILLION)
TABLE 186 AUSTRALIA: MULTI-FACTOR AUTHENTICATION MARKET, BY AUTHENTICATION TYPE, 2023–2028 (USD MILLION)
TABLE 187 AUSTRALIA: MULTI-FACTOR AUTHENTICATION MARKET, BY COMPONENT, 2017–2022 (USD MILLION)
TABLE 188 AUSTRALIA: MULTI-FACTOR AUTHENTICATION MARKET, BY COMPONENT, 2023–2028 (USD MILLION)
TABLE 189 AUSTRALIA: MULTI-FACTOR AUTHENTICATION MARKET, BY MODEL TYPE, 2017–2022 (USD MILLION)
TABLE 190 AUSTRALIA: MULTI-FACTOR AUTHENTICATION MARKET, BY MODEL TYPE, 2023–2028 (USD MILLION)
TABLE 191 AUSTRALIA: MULTI-FACTOR AUTHENTICATION MARKET, BY END-USE INDUSTRY, 2017–2022 (USD MILLION)
TABLE 192 AUSTRALIA: MULTI-FACTOR AUTHENTICATION MARKET, BY END-USE INDUSTRY, 2023–2028 (USD MILLION)
10.4.5 INDIA
10.4.5.1 Personal Data Protection Act to strengthen data privacy across all FIs to drive demand for MFA
TABLE 193 INDIA: MULTI-FACTOR AUTHENTICATION MARKET, BY AUTHENTICATION TYPE, 2017–2022 (USD MILLION)
TABLE 194 INDIA: MULTI-FACTOR AUTHENTICATION MARKET, BY AUTHENTICATION TYPE, 2023–2028 (USD MILLION)
TABLE 195 INDIA: MULTI-FACTOR AUTHENTICATION MARKET, BY COMPONENT, 2017–2022 (USD MILLION)
TABLE 196 INDIA: MULTI-FACTOR AUTHENTICATION MARKET, BY COMPONENT, 2023–2028 (USD MILLION)
TABLE 197 INDIA: MULTI-FACTOR AUTHENTICATION MARKET, BY MODEL TYPE, 2017–2022 (USD MILLION)
TABLE 198 INDIA: MULTI-FACTOR AUTHENTICATION MARKET, BY MODEL TYPE, 2023–2028 (USD MILLION)
TABLE 199 INDIA: MULTI-FACTOR AUTHENTICATION MARKET, BY END-USE INDUSTRY, 2017–2022 (USD MILLION)
TABLE 200 INDIA: MULTI-FACTOR AUTHENTICATION MARKET, BY END-USE INDUSTRY, 2023–2028 (USD MILLION)
10.4.6 CHINA
10.4.6.1 Surge in mobile commerce and digital payment platforms to drive growth of MFA
TABLE 201 CHINA: MULTI-FACTOR AUTHENTICATION MARKET, BY AUTHENTICATION TYPE, 2017–2022 (USD MILLION)
TABLE 202 CHINA: MULTI-FACTOR AUTHENTICATION MARKET, BY AUTHENTICATION TYPE, 2023–2028 (USD MILLION)
TABLE 203 CHINA: MULTI-FACTOR AUTHENTICATION MARKET, BY COMPONENT, 2017–2022 (USD MILLION)
TABLE 204 CHINA: MULTI-FACTOR AUTHENTICATION MARKET, BY COMPONENT, 2023–2028 (USD MILLION)
TABLE 205 CHINA: MULTI-FACTOR AUTHENTICATION MARKET, BY MODEL TYPE, 2017–2022 (USD MILLION)
TABLE 206 CHINA: MULTI-FACTOR AUTHENTICATION MARKET, BY MODEL TYPE, 2023–2028 (USD MILLION)
TABLE 207 CHINA: MULTI-FACTOR AUTHENTICATION MARKET, BY END-USE INDUSTRY, 2017–2022 (USD MILLION)
TABLE 208 CHINA: MULTI-FACTOR AUTHENTICATION MARKET, BY END-USE INDUSTRY, 2023–2028 (USD MILLION)
10.4.7 JAPAN
10.4.7.1 Strong technological base and focus on data protection and government support to drive market
TABLE 209 JAPAN: MULTI-FACTOR AUTHENTICATION MARKET, BY AUTHENTICATION TYPE, 2017–2022 (USD MILLION)
TABLE 210 JAPAN: MULTI-FACTOR AUTHENTICATION MARKET, BY AUTHENTICATION TYPE, 2023–2028 (USD MILLION)
TABLE 211 JAPAN: MULTI-FACTOR AUTHENTICATION MARKET, BY COMPONENT, 2017–2022 (USD MILLION)
TABLE 212 JAPAN: MULTI-FACTOR AUTHENTICATION MARKET, BY COMPONENT, 2023–2028 (USD MILLION)
TABLE 213 JAPAN: MULTI-FACTOR AUTHENTICATION MARKET, BY MODEL TYPE, 2017–2022 (USD MILLION)
TABLE 214 JAPAN: MULTI-FACTOR AUTHENTICATION MARKET, BY MODEL TYPE, 2023–2028 (USD MILLION)
TABLE 215 JAPAN: MULTI-FACTOR AUTHENTICATION MARKET, BY END-USE INDUSTRY, 2017–2022 (USD MILLION)
TABLE 216 JAPAN: MULTI-FACTOR AUTHENTICATION MARKET, BY END-USE INDUSTRY, 2023–2028 (USD MILLION)
10.4.8 REST OF ASIA PACIFIC
TABLE 217 REST OF ASIA PACIFIC: MULTI-FACTOR AUTHENTICATION MARKET, BY AUTHENTICATION TYPE, 2017–2022 (USD MILLION)
TABLE 218 REST OF ASIA PACIFIC: MULTI-FACTOR AUTHENTICATION MARKET, BY AUTHENTICATION TYPE, 2023–2028 (USD MILLION)
TABLE 219 REST OF ASIA PACIFIC: MULTI-FACTOR AUTHENTICATION MARKET, BY COMPONENT, 2017–2022 (USD MILLION)
TABLE 220 REST OF ASIA PACIFIC: MULTI-FACTOR AUTHENTICATION MARKET, BY COMPONENT, 2023–2028 (USD MILLION)
TABLE 221 REST OF ASIA PACIFIC: MULTI-FACTOR AUTHENTICATION MARKET, BY MODEL TYPE, 2017–2022 (USD MILLION)
TABLE 222 REST OF ASIA PACIFIC: MULTI-FACTOR AUTHENTICATION MARKET, BY MODEL TYPE, 2023–2028 (USD MILLION)
TABLE 223 REST OF ASIA PACIFIC: MULTI-FACTOR AUTHENTICATION MARKET, BY END-USE INDUSTRY, 2017–2022 (USD MILLION)
TABLE 224 REST OF ASIA PACIFIC: MULTI-FACTOR AUTHENTICATION MARKET, BY END-USE INDUSTRY, 2023–2028 (USD MILLION)
10.5 MIDDLE EAST & AFRICA
10.5.1 MIDDLE EAST & AFRICA: MULTI-FACTOR AUTHENTICATION MARKET DRIVERS
10.5.2 MIDDLE EAST & AFRICA: RECESSION IMPACT
10.5.3 MIDDLE EAST & AFRICA: REGULATORY LANDSCAPE
TABLE 225 MIDDLE EAST & AFRICA: MULTI-FACTOR AUTHENTICATION MARKET, BY AUTHENTICATION TYPE, 2017–2022 (USD MILLION)
TABLE 226 MIDDLE EAST & AFRICA: MULTI-FACTOR AUTHENTICATION MARKET, BY AUTHENTICATION TYPE, 2023–2028 (USD MILLION)
TABLE 227 MIDDLE EAST & AFRICA: MULTI-FACTOR AUTHENTICATION MARKET, BY COMPONENT, 2017–2022 (USD MILLION)
TABLE 228 MIDDLE EAST & AFRICA: MULTI-FACTOR AUTHENTICATION MARKET, BY COMPONENT, 2023–2028 (USD MILLION)
TABLE 229 MIDDLE EAST & AFRICA: MULTI-FACTOR AUTHENTICATION MARKET, BY MODEL TYPE, 2017–2022 (USD MILLION)
TABLE 230 MIDDLE EAST & AFRICA: MULTI-FACTOR AUTHENTICATION MARKET, BY MODEL TYPE, 2023–2028 (USD MILLION)
TABLE 231 MIDDLE EAST & AFRICA: MULTI-FACTOR AUTHENTICATION MARKET, BY TWO-FACTOR AUTHENTICATION, 2017–2022 (USD MILLION)
TABLE 232 MIDDLE EAST & AFRICA: MULTI-FACTOR AUTHENTICATION MARKET, BY TWO-FACTOR AUTHENTICATION, 2023–2028 (USD MILLION)
TABLE 233 MIDDLE EAST & AFRICA: MULTI-FACTOR AUTHENTICATION MARKET, BY THREE-FACTOR AUTHENTICATION, 2017–2022 (USD MILLION)
TABLE 234 MIDDLE EAST & AFRICA: MULTI-FACTOR AUTHENTICATION MARKET, BY THREE-FACTOR AUTHENTICATION, 2023–2028 (USD MILLION)
TABLE 235 MIDDLE EAST & AFRICA: MULTI-FACTOR AUTHENTICATION MARKET, BY END-USE INDUSTRY, 2017–2022 (USD MILLION)
TABLE 236 MIDDLE EAST & AFRICA: MULTI-FACTOR AUTHENTICATION MARKET, BY END-USE INDUSTRY, 2023–2028 (USD MILLION)
TABLE 237 MIDDLE EAST & AFRICA: MULTI-FACTOR AUTHENTICATION MARKET, BY COUNTRY, 2017–2022 (USD MILLION)
TABLE 238 MIDDLE EAST & AFRICA: MULTI-FACTOR AUTHENTICATION MARKET, BY COUNTRY, 2023–2028 (USD MILLION)
10.5.4 UAE
10.5.4.1 Need to adopt modern low-friction authentication techniques to safeguard mixed workforces to drive market
TABLE 239 UAE: MULTI-FACTOR AUTHENTICATION MARKET, BY AUTHENTICATION TYPE, 2017–2022 (USD MILLION)
TABLE 240 UAE: MULTI-FACTOR AUTHENTICATION MARKET, BY AUTHENTICATION TYPE, 2023–2028 (USD MILLION)
TABLE 241 UAE: MULTI-FACTOR AUTHENTICATION MARKET, BY COMPONENT, 2017–2022 (USD MILLION)
TABLE 242 UAE: MULTI-FACTOR AUTHENTICATION MARKET, BY COMPONENT, 2023–2028 (USD MILLION)
TABLE 243 UAE: MULTI-FACTOR AUTHENTICATION MARKET, BY MODEL TYPE, 2017–2022 (USD MILLION)
TABLE 244 UAE: MULTI-FACTOR AUTHENTICATION MARKET, BY MODEL TYPE, 2023–2028 (USD MILLION)
TABLE 245 UAE: MULTI-FACTOR AUTHENTICATION MARKET, BY END-USE INDUSTRY, 2017–2022 (USD MILLION)
TABLE 246 UAE: MULTI-FACTOR AUTHENTICATION MARKET, BY END-USE INDUSTRY, 2023–2028 (USD MILLION)
10.5.5 KSA
10.5.5.1 Need to secure digital identities to fuel adoption of MFA solutions
TABLE 247 KSA: MULTI-FACTOR AUTHENTICATION MARKET, BY AUTHENTICATION TYPE, 2017–2022 (USD MILLION)
TABLE 248 KSA: MULTI-FACTOR AUTHENTICATION MARKET, BY AUTHENTICATION TYPE, 2023–2028 (USD MILLION)
TABLE 249 KSA: MULTI-FACTOR AUTHENTICATION MARKET, BY COMPONENT, 2017–2022 (USD MILLION)
TABLE 250 KSA: MULTI-FACTOR AUTHENTICATION MARKET, BY COMPONENT, 2023–2028 (USD MILLION)
TABLE 251 KSA: MULTI-FACTOR AUTHENTICATION MARKET, BY MODEL TYPE, 2017–2022 (USD MILLION)
TABLE 252 KSA: MULTI-FACTOR AUTHENTICATION MARKET, BY MODEL TYPE, 2023–2028 (USD MILLION)
TABLE 253 KSA: MULTI-FACTOR AUTHENTICATION MARKET, BY END-USE INDUSTRY, 2017–2022 (USD MILLION)
TABLE 254 KSA: MULTI-FACTOR AUTHENTICATION MARKET, BY END-USE INDUSTRY, 2023–2028 (USD MILLION)
10.5.6 REST OF MIDDLE EAST & AFRICA
TABLE 255 REST OF MIDDLE EAST & AFRICA: MULTI-FACTOR AUTHENTICATION MARKET, BY AUTHENTICATION TYPE, 2017–2022 (USD MILLION)
TABLE 256 REST OF MIDDLE EAST & AFRICA: MULTI-FACTOR AUTHENTICATION MARKET, BY AUTHENTICATION TYPE, 2023–2028 (USD MILLION)
TABLE 257 REST OF MIDDLE EAST & AFRICA: MULTI-FACTOR AUTHENTICATION MARKET, BY COMPONENT, 2017–2022 (USD MILLION)
TABLE 258 REST OF MIDDLE EAST & AFRICA: MULTI-FACTOR AUTHENTICATION MARKET, BY COMPONENT, 2023–2028 (USD MILLION)
TABLE 259 REST OF MIDDLE EAST & AFRICA: MULTI-FACTOR AUTHENTICATION MARKET, BY MODEL TYPE, 2017–2022 (USD MILLION)
TABLE 260 REST OF MIDDLE EAST & AFRICA: MULTI-FACTOR AUTHENTICATION MARKET, BY MODEL TYPE, 2023–2028 (USD MILLION)
TABLE 261 REST OF MIDDLE EAST & AFRICA: MULTI-FACTOR AUTHENTICATION MARKET, BY END-USE INDUSTRY, 2017–2022 (USD MILLION)
TABLE 262 REST OF MIDDLE EAST & AFRICA: MULTI-FACTOR AUTHENTICATION MARKET, BY END-USE INDUSTRY, 2023–2028 (USD MILLION)
10.6 LATIN AMERICA
10.6.1 LATIN AMERICA: MULTI-FACTOR AUTHENTICATION MARKET DRIVERS
10.6.2 LATIN AMERICA: RECESSION IMPACT
10.6.3 LATIN AMERICA: REGULATORY LANDSCAPE
TABLE 263 LATIN AMERICA: MULTI-FACTOR AUTHENTICATION MARKET, BY AUTHENTICATION TYPE, 2017–2022 (USD MILLION)
TABLE 264 LATIN AMERICA: MULTI-FACTOR AUTHENTICATION MARKET, BY AUTHENTICATION TYPE, 2023–2028 (USD MILLION)
TABLE 265 LATIN AMERICA: MULTI-FACTOR AUTHENTICATION MARKET, BY COMPONENT, 2017–2022 (USD MILLION)
TABLE 266 LATIN AMERICA: MULTI-FACTOR AUTHENTICATION MARKET, BY COMPONENT, 2023–2028 (USD MILLION)
TABLE 267 LATIN AMERICA: MULTI-FACTOR AUTHENTICATION MARKET, BY MODEL TYPE, 2017–2022 (USD MILLION)
TABLE 268 LATIN AMERICA: MULTI-FACTOR AUTHENTICATION MARKET, BY MODEL TYPE, 2023–2028 (USD MILLION)
TABLE 269 LATIN AMERICA: MULTI-FACTOR AUTHENTICATION MARKET, BY TWO-FACTOR AUTHENTICATION, 2017–2022 (USD MILLION)
TABLE 270 LATIN AMERICA: MULTI-FACTOR AUTHENTICATION MARKET, BY TWO-FACTOR AUTHENTICATION, 2023–2028 (USD MILLION)
TABLE 271 LATIN AMERICA: MULTI-FACTOR AUTHENTICATION MARKET, BY THREE-FACTOR AUTHENTICATION, 2017–2022 (USD MILLION)
TABLE 272 LATIN AMERICA: MULTI-FACTOR AUTHENTICATION MARKET, BY THREE-FACTOR AUTHENTICATION, 2023–2028 (USD MILLION)
TABLE 273 LATIN AMERICA: MULTI-FACTOR AUTHENTICATION MARKET, BY END-USE INDUSTRY, 2017–2022 (USD MILLION)
TABLE 274 LATIN AMERICA: MULTI-FACTOR AUTHENTICATION MARKET, BY END-USE INDUSTRY, 2023–2028 (USD MILLION)
TABLE 275 LATIN AMERICA: MULTI-FACTOR AUTHENTICATION MARKET, BY COUNTRY, 2017–2022 (USD MILLION)
TABLE 276 LATIN AMERICA: MULTI-FACTOR AUTHENTICATION MARKET, BY COUNTRY, 2023–2028 (USD MILLION)
10.6.4 BRAZIL
10.6.4.1 Rising adoption of digital penetration and social media to propel market
TABLE 277 BRAZIL: MULTI-FACTOR AUTHENTICATION MARKET, BY AUTHENTICATION TYPE, 2017–2022 (USD MILLION)
TABLE 278 BRAZIL: MULTI-FACTOR AUTHENTICATION MARKET, BY AUTHENTICATION TYPE, 2023–2028 (USD MILLION)
TABLE 279 BRAZIL: MULTI-FACTOR AUTHENTICATION MARKET, BY COMPONENT, 2017–2022 (USD MILLION)
TABLE 280 BRAZIL: MULTI-FACTOR AUTHENTICATION MARKET, BY COMPONENT, 2023–2028 (USD MILLION)
TABLE 281 BRAZIL: MULTI-FACTOR AUTHENTICATION MARKET, BY MODEL TYPE, 2017–2022 (USD MILLION)
TABLE 282 BRAZIL: MULTI-FACTOR AUTHENTICATION MARKET, BY MODEL TYPE, 2023–2028 (USD MILLION)
TABLE 283 BRAZIL: MULTI-FACTOR AUTHENTICATION MARKET, BY END-USE INDUSTRY, 2017–2022 (USD MILLION)
TABLE 284 BRAZIL: MULTI-FACTOR AUTHENTICATION MARKET, BY END-USE INDUSTRY, 2023–2028 (USD MILLION)
10.6.5 MEXICO
10.6.5.1 Rising social media and digital penetration to fuel demand for MFA solutions
TABLE 285 MEXICO: MULTI-FACTOR AUTHENTICATION MARKET, BY AUTHENTICATION TYPE, 2017–2022 (USD MILLION)
TABLE 286 MEXICO: MULTI-FACTOR AUTHENTICATION MARKET, BY AUTHENTICATION TYPE, 2023–2028 (USD MILLION)
TABLE 287 MEXICO: MULTI-FACTOR AUTHENTICATION MARKET, BY COMPONENT, 2017–2022 (USD MILLION)
TABLE 288 MEXICO: MULTI-FACTOR AUTHENTICATION MARKET, BY COMPONENT, 2023–2028 (USD MILLION)
TABLE 289 MEXICO: MULTI-FACTOR AUTHENTICATION MARKET, BY MODEL TYPE, 2017–2022 (USD MILLION)
TABLE 290 MEXICO: MULTI-FACTOR AUTHENTICATION MARKET, BY MODEL TYPE, 2023–2028 (USD MILLION)
TABLE 291 MEXICO: MULTI-FACTOR AUTHENTICATION MARKET, BY END-USE INDUSTRY, 2017–2022 (USD MILLION)
TABLE 292 MEXICO: MULTI-FACTOR AUTHENTICATION MARKET, BY END-USE INDUSTRY, 2023–2028 (USD MILLION)
10.6.6 REST OF LATIN AMERICA
TABLE 293 REST OF LATIN AMERICA: MULTI-FACTOR AUTHENTICATION MARKET, BY AUTHENTICATION TYPE, 2017–2022 (USD MILLION)
TABLE 294 REST OF LATIN AMERICA: MULTI-FACTOR AUTHENTICATION MARKET, BY AUTHENTICATION TYPE, 2023–2028 (USD MILLION)
TABLE 295 REST OF LATIN AMERICA: MULTI-FACTOR AUTHENTICATION MARKET, BY COMPONENT, 2017–2022 (USD MILLION)
TABLE 296 REST OF LATIN AMERICA: MULTI-FACTOR AUTHENTICATION MARKET, BY COMPONENT, 2023–2028 (USD MILLION)
TABLE 297 REST OF LATIN AMERICA: MULTI-FACTOR AUTHENTICATION MARKET, BY MODEL TYPE, 2017–2022 (USD MILLION)
TABLE 298 REST OF LATIN AMERICA: MULTI-FACTOR AUTHENTICATION MARKET, BY MODEL TYPE, 2023–2028 (USD MILLION)
TABLE 299 REST OF LATIN AMERICA: MULTI-FACTOR AUTHENTICATION MARKET, BY END-USE INDUSTRY, 2017–2022 (USD MILLION)
TABLE 300 REST OF LATIN AMERICA: MULTI-FACTOR AUTHENTICATION MARKET, BY END-USE INDUSTRY, 2023–2028 (USD MILLION)
11 COMPETITIVE LANDSCAPE (Page No. - 229)
11.1 KEY PLAYERS STRATEGIES
11.2 REVENUE ANALYSIS
FIGURE 33 HISTORICAL REVENUE ANALYSIS FOR KEY PLAYERS, 2020–2022 (USD BILLION)
11.3 MARKET SHARE ANALYSIS
FIGURE 34 MARKET SHARE ANALYSIS, 2022
TABLE 301 INTENSITY OF COMPETITIVE RIVALRY
11.4 RANKING OF TOP MARKET PLAYERS
FIGURE 35 RANKING OF TOP MARKET PLAYERS
11.5 COMPANY EVALUATION MATRIX
11.5.1 STARS
11.5.2 EMERGING LEADERS
11.5.3 PERVASIVE PLAYERS
11.5.4 PARTICIPANTS
FIGURE 36 COMPANY EVALUATION MATRIX, 2023
11.5.5 COMPANY FOOTPRINT
FIGURE 37 OVERALL COMPANY FOOTPRINT
11.6 START-UP/SME EVALUATION MATRIX
11.6.1 PROGRESSIVE COMPANIES
11.6.2 RESPONSIVE COMPANIES
11.6.3 DYNAMIC COMPANIES
11.6.4 STARTING BLOCKS
FIGURE 38 START-UP/SMES EVALUATION MATRIX, 2023
11.6.5 COMPETITIVE BENCHMARKING
TABLE 302 LIST OF START-UPS/SMES
11.7 GLOBAL SNAPSHOTS OF KEY MARKET PLAYERS AND THEIR HEADQUARTERS
FIGURE 39 REGIONAL SNAPSHOT
11.8 VALUATION AND FINANCIAL METRICS OF VENDORS
FIGURE 40 VALUATION AND FINANCIAL METRICS OF MULTI-FACTOR AUTHENTICATION VENDORS
11.9 COMPETITIVE SCENARIO
11.9.1 PRODUCT LAUNCHES
TABLE 303 MULTI-FACTOR AUTHENTICATION MARKET: PRODUCT LAUNCHES, 2023–2021
11.9.2 DEALS
TABLE 304 MULTI-FACTOR AUTHENTICATION MARKET: DEALS, 2023–2021
12 COMPANY PROFILES (Page No. - 243)
(Business Overview, Products Offered, Recent Developments, MnM View Right to win, Strategic choices made, Weaknesses and competitive threats) *
12.1 KEY PLAYERS
12.1.1 MICROSOFT
TABLE 305 MICROSOFT: COMPANY OVERVIEW
FIGURE 41 MICROSOFT: COMPANY SNAPSHOT
TABLE 306 MICROSOFT: PRODUCTS/SOLUTIONS/SERVICES OFFERED
TABLE 307 MICROSOFT: PRODUCT LAUNCHES
TABLE 308 MICROSOFT: DEALS
12.1.2 THALES GROUP
TABLE 309 THALES GROUP: COMPANY OVERVIEW
FIGURE 42 THALES GROUP: COMPANY SNAPSHOT
TABLE 310 THALES GROUP: PRODUCTS/SOLUTIONS/SERVICES OFFERED
TABLE 311 THALES GROUP: PRODUCT LAUNCHES
TABLE 312 THALES GROUP: DEALS
12.1.3 OKTA
TABLE 313 OKTA: COMPANY OVERVIEW
FIGURE 43 OKTA: COMPANY SNAPSHOT
TABLE 314 OKTA: PRODUCTS/SOLUTIONS/SERVICES OFFERED
TABLE 315 OKTA: PRODUCT LAUNCHES
TABLE 316 OKTA: DEALS
12.1.4 BROADCOM
TABLE 317 BROADCOM: COMPANY OVERVIEW
FIGURE 44 BROADCOM: COMPANY SNAPSHOT
TABLE 318 BROADCOM: PRODUCTS/SOLUTIONS/SERVICES OFFERED
TABLE 319 BROADCOM: DEALS
12.1.5 ONESPAN
TABLE 320 ONESPAN: COMPANY OVERVIEW
FIGURE 45 ONESPAN: COMPANY SNAPSHOT
TABLE 321 ONESPAN: PRODUCTS/SOLUTIONS/SERVICES OFFERED
TABLE 322 ONESPAN: PRODUCT LAUNCHES
TABLE 323 ONESPAN: DEALS
12.1.6 MICRO FOCUS
TABLE 324 MICRO FOCUS: COMPANY OVERVIEW
TABLE 325 MICRO FOCUS: PRODUCTS/SOLUTIONS/SERVICES OFFERED
TABLE 326 MICRO FOCUS: DEALS
12.1.7 HID GLOBAL
TABLE 327 HID GLOBAL: COMPANY OVERVIEW
TABLE 328 HID GLOBAL: PRODUCTS/SOLUTIONS/SERVICES OFFERED
TABLE 329 HID GLOBAL: PRODUCT LAUNCHES
TABLE 330 HID GLOBAL: DEALS
12.1.8 CISCO
TABLE 331 CISCO: COMPANY OVERVIEW
FIGURE 46 CISCO: COMPANY SNAPSHOT
TABLE 332 CISCO: PRODUCTS/SOLUTIONS/SERVICES OFFERED
TABLE 333 CISCO: PRODUCT LAUNCHES
TABLE 334 CISCO: DEALS
12.1.9 PING IDENTITY
TABLE 335 PING IDENTITY: COMPANY OVERVIEW
TABLE 336 PING IDENTITY: PRODUCTS/SOLUTIONS/SERVICES OFFERED
TABLE 337 PING IDENTITY: PRODUCT LAUNCHES
TABLE 338 PING IDENTITY: DEALS
12.1.10 RSA SECURITY
TABLE 339 RSA SECURITY: COMPANY OVERVIEW
TABLE 340 RSA SECURITY: PRODUCTS/SOLUTIONS/SERVICES OFFERED
TABLE 341 RSA SECURITY: DEALS
12.1.11 ESET
12.1.12 YUBICO
12.1.13 FORGEROCK
12.1.14 CYBERARK
12.1.15 ONELOGIN
12.1.16 SECUREAUTH
12.1.17 ORACLE
12.1.18 SALESFORCE
12.2 OTHER KEY PLAYERS
12.2.1 SECRET DOUBLE OCTOPUS
12.2.2 SILVERFORT
12.2.3 TRUSONA
12.2.4 FUSIONAUTH
12.2.5 HYPR
12.2.6 KEYLESS
12.2.7 LUXCHAIN
*Details on Business Overview, Products Offered, Recent Developments, MnM View, Right to win, Strategic choices made, Weaknesses and competitive threats might not be captured in case of unlisted companies.
13 ADJACENT MARKETS (Page No. - 289)
13.1 INTRODUCTION TO ADJACENT MARKETS
TABLE 342 ADJACENT MARKETS AND FORECASTS
13.2 LIMITATIONS
13.3 ADJACENT MARKETS
13.3.1 IDENTITY AND ACCESS MANAGEMENT MARKET
TABLE 343 IDENTITY AND ACCESS MANAGEMENT MARKET, BY OFFERING, 2017–2022 (USD MILLION)
TABLE 344 IDENTITY AND ACCESS MANAGEMENT MARKET, BY OFFERING, 2023–2028 (USD MILLION)
TABLE 345 IDENTITY AND ACCESS MANAGEMENT MARKET, BY SOLUTION, 2017–2022 (USD MILLION)
TABLE 346 IDENTITY AND ACCESS MANAGEMENT MARKET, BY SOLUTION, 2023–2028 (USD MILLION)
13.3.2 DIGITAL IDENTITY SOLUTIONS MARKET
TABLE 347 DIGITAL IDENTITY SOLUTIONS MARKET, BY OFFERING, 2017–2022 (USD MILLION)
TABLE 348 DIGITAL IDENTITY SOLUTIONS MARKET, BY OFFERING, 2023–2028 (USD MILLION)
TABLE 349 DIGITAL IDENTITY SOLUTIONS MARKET, BY SOLUTION TYPE, 2017–2022 (USD MILLION)
TABLE 350 DIGITAL IDENTITY SOLUTIONS MARKET, BY SOLUTION TYPE, 2023–2028 (USD MILLION)
14 APPENDIX (Page No. - 292)
14.1 DISCUSSION GUIDE
14.2 KNOWLEDGESTORE: MARKETSANDMARKETS’ SUBSCRIPTION PORTAL
14.3 CUSTOMIZATION OPTIONS
14.4 RELATED REPORTS
14.5 AUTHOR DETAILS


 Generating Response ...


Growth opportunities and latent adjacency in Multi-Factor Authentication Market