Network as a Service Market by Type (LAN and WLAN, WAN, Communication and Collaboration, and Network Security), Organization Size (Large Enterprises and SMEs), Application, End User (BFSI, Manufacturing, Healthcare) and Region - Global Forecast to 2027
Network as a Service Market - Size, Growth, Report & Analysis
[296 Pages Report] The global Network as a Service Market size was valued $13.2 billion in 2022. The revenue forecast for 2027 is set for the valuation of $46.6 billion. It is projected to grow at a CAGR of 28.7% during the forecast period (2022-2027). The base year for estimation is 2021 and the market size available for the years of 2016 to 2027.
The major growing factor of network as a service is an increase in investment of advanced technologies. With an increase in innovation in enterprise IT, there is a change in the way organizations manage every aspect of their business. The rise of cloud computing is one of the significant transformations since the internet launch. The proliferation of cloud services continues to be a disruptive force within the IT realm.
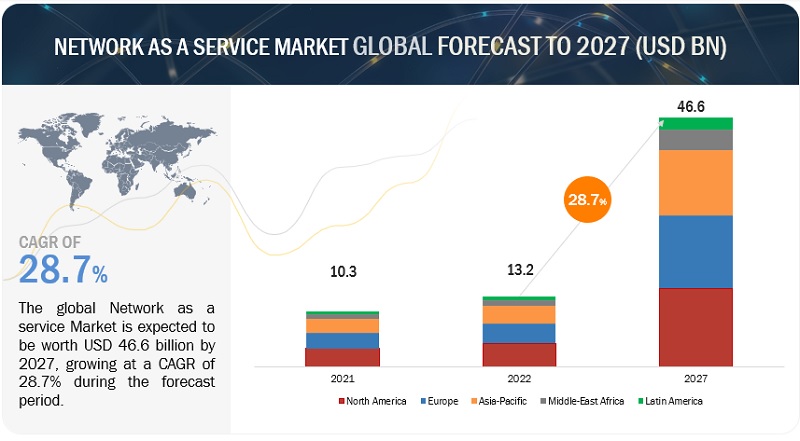
To know about the assumptions considered for the study, Request for Free Sample Report
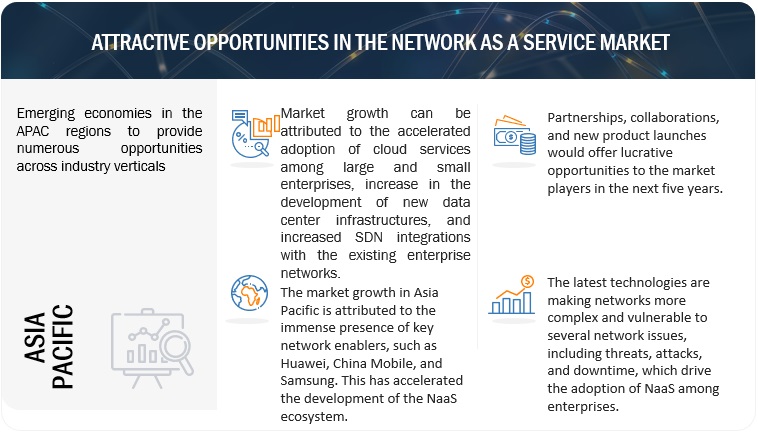
To know about the assumptions considered for the study, download the pdf brochure
Market Dynamics
Driver: Reduction in the amount of time and money spent on automation procedures
When companies align their expenses with real consumption, they profit. They don't have to spend for equipment that isn't being consumed, and they may flexibly expand bandwidth as prices rise. Updates, software updates, and security fixes must be implemented as soon as possible by companies that operate their network. IT workers may be required to go to many sites to perform modifications. NaaS facilitates the release of new patches, improvements, and abilities continually. It streamlines various operations, such as new user onboarding, and offers synchronization and optimization for optimal efficiency. This can reduce the amount of time and money spent on these procedures. Thus, it is driving the growth of the market.
Restraint: Lack of standardization in the NaaS market
The main problem in this sector is the challenge of providing customers with NaaS services while guaranteeing sufficient regulatory compliances. In order for businesses to fulfil their business objectives, market suppliers must follow appropriate security and regulatory regulations. To promote the expansion of NaaS solutions, cloud providers must adhere to strict scalability standards for storage, computation, and network resource sharing. Additional security, business restructuring, mergers, and consolidations are only a few instances of these demands. At some time, the suppliers can find it challenging to safeguard and sustain their technology while also adhering to rules and laws. Vendor non-compliance with laws and regulations can have a direct impact on the services they provide to customers, posing serious financial and commercial risks to those clients and their company operations. NaaS offerings Vendors provide their clients with complete visibility. By upholding established standards and sticking to the finest service-delivery techniques, they promote and offer programmes and services. Vendors find it challenging to stay up with the federal restrictions and constantly changing technology as it develops. This is the main obstacle facing both clients and providers in this sector.
Opportunity: Adoption of a hybrid working model
Many firms may find that a hybrid workplace structure is an unavoidable arrangement in the future. It has shown to be quite effective regarding employee healthcare, employer efficiency, and weeding out unproductive workers. It also functions as information storage and exchange option for businesses, allowing them to operate more efficiently and expand. This makes it simple for the business to meet its short- and long-term objectives.
Challenge: Loss of WAN connection severely impeding business network activities
Shifting to NaaS will be challenging and time-consuming for medium-to-large enterprises with major expenditures in remote, regional, campus, and data-center connectivity and network security infrastructure. Since NaaS depends on rapid, low-latency internet providers, any loss of WAN connection can severely impede or even stop business network activities. Because the service remains new, NaaS pricing is unknown. Thus, company executives may discover that annual operational expenses are higher than anticipated.
North America to account for largest market size during the forecast period
The geographic analysis of the network as a service is segmented into regions, including North America, Europe, Asia Pacific, Middle East & Africa, and Latin America. In 2022, North America has captured most of the share, as the US and Canada are rapidly adopting network as a service solutions. Organizations across regions are refining their infrastructure to improve their overall business efficiency. Cloud deployment options such as public, private, and hybrid are available to organizations if they choose to move their infrastructure to cloud. Thus, various parameters such as cost, security, flexibility, scalability, and compliance are related to the movement of organizations’ IT infrastructure to cloud. Depending on costs and value-added features, enterprises can choose from Wi-Fi, LAN, or WAN networks. The presence of key market players such as AT&T, Verizon, Lumen, and Comcast Business is a major factor driving the adoption of NaaS solutions in North America.
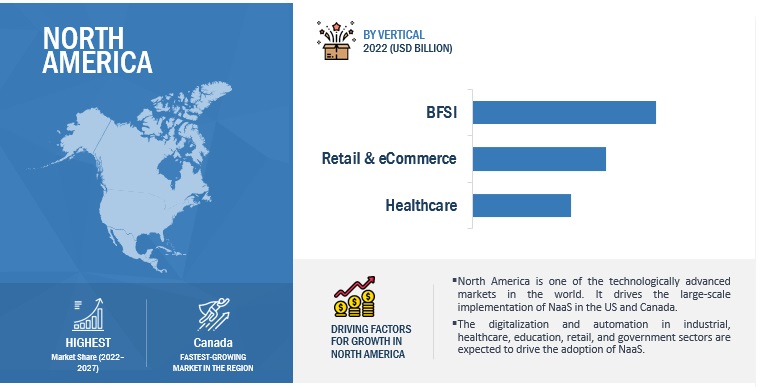
As per organization size, small and medium enterprises segment is expected to grow at highest CAGR during the forecast period
The network as a service enterprise size segment is sub segmented into SMEs and large enterprises. As per organization size, small and medium enterprises segment expected to grow at highest CAGR during the forecast period. The NaaS model enables SMEs to achieve fast, reliable, and secure networking performance without the requirement of installing or managing cable-based connectivity on their premises. It lowers CAPEX by 30-35% as compared to the ownership model. SMEs have witnessed a greater RoI by adopting the NaaS model. The demand for NaaS is higher in SMEs as it ensures the security of their networks and the quality of their services.
Key Market Players
The network as a service solutions vendors have implemented various types of organic as well as inorganic growth strategies, such as new product launches, product upgradations, partnerships and agreements, business expansions, and mergers and acquisitions to strengthen their offerings in the market. Some of the major network as a service vendors are AT&T (US), Verizon (US), Telefonica (Spain), NTT Communications (Japan), Orange Business Services (France), Vodafone (UK), BT Group (UK), Tata Communications (India), Lumen (US), Comcast Business (US), and Axians (France).
Scope of the Report
|
Report Metrics |
Details |
|
Market size available for years |
2016–2027 |
|
Base year considered |
2021 |
|
Forecast period |
2022–2027 |
|
Forecast units |
Billion (USD) |
|
Segments covered |
By Type, Application, Oganization Size, End User, and Regions |
|
Geographies covered |
North America, Europe, APAC, MEA, and Latin America |
|
Companies covered |
AT&T (US), Verizon (US), Telefonica (Spain), NTT Communications (Japan), Orange Business Services (France), Vodafone (UK), BT Group (UK), Tata Communications (India), Lumen (US), Comcast Business (US), Axians (France), Servsys (US), TELUS (Canada), KDDI (Japan), Cloudflare (US), PCCW Global (China), China Telecom (China), Singtel (Singapore), China Mobile (China), GTT Communications (US), Aryaka Networks (US), Telia (Sweden), Telstra (Australia), Deutsche Telekom (Germany), Colt Technology Services (UK), Wipro (India), HGC (China), TenFour (US), PacketFabric (US), OnX Canada (Canada), Megaport (Australia), Epsilon (Singapore), IPC Tech (US), and Microland (India). |
This research report categorizes the Network as a service based on Type, Application, Organization Size, End User, and Region.
By Type:
- Local Area Network and Wireless Local Area Network
- Wire Area Network
- Communication and Collaboration
- Network Security
By Application:
- UCaaS/Video Conferencing
- Virtual Private Network
- Cloud and SaaS Connectivity
- Bandwidth on Demand
- Multi-Branch Connectivity
- WAN Optimization
- Secure Web Gateway
- Network Access Control
- Other Applications
By Organization Type:
- Large Enterprises
- Small and Medium-Sized Enterprises
By End User:
- Banking, Financial, Services, and Insurance
- Manufacturing
- Retail and eCommerce
- Software and Technology
- Media and Entertainment
- Healthcare
- Education
- Government
- Other End Users
By Region:
-
North America
- US
- Canada
-
Europe
- UK
- Germany
- Rest of Europe
-
APAC
- China
- Japan
- India
- South Korea
- Rest of APAC
-
MEA
- Middle East
- Africa
-
Latin America
- Brazil
- Mexico
- Rest of Latin America
Recent Developments:
- In May 2022, Tata Communications launched DIGO, DIGO is a cloud communications platform that enables digital-first enterprises to improve customer interaction. The system includes a comprehensive suite of device-agnostic communications capabilities that can be effortlessly integrated into an organization's existing apps, allowing users to participate in intelligent, 360-degree human-to-everything (H2X) conversations.
- In April 2022, Lumen launched Lumen Cloud Communications (LCC), Voice telephone, group chat, video calls, and smartphone apps are available through LCC. LCC Basic is a PBX substitution service that offers unrestricted local and domestic long-distance calling, visible voicemail, and paging, among other things. Other IP endpoints, as well as Poly and Grandstream phones and saucers, are supported by this service.
- In January 2022, Orange Business Services launched Service Manage-Watch, With the launch of Service Manage-Watch, a worldwide supervising solutions for network services and apps for Orange-provided and third-party services, Orange Business Services is moving forward in IT performance analysis. It's made to ensure that connection and safety at the edges, as well as apps, hardware, and the customer experience, are all working at their best to suit clients' company requirements.
- In October 2021, Telefonica launched Secure SD-WAN, Telefónica, with Fortinet, launched a global Secure SD-WAN service to secure and connect work-from-anywhere. This new service combines networking and security capabilities into a coherent offering to motivate the hybrid work era. It enables employees to communicate with the best productivity and safety from offices, industries, or sites. It broadens this expertise when attempting to access enterprise applications wirelessly.
- In June 2021, AT&T launched Cisco Webex Calling, AT&T Business provides Webex Calling with AT&T Enterprise to Cisco's Unified Communications Manager – Cloud (UCMC). It will aid firms in optimizing processes and accelerating digitalization. For all Webex Calling with AT&T–Enterprise users, UCMC will improve dependability and efficiency.
- In March 2021, Verizon launched NaaS, Verizon launched a new SDN and NFV service that enables enterprises to transition to a virtual infrastructure model, providing greater agility and on-demand resources.
Frequently Asked Questions (FAQ):
What is network as a service?
NaaS refers to the provisioning of network services offered by communication service providers on a subscription basis or using the as-a-service model that provides organizations an edge to operate business services without investing in network infrastructure. It covers a broad range of network services, including Local Area Network (LAN), Wireless Local Area Network (WLAN), Wide Area Network (WAN), communication and collaboration, and network security. NaaS is a combination of virtual network services and cloud-based service models that offer on-demand network connectivity and management of network services.
Which regions are early adopter of network as a service solutions?
North America and Europe are at the initial stage towards adoption of network as a service solutions.
Which are key end users adopting network as a service solutions?
Key end users adopting network as a service solutions include Banking, Financial Services, and Insurance (BFSI), manufacturing, retail and e-commerce, software and technology, media and entertainment, healthcare, education, government, and other end users (transportation and logistics, hospitality, and energy and utilities).
Which are the key vendors exploring network as a service space?
The key vendors exploring network as a service includes AT&T (US), Verizon (US), Telefonica (Spain), NTT Communications (Japan), Orange Business Services (France), Vodafone (UK), BT Group (UK), Tata Communications (India), Lumen (US), Comcast Business (US), and Axians (France).
What are the key application of network as a service?
Unified Communication as a Service (UCaaS)/Video Conferencing, virtual private network, cloud and SaaS connectivity, bandwidth on demand, multi-branch connectivity, wan optimization, secure web gateway, network access control, and other applications (secure DDI and firewall) are the key application of network as a service.
To speak to our analyst for a discussion on the above findings, click Speak to Analyst

The research study for the network as a service involved the use of extensive secondary sources, directories, and several journals, including the Global Journal of Management and Business Research and Asia Pacific Journal of Information Systems (APJIS), and publications, such as the Journal of Enterprise Information Management, to identify and collect information useful for this comprehensive market research study. Primary sources were mainly industry experts from the core and related industries, preferred NMS providers, third-party service providers, consulting service providers, end users, and other commercial enterprises. In-depth interviews were conducted with various primary respondents, including key industry participants and subject matter experts, to obtain and verify critical qualitative and quantitative information, and assess the market’s prospects.
Secondary Research
In the secondary research process, various secondary sources were referred to for identifying and collecting information for the study. The secondary sources included annual reports, press releases and investor presentations of companies and white papers, certified publications, and articles from recognized associations and government publishing sources. Several journals such as the International Journal of Computer Science and Information Technology and Security (IJCSITS), ScienceDirect, ResearchGate, Academic Journals, and Scientific.Net were also referred. In addition, various telecom and NaaS associations/forums, Citizens Broadband Radio Service (CBRS) Alliance, MulteFire Alliance, and 3GPP. Secondary research was mainly used to obtain key information about industry insights, the market’s monetary chain, the overall pool of key players, market classification and segmentation according to industry trends to the bottom-most level, regional markets, and key developments from both market- and technology-oriented perspectives.
Primary Research
In the primary research process, various primary sources from both supply and demand sides were interviewed to obtain qualitative and quantitative information on the market. The primary sources from the supply side included various industry experts, such as Chief Experience Officers (CXOs); Vice Presidents (VPs); directors from business development, marketing, and product development/innovation teams; related key executives from NMS solution vendors, SIs, professional service providers, and industry associations; and key opinion leaders.
Primary interviews were conducted to gather insights, such as market statistics, revenue data collected from solutions and services, market breakups, market size estimations, market forecasts, and data triangulation. Primary research also helped understand various trends related to technologies, applications, deployments, and regions. Stakeholders from the demand side, such as Chief Information Officers (CIOs), Chief Technology Officers (CTOs), Chief Strategy Officers (CSOs), and end users using network as a service solutions, were interviewed to understand the buyer’s perspective on suppliers, products, service providers, and their current usage of network as a service solutions and services, which would impact the overall network as a service.
The following is the breakup of primary profiles:
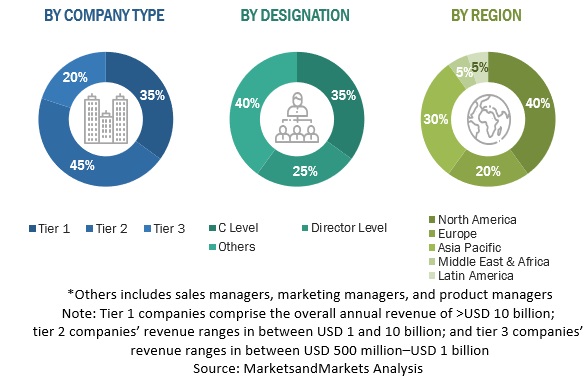
To know about the assumptions considered for the study, download the pdf brochure
Market Size Estimation
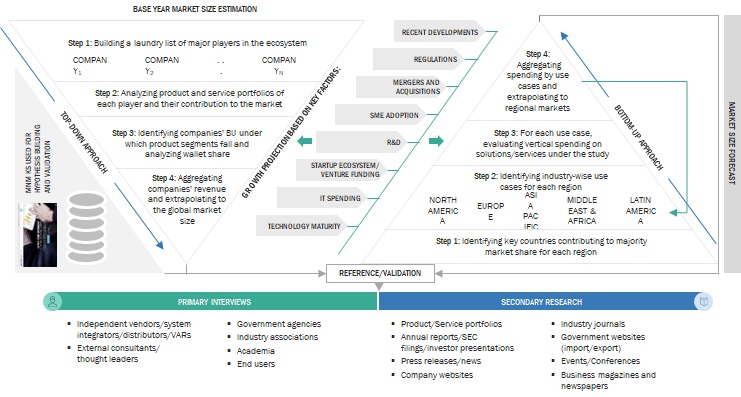
- For making market estimates and forecasting the Location analytics market and the other dependent submarkets, top-down and bottom-up approaches were used. The bottom-up procedure was used to arrive at the overall market size of the global Location analytics market, using the revenue from the key companies and their offerings in the market. With data triangulation and validation through primary interviews, this study determined and confirmed the exact value of the overall parent market size. The overall market size was then used in the top-down procedure to estimate the size of other individual markets via percentage splits of the market segments.
- The top-down approach prepared an exhaustive list of all the vendors offering Location analytics. The revenue contribution of the market vendors was estimated through annual reports, press releases, funding and investor presentations, paid databases, and primary interviews. Each vendor’s offerings were evaluated based on the breadth of solution and service offerings, Applications, and verticals. The aggregate of all the companies’ revenues was extrapolated to reach the overall market size. Each subsegment was studied and analyzed for its global market size and regional penetration. The markets were triangulated through both primary and secondary research. The primary procedure included extensive interviews for key insights from industry leaders, such as CIOs, CEOs, VPs, directors, and marketing executives. The market numbers were further triangulated with the existing MarketsandMarkets repository for validation.
- In the bottom-up approach, the adoption rate of Location analytics solutions and services among different end-users in key countries with respect to their regions contributing the most to the market share was identified. For cross-validation, the adoption of location analytics solutions and services among industries, along with different use cases with respect to their regions, was identified and extrapolated. Weightage was given to use cases identified in different regions for the market size calculation.
- All the possible parameters that affect the market covered in the research study have been accounted for, viewed in extensive detail, verified through primary research, and analyzed to get the final quantitative and qualitative data. The data is consolidated and added with detailed inputs and analysis from MarketsandMarkets.
- The pricing trend is assumed to vary over time.
- All the forecasts are made with the standard assumption that the accepted currency is USD.
- For the conversion of various currencies to USD, average historical exchange rates are used according to the year specified. For all the historical and current exchange rates required for calculations and currency conversions, the US Internal Revenue Service’s website is used.
- All the forecasts are made under the standard assumption that the globally accepted currency, USD, remains constant during the next five years.
- Vendor-side analysis: The market size estimates of associated solutions and services are factored in from the vendor side by assuming an average of licensing and subscription-based models of leading and innovative vendors.
- Demand/end-user analysis: End users operating in verticals across regions are analyzed in terms of market spending on Location analytics solutions based on some of the key use cases. These factors for the Location analytics tool industry per region are separately analyzed, and the average spending was extrapolated with an approximation based on assumed weightage. This factor is derived by averaging various market influencers, including recent developments, regulations, mergers and acquisitions, enterprise/SME adoption, startup ecosystem, IT spending, technology propensity and maturity, use cases, and the estimated number of organizations per region.
Top Down and Bottom UP Approach
To know about the assumptions considered for the study, Request for Free Sample Report
Data Triangulation
After arriving at the overall market size—using the market size estimation processes as explained above—the market was split into several segments and subsegments. In order to complete the overall market engineering process and arrive at the exact statistics of each market segment and subsegment, the data triangulation and market breakdown procedures were employed, wherever applicable. The data was triangulated by studying various factors and trends from both, the demand and supply sides, in the BFSI, manufacturing, retail and ecommerce, software and technology, media & entertainment, healthcare, education, government, and other end users. Others include transportation and logistics, energy and utilities, and hospitality.
Market Definition
NaaS refers to the provisioning of network services offered by communication service providers on a subscription basis or using the as-a-service model that provides organizations an edge to operate business services without investing in network infrastructure. It covers a broad range of network services, including Local Area Network (LAN), Wireless Local Area Network (WLAN), Wide Area Network (WAN), communication and collaboration, and network security. NaaS is a combination of virtual network services and cloud-based service models that offer on-demand network connectivity and management of network services.
Report Objectives
- To define, describe, and forecast the Network as a Service (NaaS) market by type, organization size, application, end user, and region
- To forecast the size of the market’s segments with respect to five regions: North America, Europe, Asia Pacific (APAC), Middle East and Africa (MEA), and Latin America
- To provide detailed information about major factors (drivers, opportunities, threats, and challenges) influencing the growth of the NaaS market
- To analyze each submarket with respect to individual growth trends, prospects, and contributions to the global NaaS market
- To analyze opportunities in the market for stakeholders by identifying high-growth segments of the global NaaS market
- To profile key market players, such as top and emerging vendors; provide a comparative analysis based on their business overviews, regional presence, product offerings, and business strategies; and illustrate the market’s competitive landscape
- To track and analyze competitive developments, such as new product launches, product enhancements, partnerships, acquisitions, and agreements and collaborations, in the market
Available Customizations
With the given market data, MarketsandMarkets offers customizations as per the company’s specific needs. The following customization options are available for the report:
Product Analysis
- Product matrix provides a detailed comparison of the product portfolio of each company
Geographic Analysis
- Further breakup of the North American network as a service market
- Further breakup of the European network as a service market
- Further breakup of the APAC network as a service market
- Further breakup of the Latin American network as a service market
- Further breakup of the MEA network as a service market
Company Information
- Detailed analysis and profiling of additional market players up to 5


 Generating Response ...


Growth opportunities and latent adjacency in Network as a Service Market
Interested in Network-as-a-Service market
Which industries/end customer segments are keen to adopt Network as a Service Market?