NPK Fertilizers (feed-grade and food-grade) Market by Application (Bakery Products, Meat & Meat Products, Dairy Products, and Beverages), Form (Powder, Liquid, and Others), Type (Nitrogen, Phosphorus, Potassium, and Others), and Region-Global Forecast to 2023


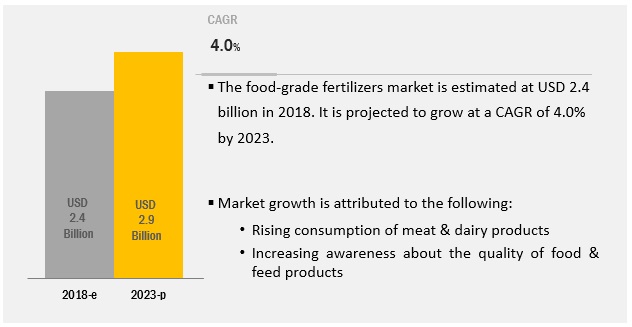
[207 Pages Report] The NPK fertilizers market (food-grade) is estimated to be valued at USD 2.4 billion in 2018 and is projected to reach USD 2.9 billion by 2023, at a CAGR of 4.0% during the forecast period. Rise in consumption of meat & dairy products due to rising disposable income and focus on nutrition is expected to drive the NPK fertilizers (food-grade) market. The NPK fertilizers market (feed-grade) is estimated to be valued at USD 5.4 billion in 2018 and is projected to reach USD 6.6 billion by 2023, at a CAGR of 4.1% from 2018. These feed-grade fertilizers help animals attain faster growth and increase their weight by providing added nutrition to their meals.
By type, phosphorus is expected to be the largest contributor in the NPK fertilizers (food-grade) market during the forecast period
The NPK fertilizers (food-grade) market, based on type, has been segmented into phosphorus, nitrogen, potassium, and others. The phosphorus segment is estimated to dominate the market in 2018 and is also projected to be the fastest-growing segment during the forecast period. The usage of phosphate in the food industry is increasing due to its lower price compared to traditional food additives.
By form, powder form accounts for the largest market in the NPK fertilizers (food-grade) market during the forecast period
The NPK fertilizers (food-grade) market, by form, has been segmented into powder, liquid, and others. The market is estimated to be dominated by the powder segment in 2018 and is also projected to grow at the highest CAGR. Powdered NPK fertilizers (food-grade) have a longer shelf life compared to liquid NPK fertilizers (food-grade)and are also convenient to apply and transport. These factors drive the powder segment of NPK fertilizers (food-grade).
By application, meat and meat products are expected to grow at the fastest rate during the forecast period.
Based on application, the NPK fertilizers (food-grade) market is segmented into dairy products, bakery products, meat & meat products, and beverages. The meat & meat products segment is estimated to dominate the market in 2018 owing to the increasing demand for processed and packed meat around the world, especially from developing countries such as India, China, and Brazil.
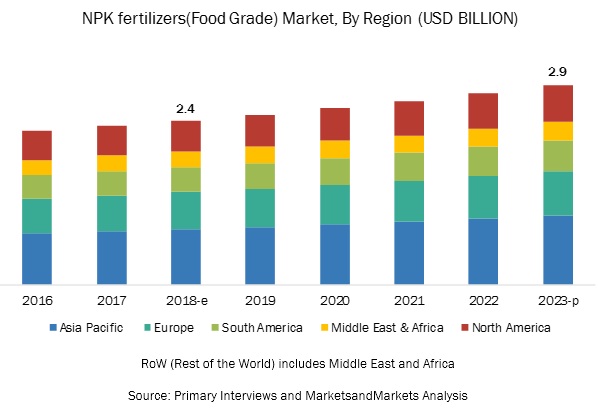
Asia Pacific is expected to account for the largest market size during the forecast period
The market in Asia Pacific is growing due to changing food consumption patterns owing to the rising consumer income and urbanization, especially in South Asian countries. Further, growth can be attributed to the increasing demand for quality processed and packed food in the region due to increasing disposable income along with growing per capita income in most countries in the region. Skepticism associated with the use of NPK fertilizers (feed-grade and food-grade) is the major restraint for the growth of this market.
Key Market Players
The global market for NPK fertilizers (feed-grade and food-grade) is dominated by large-scale players such as Borealis AG (Austria), AkzoNobel (Netherlands), Yara International ASA (Norway), Petróleo Brasileiro S.A. (Brazil), and Agrium Inc. (Canada). Furthermore, The Mosaic Company (US), Israel Chemicals Ltd. (Israel), EuroChem (Switzerland), PotashCorp (Canda), K+S AKTIENGESELLSCHAFT (Germany), Alltech (US), PhosAgro (Russia), Haifa Chemicals (Israel), Aditya Birla Chemicals (India), and SKW Stickstoffwerke Piesteritz (Germany) are the other players that hold a significant share in the NPK fertilizers (feed-grade and food-grade) market.
Scope of the Report
|
Report Metric |
Details |
|
Market size available for years |
2016-2023 |
|
Base year considered |
2017 |
|
Forecast period |
2018-2023 |
|
Forecast units |
Value(USD) and Volume(KT) |
|
Segments covered |
Type, Application, Form, Livestock, and Region |
|
Geographies covered |
North America, APAC, Europe, South America, and RoW (Rest of the World) |
|
Companies covered |
Haifa Chemicals (Israel), Aditya Birla Chemicals (India), AkzoNobel (Netherlands), PhosAgro (Russia). |
This research report categorizes the NPK fertilizers (food-grade) market based on type, form, application, and region.
Based on type, the market has been segmented as follows
- Phosphorus
- Nitrogen
- Potassium
- Others (secondary nutrients and micronutrient)
Based on form, the market has been segmented as follows
- Powder
- Liquid
- Others (crystals, prills, and pellets)
Based on application, the market has been segmented as follows
- Dairy products
- Meat & meat products
- Bakery products
- Beverages
Based on the region, the market has been segmented as follows
- North America
- Europe
- Asia Pacific
- South America
- RoW (Rest of the World)
This research report also categorizes the NPK fertilizers (feed-grade) market based on type, application, and region.
Based on type, the market has been segmented as follows
- Phosphorus
- Nitrogen
- Potassium
- Others (secondary nutrients and micronutrient)
Based on livestock, the market has been segmented as follows
- Ruminants
- Swine
- Poultry
- Others (pets, equine, and aquatic animals)
Based on the region, the market has been segmented as follows
- North America
- Europe
- Asia Pacific
- South America
- RoW (Rest of the World)
Key Questions addressed by the report
- Where are the industry players positioned in the industry in terms of the micro quadrants?
- What are the major industry applications for the NPK fertilizers (food-grade)market?
- Which are the major factors expected to drive the market in the near future?
- Which region would offer a higher growth for the players in the market?
- Which type would see the largest market share in the market?
Frequently Asked Questions (FAQ):
Which form would see the largest market share in the NPK fertilizers market?
The market is estimated to be dominated by the powder segment in 2018 and is also projected to grow at the highest CAGR.
What are the major industry applications for the NPK fertilizers (food-grade)market?
The major industry applications for the NPK fertilizers (food-grade) market are in dairy products, meat & meat products, bakery products and beverages.
Which are the major factors expected to drive the NPK fertilizers market in the near future?
Factors such as rise in consumption of meat and dairy products, high threat of diseases in livestock, and increasing awareness about the quality of feed and food products are driving the NPK fertilizers market.
Which region is expected to witness the highest demand during the forecast period?
Asia Pacific is expected to account for the largest market size during the forecast period due to changing food consumption patterns owing to the rising consumer income and urbanization, especially in South Asian countries.
Which type would see the largest market share in the market?
The phosphorus segment is estimated to dominate the market in 2018 and is also projected to be the fastest-growing segment during the forecast period. .
To speak to our analyst for a discussion on the above findings, click Speak to Analyst
 Exclusive indicates content/data unique to MarketsandMarkets and not available with any competitors.
Table of Contents
1 Introduction (Page No. - 18)
1.1 Objectives of the Study
1.2 Market Definition
1.3 Study Scope
1.4 Periodization Considered
1.5 Currency
1.6 Stakeholders
2 Research Methodology (Page No. - 23)
2.1 Research Data
2.1.1 Secondary Data
2.1.1.1 Key Data From Secondary Sources
2.1.2 Primary Data
2.1.2.1 Key Data From Primary Sources
2.1.2.2 Breakdown of Primaries
2.2 Market Size Estimation
2.3 Data Triangulation
2.4 Research Assumptions and Limitations
2.4.1 Research Assumptions
2.4.2 Research Limitations
3 Executive Summary (Page No. - 32)
4 Premium Insights (Page No. - 39)
4.1 Attractive Opportunities in the NPK Fertilizers (Feed-Grade and Food-Grade) Market
4.2 Asia Pacific: NPK Fertilizers (Feed-Grade) Market, By Type & Key Country
4.3 NPK Fertilizers (Food-Grade) Market, By Form & Region
4.4 NPK Fertilizers (Feed-Grade) Market, By Livestock & Region
5 Market Overview (Page No. - 43)
5.1 Introduction
5.2 Market Dynamics
5.2.1 Drivers
5.2.1.1 Rise in Consumption of Meat and Dairy Products
5.2.1.2 High Threat of Diseases in Livestock
5.2.1.3 Increasing Awareness About the Quality of Feed and Food Products
5.2.2 Restraints
5.2.2.1 Toxicity of Feed-Grade Fertilizers in Ruminants
5.2.3 Opportunities
5.2.3.1 Emerging Markets With Growth Opportunities
5.2.4 Challenges
5.2.4.1 Skepticism Associated With the Use of NPK Fertilizers (Feed-Grade and Food-Grade)
5.3 Value Chain Analysis
5.3.1 Regulatory Landscape
5.3.1.1 US
5.3.1.2 Canada
5.3.1.3 Europe
5.3.1.4 China
5.3.1.5 Japan
5.3.1.6 India
6 NPK Fertilizers (Food-Grade) Market, By Type (Page No. - 57)
6.1 Introduction
6.2 Phosphorus
6.3 Nitrogen
6.4 Potassium
6.5 Others
7 NPK Fertilizers (Food-Grade) Market, By Application (Page No. - 65)
7.1 Introduction
7.2 Meat & Meat Products
7.3 Bakery Products
7.4 Dairy Products
7.5 Beverages
8 NPK Fertilizers (Food-Grade) Market, By Form (Page No. - 73)
8.1 Introduction
8.2 Powder
8.3 Liquid
8.4 Others
9 NPK Fertilizers (Feed-Grade) Market, By Livestock (Page No. - 79)
9.1 Introduction
9.2 Ruminants
9.3 Poultry
9.4 Swine
9.5 Others
10 NPK Fertilizers (Feed-Grade) Market, By Type (Page No. - 88)
10.1 Introduction
10.2 Nitrogen
10.3 Phosphorus
10.4 Potassium
10.5 Others
11 NPK Fertilizers (Feed-Grade and Food-Grade) Market, By Region (Page No. - 96)
11.1 Introduction
11.2 North America
11.2.1 US
11.2.2 Canada
11.2.3 Mexico
11.3 Europe
11.3.1 Germany
11.3.2 France
11.3.3 UK
11.3.4 Spain
11.3.5 Italy
11.3.6 Rest of Europe
11.4 Asia Pacific
11.4.1 China
11.4.2 India
11.4.3 Japan
11.4.4 Australia
11.4.5 Rest of Asia Pacific
11.5 South America
11.5.1 Brazil
11.5.2 Argentina
11.5.3 Rest of South America
11.6 Rest of the World (RoW)
11.6.1 Africa
11.6.2 Middle East
12 Competitive Landscape (Page No. - 153)
12.1 Overview
12.2 Competitive Scenario
12.3 Market Ranking Analysis
12.4 Acquisitions
12.5 Expansions
12.5.1 New Product Launches/Developments/Registrations
13 Company Profiles (Page No. - 161)
(Business Overview, Products Offered, Recent Developments, SWOT Analysis, MnM View)*
13.1 Borealis Ag
13.2 Akzonobel
13.3 Yara International ASA
13.4 Petróleo Brasileiro S.A.
13.5 Agrium Inc.
13.6 The Mosaic Company
13.7 Israel Chemicals Ltd.
13.8 Eurochem
13.9 The Potash Corporation of Saskatchewan Inc.
13.10 K+S Aktiengesellschaft
13.11 Alltech
13.12 Phosagro
13.13 Haifa Chemicals Ltd.
13.14 Aditya Birla Chemicals
13.15 Skw Stickstoffwerke Piesteritz Gmbh
*Details on Business Overview, Products Offered, Recent Developments, SWOT Analysis, MnM View Might Not Be Captured in Case of Unlisted Companies.
14 Appendix (Page No. - 200)
14.1 Discussion Guide
14.2 Knowledge Store: Marketsandmarkets’ Subscription Portal
14.3 Available Customizations
14.4 Related Reports
14.5 Author Details
List of Tables (151 Tables)
Table 1 US Dollar Exchange Rate Considered, 2012 to 2017
Table 2 NPK Fertilizers (Feed-Grade) Market vs. NPK Fertilizers (Food-Grade) Market Snapshot, By Volume, 2017
Table 3 Dietary Requirements and Maximum Tolerance Concentration of Selected Minerals
Table 4 Per Capita Consumption of Meat and Milk, 1964–2030
Table 5 Labeling of Commercial Feed Containing Any Added Non-Protein Nitrogen
Table 6 Conversion Factors of Permitted Forms of Phosphates
Table 7 European Communities (Protein Feeding Stuffs) (Amendment) Regulations, 1996
Table 8 NPK Fertilizers (Food-Grade) Market Size, By Type, 2016–2023 (USD Million)
Table 9 NPK Fertilizers (Food-Grade) Market Size, By Type, 2016–2023 (Kt)
Table 10 Food-Grade Phosphorus Market Size, By Region, 2016–2023 (USD Million)
Table 11 Food-Grade Phosphorus Market Size, By Region, 2016–2023 (Kt)
Table 12 Food-Grade Nitrogen Market Size, By Region, 2016–2023 (USD Million)
Table 13 Food-Grade Nitrogen Market Size, By Region, 2016–2023 (Kt)
Table 14 Food-Grade Potassium Market Size, By Region, 2016–2023 (USD Million)
Table 15 Food-Grade Potassium Market Size, By Region, 2016–2023 (Kt)
Table 16 Other Food-Grade Fertilizers Market Size, By Region, 2016–2023 (USD Million)
Table 17 Other Food-Grade Fertilizers Market Size, By Region, 2016–2023 (Kt)
Table 18 NPK Fertilizers (Food-Grade) Market Size, By Application, 2016–2023 (USD Million)
Table 19 Market Size, By Application, 2016–2023 (Kt)
Table 20 NPK Fertilizers (Food-Grade) Market Size for Meat & Meat Products, By Region, 2016–2023 (USD Million)
Table 21 Market Size for Meat & Meat Products, By Region, 2016–2023 (Kt)
Table 22 NPK Fertilizers (Food-Grade) Market Size for Bakery Products, By Region, 2016–2023 (USD Million)
Table 23 Market Size for Bakery Products,By Region, 2016–2023 (Kt)
Table 24 NPK Fertilizers (Food-Grade) Market Size for Dairy Products, By Region, 2016–2023 (USD Million)
Table 25 Market Size for Dairy Products, By Region, 2016–2023 (Kt)
Table 26 NPK Fertilizers (Food-Grade) Market Size for Beverages, By Region, 2016–2023 (USD Million)
Table 27 Market Size for Beverages, By Region, 2016–2023 (Kt)
Table 28 NPK Fertilizers (Food-Grade) Market Size, By Form, 2016–2023 (USD Million)
Table 29 Market Size, By Form, 2016–2023 (Kt)
Table 30 Powder: NPK Fertilizers (Food-Grade) Market Size, By Region, 2016–2023 (USD Million)
Table 31 Powder: Market Size, By Region, 2016–2023 (Kt)
Table 32 Liquid: NPK Fertilizers (Food-Grade) Market Size, By Region, 2016–2023 (USD Million)
Table 33 Liquid: Market Size, By Region, 2016–2023 (Kt)
Table 34 Other Forms: NPK Fertilizers (Food-Grade) Market Size, By Region, 2016–2023 (USD Million)
Table 35 Other Forms: Market Size, By Region, 2016–2023 (Kt)
Table 36 NPK Fertilizers (Feed-Grade) Market Size, By Livestock, 2016–2023 (USD Million)
Table 37 Market Size, By Livestock, 2016–2023 (Kt)
Table 38 NPK Fertilizers (Feed-Grade) Market Size in Ruminant Feed, By Region, 2016–2023 (USD Million)
Table 39 Market Size in Ruminant Feed, By Region, 2016–2023 (Kt)
Table 40 NPK Fertilizers (Feed-Grade) Market Size in Poultry Feed, By Region, 2016–2023 (USD Million)
Table 41 Poultry: NPK Fertilizers (Feed-Grade) Market Size, By Region, 2016–2023 (Kt)
Table 42 NPK Fertilizers (Feed-Grade) Market Size in Swine Feed, By Region, 2016–2023 (USD Million)
Table 43 Market Size in Swine Feed, By Region, 2016–2023 (Kt)
Table 44 NPK Fertilizers (Feed-Grade) Market Size in Other Livestock, By Region, 2016–2023 (USD Million)
Table 45 Market Size in Other Livestock, By Region, 2016–2023 (Kt)
Table 46 NPK Fertilizers (Feed-Grade) Market Size, By Type, 2016–2023 (USD Million)
Table 47 Market Size, By Type, 2016–2023 (Kt)
Table 48 Nitrogen: NPK Fertilizers (Feed-Grade) Market Size, By Region, 2016–2023 (USD Million)
Table 49 Nitrogen: Market Size, By Region, 2016–2023 (Kt)
Table 50 Phosphorus: NPK Fertilizers (Feed-Grade) Market Size, By Region, 2016–2023 (USD Million)
Table 51 Phosphorus: Market Size, By Region, 2016–2023 (Kt)
Table 52 Potassium: NPK Fertilizers (Feed-Grade) Market Size, By Region, 2016–2023 (USD Million)
Table 53 Potassium: Market Size, By Region, 2016–2023 (Kt)
Table 54 Others: NPK Fertilizers (Feed-Grade) Market Size, By Region, 2016–2023 (USD Million)
Table 55 Others: Market Size, By Region, 2016–2023 (Kt)
Table 56 NPK Fertilizers (Food-Grade) Market Size, By Region, 2016–2023 (USD Million)
Table 57 Market Size, By Region, 2016–2023 (Kt)
Table 58 NPK Fertilizers (Feed-Grade) Market Size, By Region, 2016–2023 (USD Million)
Table 59 Market Size, By Region, 2016–2023 (Kt)
Table 60 North America: NPK Fertilizers (Food-Grade)Market Size, By Country, 2016–2023 (USD Million)
Table 61 North America: Market Size, By Country, 2016–2023 (Kt)
Table 62 North America: NPK Fertilizers (Feed-Grade) Market Size, By Country, 2016–2023 (USD Million)
Table 63 North America: Market Size, By Country, 2016–2023 (Kt)
Table 64 North America: NPK Fertilizers (Food-Grade) Market Size, By Type, 2016–2023 (USD Million)
Table 65 North America: Market Size, By Type, 2016–2023 (Kt)
Table 66 North America: NPK Fertilizers (Food-Grade) Market Size, By Application, 2016–2023 (USD Million)
Table 67 North America: Market Size, By Application, 2016–2023 (Kt)
Table 68 North America: NPK Fertilizers (Food-Grade) Market Size, By Form, 2016–2023 (USD Million)
Table 69 North America: Market Size, By Form, 2016–2023 (Kt)
Table 70 North America: NPK Fertilizers (Feed-Grade) Market Size, By Type, 2016–2023 (USD Million)
Table 71 North America: Market Size, By Type, 2016–2023 (Kt)
Table 72 North America: NPK Fertilizers (Feed-Grade) Market Size, By Livestock, 2016–2022 (USD Million)
Table 73 North America: Market Size, By Livestock, 2016–2022 (Kt)
Table 74 US: NPK Fertilizers (Feed-Grade) Market Size, By Type, 2016–2022 (USD Million)
Table 75 Canada: NPK Fertilizers (Feed-Grade) Market Size, By Type, 2016–2022 (USD Million)
Table 76 Mexico: NPK Fertilizers (Feed-Grade )Market Size, By Type, 2016–2022 (USD Million)
Table 77 Europe: NPK Fertilizers (Food-Grade) Market Size, By Country, 2016–2023 (USD Million)
Table 78 Europe: Market Size, By Country, 2016–2023 (Kt)
Table 79 Europe: NPK Fertilizers (Feed-Grade) Market Size, By Country, 2016–2023 (USD Million)
Table 80 Europe: Market Size, By Country, 2016–2023 (Kt)
Table 81 Europe: NPK Fertilizers (Food-Grade) Market Size, By Type, 2016–2023 (USD Million)
Table 82 Europe: Market Size, By Type, 2016–2023 (Kt)
Table 83 Europe: NPK Fertilizers (Food-Grade) Market Size, By Application, 2016–2023 (USD Million)
Table 84 Europe: Market Size, By Application, 2016–2023 (Kt)
Table 85 Europe: NPK Fertilizers (Food-Grade) Market Size, By Form, 2016–2023 (USD Million)
Table 86 Europe: Market Size, By Form, 2016–2023 (Kt)
Table 87 Europe: NPK Fertilizers (Feed-Grade) Market Size, By Type, 2016–2023 (USD Million)
Table 88 Europe: Market Size, By Type, 2016–2023 (Kt)
Table 89 Europe: NPK Fertilizers (Feed-Grade) Market Size, By Livestock, 2016–2023 (USD Million)
Table 90 Europe: Market Size, By Livestock, 2016–2023 (Kt)
Table 91 Germany: NPK Fertilizers (Feed-Grade) Market Size, By Type, 2016–2023 (USD Million)
Table 92 France: NPK Fertilizers (Feed-Grade) Market Size, By Type, 2016–2023 (USD Million)
Table 93 UK: NPK Fertilizers (Feed-Grade) Market Size, By Type, 2016–2023 (USD Million)
Table 94 Spain: NPK Fertilizers (Feed-Grade) Market Size, By Type, 2016–2023 (USD Million)
Table 95 Italy: NPK Fertilizers (Feed-Grade) Market Size, By Type, 2016–2023 (USD Million)
Table 96 Rest of Europe: NPK Fertilizers (Feed-Grade) Market Size, By Type, 2016–2023 (USD Million)
Table 97 Asia Pacific: NPK Fertilizers (Food-Grade) Market Size, By Country, 2016–2023 (USD Million)
Table 98 Asia Pacific: Market Size, By Country, 2016–2023 (Kt)
Table 99 Asia Pacific: NPK Fertilizers (Feed-Grade) Market Size, By Country, 2016–2023 (USD Million)
Table 100 Asia Pacific: Market Size, By Country, 2016–2023 (Kt)
Table 101 Asia Pacific: NPK Fertilizers (Food-Grade) Market Size, By Type, 2016–2023 (USD Million)
Table 102 Asia Pacific: Market Size, By Type, 2016–2023 (Kt)
Table 103 Asia Pacific: NPK Fertilizers (Food-Grade) Market Size, By Application, 2016–2023 (USD Million)
Table 104 Asia Pacific: Market Size, By Application, 2016–2023 (Kt)
Table 105 Asia Pacific: NPK Fertilizers (Food-Grade) Market Size, By Form, 2016–2023 (USD Million)
Table 106 Asia Pacific: Market Size, By Form, 2016–2023 (Kt)
Table 107 Asia Pacific: NPK Fertilizers (Feed-Grade) Market Size, By Type, 2016–2023 (USD Million)
Table 108 Asia Pacific: Market Size, By Type, 2016–2023 (Kt)
Table 109 Asia Pacific: NPK Fertilizers (Feed-Grade) Market Size, By Livestock, 2016–2023 (USD Million)
Table 110 Asia Pacific: Market Size, By Livestock, 2016–2023 (Kt)
Table 111 China: NPK Fertilizers (Feed-Grade) Market Size, By Type, 2016–2023 (USD Million)
Table 112 India: NPK Fertilizers (Feed-Grade) Market Size, By Type, 2016–2023 (USD Million)
Table 113 Japan: NPK Fertilizers (Feed-Grade) Market Size, By Type, 2016–2023 (USD Million)
Table 114 Australia: NPK Fertilizers (Feed-Grade) Market Size, By Type, 2016–2023 (USD Million)
Table 115 Rest of Asia Pacific: NPK Fertilizers (Feed-Grade) Market Size, By Type, 2016–2023 (USD Million)
Table 116 South America: NPK Fertilizers (Food-Grade) Market Size, By Country, 2016–2023 (USD Million)
Table 117 South America: Market Size, By Country, 2016–2023 (Kt)
Table 118 South America: NPK Fertilizers (Feed-Grade) Market Size, By Country, 2016–2023 (USD Million)
Table 119 South America: Market Size, By Country, 2016–2023 (Kt)
Table 120 South America: NPK Fertilizers (Food-Grade) Market Size, By Type, 2016–2023 (USD Million)
Table 121 South America: Market Size, By Type, 2016–2023 (Kt)
Table 122 South America: NPK Fertilizers (Food-Grade) Market Size, By Application, 2016–2023 (USD Million)
Table 123 South America: Market Size, By Application, 2016–2023 (Kt)
Table 124 South America: NPK Fertilizers (Food-Grade) Market Size, By Form, 2016–2023 (USD Million)
Table 125 South America: Market Size, By Form, 2016–2023 (Kt)
Table 126 South America: NPK Fertilizers (Feed-Grade) Market Size, By Type, 2016–2023 (USD Million)
Table 127 South America: Market Size, By Type, 2016–2023 (Kt)
Table 128 South America: NPK Fertilizers (Feed-Grade) Market Size, By Livestock, 2016–2022 (USD Million)
Table 129 South America: Market Size, By Livestock, 2016–2022 (Kt)
Table 130 Brazil: NPK Fertilizers (Feed-Grade) Market Size, By Type, 2016–2022 (USD Million)
Table 131 Argentina: NPK Fertilizers (Feed-Grade) Market Size, By Type, 2016–2023 (USD Million)
Table 132 Rest of South America: NPK Fertilizers (Feed-Grade) Market Size, By Type, 2016–2023 (USD Million)
Table 133 RoW: NPK Fertilizers (Food-Grade) Market Size, By Region, 2016–2023 (USD Million)
Table 134 RoW: Market Size, By Region, 2016–2023 (Kt)
Table 135 RoW: NPK Fertilizers (Feed-Grade) Market Size, By Region, 2016–2023 (USD Million)
Table 136 RoW: Market Size, By Country, 2016–2023 (Kt)
Table 137 RoW: NPK Fertilizers (Food-Grade) Market Size, By Type, 2016–2023 (USD Million)
Table 138 RoW: Market Size, By Type, 2016–2023 (Kt)
Table 139 RoW: NPK Fertilizers (Food-Grade) Market Size, By Application, 2016–2023 (USD Million)
Table 140 RoW: Market Size, By Application, 2016–2023 (Kt)
Table 141 RoW: NPK Fertilizers (Food-Grade) Market Size, By Form, 2016–2023 (USD Million)
Table 142 RoW: Market Size, By Form, 2016–2023 (Kt)
Table 143 RoW: NPK Fertilizers (Feed-Grade) Market Size, By Type, 2016–2023 (USD Million)
Table 144 RoW: Market Size, By Type, 2016–2023 (Kt)
Table 145 RoW: NPK Fertilizers (Feed-Grade) Market Size, By Livestock, 2016–2022 (USD Million)
Table 146 RoW: Market Size, By Livestock, 2016–2022 (Kt)
Table 147 Africa: NPK Fertilizers (Feed-Grade) Market Size, By Type, 2016–2023 (USD Million)
Table 148 Middle East: NPK Fertilizers (Feed-Grade) Market Size, By Type, 2016–2022 (USD Million)
Table 149 Acquisitions, 2010–2018
Table 150 Expansions, 2011–2018
Table 151 New Product Launches/Developments/Registrations, 2013–2018
List of Figures (50 Figures)
Figure 1 Market Segmentation
Figure 2 NPK Fertilizers (Feed-Grade) Market Segmentation
Figure 3 Regional Scope
Figure 4 NPK Fertilizers (Feed-Grade and Food-Grade) Market: Research Design
Figure 5 NPK Fertilizers (Feed-Grade and Food-Grade) Market Size Estimation Methodology: Bottom-Up Approach
Figure 6 Market Size Estimation Methodology: Top-Down Approach
Figure 7 NPK Fertilizers (Feed-Grade) Market Size Estimation Methodology: Bottom-Up Approach
Figure 8 Market Size Estimation Methodology: Top-Down Approach
Figure 9 Data Triangulation
Figure 10 NPK Fertilizers (Food-Grade) Market Size, By Type, 2018 vs. 2023 (USD Million)
Figure 11 NPK Fertilizers (Food-Grade) Market Size, By Application, 2018 vs. 2023 (USD Million)
Figure 12 Market Size, By Type, 2018 vs. 2023 (USD Million)
Figure 13 Market Size, By Livestock, 2018 vs. 2023 (USD Million)
Figure 14 NPK Fertilizers (Food-Grade) Market Share (Value), By Region, 2017
Figure 15 NPK Fertilizers (Feed-Grade) Market Share (Value), By Region, 2017
Figure 16 Increasing Demand for Livestock Products Drives the Market for NPK Fertilizers (Feed-Grade and Food-Grade)
Figure 17 Nitrogen and Phosphorus Accounted for Significant Largest Shares (Value) in their Respective Segments in 2017
Figure 18 Asia Pacific to Dominate the Powder Form of NPK Fertilizers (Food-Grade), in Terms of Value, 2018–2023
Figure 19 Ruminants to Be the Fastest-Growing Segment, in Terms of Value, During the Forecast Period
Figure 20 NPK Fertilizers (Feed-Grade and Food-Grade): Market Dynamics
Figure 21 Global Milk Production, 2013–2015 (Million Tons)
Figure 22 NPK Fertilizers (Feed-Grade and Food-Grade): Value Chain
Figure 23 Market Share (Value), By Type, 2018 vs. 2023
Figure 24 Market Share (Value), By Application, 2018 vs. 2023
Figure 25 Market Share (Value), By Form, 2018 vs. 2023
Figure 26 NPK Fertilizers (Feed-Grade) Market Share, By Livestock, 2018 vs. 2023 (Value)
Figure 27 NPK Fertilizers (Feed-Grade) Market Share (Value), By Type, 2018 vs. 2023
Figure 28 Geographic Snapshot (2018–2023): China, India, and Brazil are Emerging asNew Hotspots in the NPK Fertilizers (Food-Grade) Market
Figure 29 North America: NPK Fertilizers (Feed-Grade and Food-Grade) Market Snapshot
Figure 30 Asia Pacific NPK Fertilizers (Feed-Grade and Food-Grade) Market Snapshot
Figure 31 Key Developments By Leading Players in the NPK Fertilizers (Feed-Grade and Food-Grade) Market, 2010–2018
Figure 32 Number of Developments Between 2014 & 2018
Figure 33 NPK Fertilizers (Feed-Grade and Food-Grade) Market, Company Rankings, 2017
Figure 34 Borealis AG: Company Snapshot
Figure 35 Borealis AG: SWOT Analysis
Figure 36 Akzonobel: Company Snapshot
Figure 37 Akzonobel: SWOT Analysis
Figure 38 Yara International ASA: Company Snapshot
Figure 39 Yara International ASA: SWOT Analysis
Figure 40 Petróleo Brasileiro: Company Snapshot
Figure 41 Petroleo Brasileiro: SWOT Analysis
Figure 42 Agrium Inc.: Company Snapshot
Figure 43 Agrium Inc.: SWOT Analysis
Figure 44 The Mosaic Company: Company Snapshot
Figure 45 Israel Chemicals Ltd.: Company Snapshot
Figure 46 Eurochem: Company Snapshot
Figure 47 Potashcorp: Company Snapshot
Figure 48 K+S Aktiengesellschaft: Company Snapshot
Figure 49 Phosagro: Company Snapshot
Figure 50 Aditya Birla Chemicals: Company Snapshot
This research study involved the usage of extensive secondary sources (which include directories and databases)—such as Hoovers, Forbes, and Bloomberg Businessweek—to identify and collect information useful for a technical, market-oriented, and commercial study of the NPK fertilizers (feed-grade and food-grade) market. The primary sources mainly included industry experts from core and related industries and preferred suppliers, dealers, manufacturers, technology developers, alliances, standards & certification organizations from companies, and organizations related to all segments of this industry’s value chain.
Secondary Research
The secondary sources referred to for this study include databases maintained by regulatory and administrative authorities [Food and Agriculture Organization (FAO) Food Products Association (FPA), International Monetary Fund (IMF), World Bank, and Organization for Economic Co-operation and Development (OECD)]; corporate filings (annual reports, press releases, investor presentations, and financial statements); and trade, business, and professional associations [International Feed Industry Federation (IFIF), Association of Poultry Processors and Poultry Trade in the EU (AVEC), EU Association of Specialty Feed Ingredients and their Mixtures (FEFANA), and Global Feed LCA Institute (GFLI)]. The secondary data was collected and analyzed to arrive at the overall market size, which has been further validated by primary research.
Primary Research
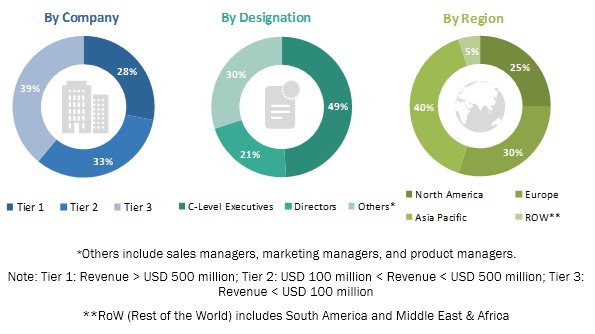
Extensive primary research was conducted after analyzing and understanding the NPK fertilizers (feed-grade and food-grade)market through secondary research. Primary interviews have been conducted with market experts from the demand side (animal husbandry companies, large-scale ranches, poultry farms, and researchers) and supply-side (feed producers, suppliers, distributors, importers, and exporters), across five major regions— North America, Europe, Asia Pacific, South America, and Middle East & Africa. This primary data was collected through questionnaires, emails, and telephonic interviews. Breakdown of primary interviews.
To know about the assumptions considered for the study, download the pdf brochure
Market Size Estimation
Both top-down and bottom-up approaches were used to estimate and validate the total size of the NPK fertilizers (feed-grade and food-grade) markets. These approaches were also used extensively to estimate the size of various subsegments in the market. The research methodology used to estimate the market size includes the following details:
- The key players in the industries and markets have been identified through extensive secondary research.
- The food- & feed-grade industries’ value chain and market size, in terms of value, have been determined through primary and secondary research.
- All percentage shares, splits, and breakdowns have been determined using secondary sources and verified through primary sources.
- All the possible parameters that affect the market covered in this research study have been accounted for, viewed in extensive detail, verified through primary research, and analyzed to obtain the final quantitative and qualitative data.
Data Triangulation
After arriving at the overall market sizes—using the market size estimation processes as explained above— the market was split into several segments and subsegments. To complete the overall market engineering process and arrive at the exact statistics of each market and its segments, the data triangulation and market breakdown procedures were employed, wherever applicable. The data was triangulated by studying various factors and trends from both the demand and supply sides of the food- & feed-grade industries. The market size was validated using the top-down and bottom-up approaches.
Report Objectives
- Determining and projecting the size of the NPK fertilizers (food-grade) market with respect to type, form, application, and regional markets, over five years ranging from 2018 to 2023
- Determining and projecting the size of the NPK fertilizers (feed-grade) market with respect to type, livestock, and regional markets, over five years ranging from 2018 to 2023
- Identifying attractive opportunities in the market by determining the largest and fastest-growing segments across regions
- Analyzing the segments and subsegments of the global NPK fertilizers (feed-grade and food-grade) market included in the report with respect to individual growth trends, prospects, and their contribution to the global market
- Identifying and profiling the key players in the NPK fertilizers (feed-grade and food-grade) market
- Determining the market ranking of the key players operating in the NPK fertilizers (feed-grade and food-grade) market
- Providing a comparative analysis of the market leaders based on the following:
- Product offerings
- Business strategies
- Strengths and weaknesses
- Key financials
- Understanding the competitive landscape and identifying the major growth strategies adopted by the players across the key regions
- Analyzing the market dynamics and competitive situations & trends across regions and their impact on prominent market players
Available Customizations
With the given market data, MarketsandMarkets offers customizations according to the company’s specific scientific needs.
The following customization options are available for the report:
Product Analysis
- Product matrix, which gives a detailed comparison of product portfolio of each company
Geographic Analysis
- Further breakdown of the Rest of Asia Pacific NPK fertilizers (food-grade) market, by key country
- Further breakdown of the Rest of Europe NPK fertilizers (food-grade) market, by key country
Company Information
- · Detailed analyses and profiling of additional market players (up to five)


Growth opportunities and latent adjacency in NPK Fertilizers (feed-grade and food-grade) Market