North America FOG Market by Type (Brown & Yellow grease), Generation (Restaurants/fast food restaurants, Food Processing Facility, Water Treatment Facility), Application, and Country (US, Canada, Mexico) - Global Forecast to 2044
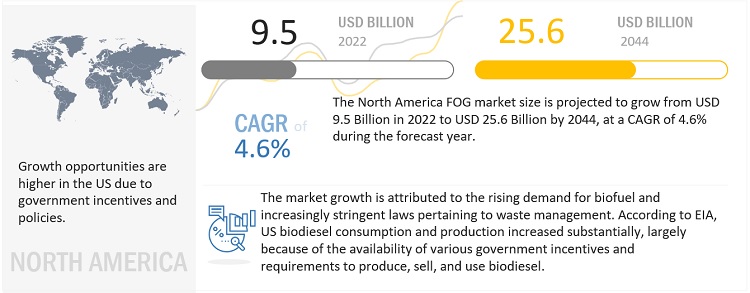
The North America FOG market size is projected to grow from USD 9.5 billion in 2022 to USD 25.6 billion by 2044, at a CAGR of 4.6% during the forecast period . The growth of this market is ascribed to growing biofuel production and an increase in concern for the necessity for reduced environmental effects and encouraging initiatives by the government. FOG has a significant potential to be refined into different biofuels for electricity production. Biodiesels have a lower carbon impact and burns cleaner. The technological advancement in converting the FOG into biofuel is the major opportunity in the market. However, the lack of awareness in developing economies may hinder the growth of the market.
Attractive Opportunities in the North America FOG Market

To know about the assumptions considered for the study, Request for Free Sample Report
North America FOG Market Dynamics
Driver- Growing demand for brown grease
The growing demand for brown grease acts as a major driver for the market. Brown grease provides several advantages to the energy sector, local communities, and the environment. FOG has a significant potential to be refined into different biofuels for electricity production. Biodiesels have a lower carbon impact and burn cleaner. They emit less carbon monoxide and cost less than petroleum fuel. The market is growing as a result of the increasing demand for recycled used cooking oil for the production of biodiesel.
Restraint- Unstable economic condition
Unstable economic conditions significantly influence the financial spending of industrial sectors that use grease. This leads to reduced interest in more innovative and advanced industrial grease products, as most of the manufacturers are skeptical to financially support R&D. The North America FOG industry also depends on the performance of its end-use industries, and the unstable economic condition is restraining the market.
Opportunity - Technological advancements leading to innovation
Technological advancements create opportunities for the growth of the North America FOG market. Europe and North America are characterized by extensive experience and knowledge in the FOG market. The market is experiencing rapid growth in emerging economies. Advanced technologies and equipment, coupled with new applications, are driving the demand for improved products in both developed and developing countries. This creates opportunities for the market players.
Challenge - Lack of awareness in developing economies
Mexico is slow in adopting innovative and new technologies related to brown and yellow grease. The North America FOG market comprises numerous small suppliers; its R&D budget is also limited in comparison to other sectors. The market has a positive outlook due to high growth in the fuel industry. However, in some developing or underdeveloped countries of the North America region, people are less aware of the benefits and use of brown and yellow grease in the manufacturing of biodiesel.
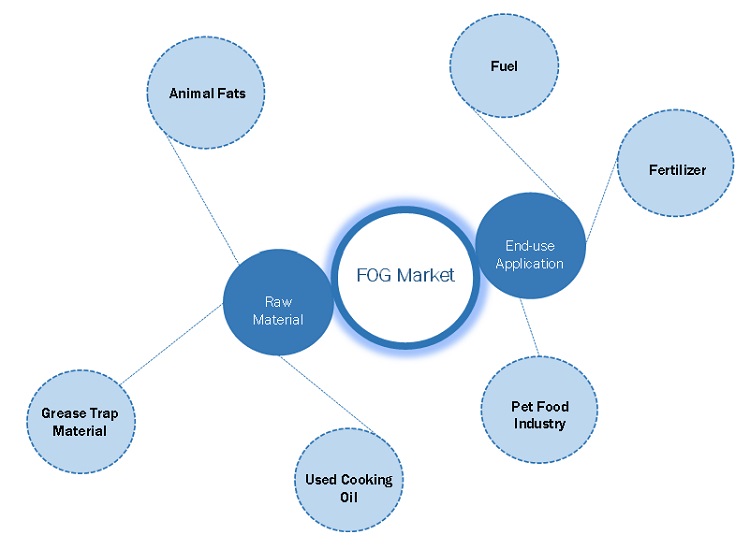
North America Fog Market: Ecosystem

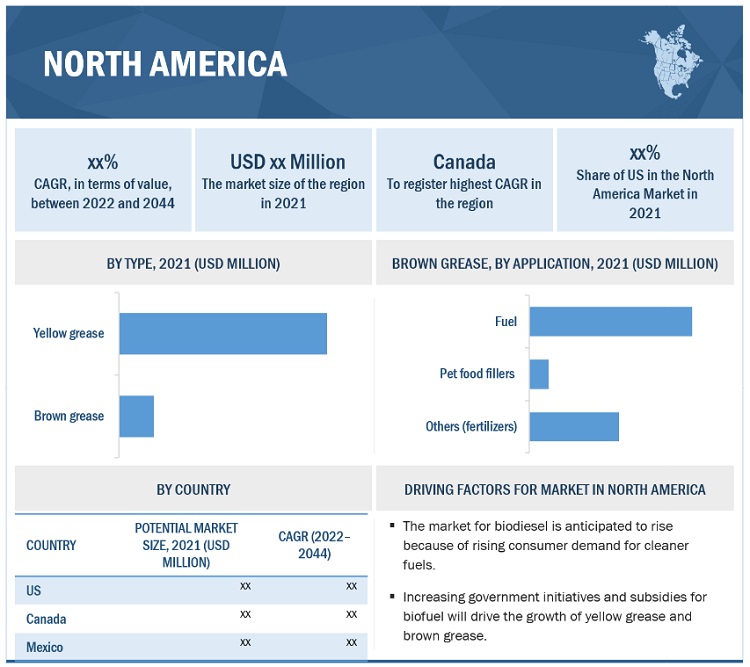
The Brown Grease, Restaurants/ Fast food restaurants segment to register the highest CAGR during the forecast period.
Brown grease is waste that is gathered from grease interceptors or traps, which are grease management equipment. Grease traps are sealed containers that are fitted in sewage lines in a way that enables lighter grease and oil to float to the top of the trap when flushed down a drain. These catchments enable the water to pass past the grease and into the main sewer or water treatment facility. Grease traps are set up such that the lid of the container may be opened, enabling the removal of the grease and oil. According to the National Renewable Energy Laboratory, it is estimated that 3.8 billion pounds of grease produced by restaurants in the US annually are used to make 495 million gallons of biodiesel or heating fuel, equivalent to 1% of the country's diesel consumption.
The Brown Grease Fuel segment is the quickest-growing application.
Brown grease Fuel segment is projected to register the highest CAGR. It is used in the production of biofuel. It is less expensive than crop-based biofuels and oilseed feedstocks cultivated on agricultural land. Biofuels are in great demand because of the enhanced Renewable Fuel Standard in the US. This standard is a federal legislation that requires transportation fuel suppliers (diesel and gasoline) to incorporate a modest amount of biofuels into their products. Its goal is to minimize greenhouse gas emissions and reliance on non-renewable petroleum.
Canada to register the highest CAGR during the forecast period.

To know about the assumptions considered for the study, download the pdf brochure
In terms of value and volume, Canada is projected to grow at the highest CAGR from 2022 to 2044. Factors such as the increasing demand for recycled used cooking oil for the production of biodiesel have driven the growth of the economy in the North America region. The rising demand for biofuel and increasingly stringent laws pertaining to waste management are expected to drive the FOG market in the region.
In US government offers incentives to biodiesel blenders and producers under the Biodiesel Mixture Excise Tax Credit and the Biodiesel Income Tax Credit. In 2020, biodiesel was second to ethanol as the most produced and consumed biofuel in the US and accounted for about 11% and 12% of total US biofuel production and consumption, respectively.
Key Market Players
Key players, such as Laing Darling Ingredients, Inc. (US), Restaurant Technologies Inc. (US), Downey Ridge Environmental Company (US), Baker Commodities Inc. (US), Mopac (US), Grease Cycle LLC (US), have adopted various growth strategies, such as acquisitions, contracts, agreements, and new projects to increase their market shares and enhance their product portfolios.
Scope of the Report
|
Report Metric |
Details |
|
Market size available for years |
2021–2044 |
|
Base year considered |
2021 |
|
Forecast period |
2022–2044 |
|
Forecast units |
Value (USD Billion) and Volume (Thousand gallons) |
|
Segments Covered |
Type, Generation, Application, and Region |
|
Geographies covered |
North America (US, Canada, and Mexico) |
|
Companies covered |
Darling Ingredients, Inc. (US), Restaurant Technologies Inc. (US), Downey Ridge Environmental Company (US), Baker Commodities Inc. (US), Mopac (US), Grease Cycle LLC (US), and others. |
This research report categorizes the modular construction market based on type, generation, application, , and region.
Based on Type:
- Yellow grease
- Brown grease
Based on Generation:
-
Yellow grease
- Fuel
- Pet food fillers
- Others
-
Brown grease
- Fuel
- Pet food fillers
- Others
Based on Application
-
Yellow grease
- Restaurants/fast food restaurants
- Food processing facility
-
Brown grease
- Restaurants/fast food restaurants
- Food processing facility
- Water treatment facility
Based on region:
-
North America
- US
- Canada
- Mexico
Recent Developments
- In March 2022, Downey Ridge Environmental Company, the developer of Greasezilla, partnered with LEND Environmental to accelerate the recycling of used cooking oil and grease trap waste across southern California. The additional sites will be set by the companies to separate waste input stream into oils, water and batter to regain beneficial organics for reuse as clean energy.
- Darling Ingredient, Inc. Patnered with Chick-fil-A, Inc. to turn used cooking oil into renewable fuel in march 2022.
- The Darling Ingredients company completed the acquisition of Brazil's largest independent rendering company, FASA Group, in August 2022.
Frequently Asked Questions (FAQ):
What are your views on the growth prospects of the North America FOG market?
Government policies, subsidies & Increasing awareness for clean burning fuels are the major driving factor of the North America FOG market.
What are the application of yellow grease and yellow grease market share in different application?
Yellow grease is used in applications like Fuel, Biodiesel (50-60% market share), farmers are using it as fuel after recycling, it is used in Animal feed (40% market share).
What are the FOG market share of the countries in the North America?
US – 65%, Canada – 25%, Mexico – 10%
Who are the major players in the North America FOG market?
Darling Ingredients, Inc. (US), Restaurant Technologies Inc. (US), Downey Ridge Environmental Company (US), Baker Commodities Inc, MOPAC.
How much tipping fees is paid by the used cooking oil collection company to restaurants, food processing facility etc. ?
40% of the market value is paid by the Collector companies to Restaurants for Yellow grease raw/fog material. (Around 90 cents/ pound). .
To speak to our analyst for a discussion on the above findings, click Speak to Analyst


- 5.1 INTRODUCTION
-
5.2 MARKET DYNAMICSDRIVERS- Increasing biodiesel production in North America- Growing demand for brown greaseRESTRAINTS- Unstable economic conditionOPPORTUNITIES- Technological advancements leading to innovationCHALLENGES- Lack of awareness in developing economies
-
5.3 PORTER’S FIVE FORCES ANALYSISTHREAT OF NEW ENTRANTSTHREAT OF SUBSTITUTESBARGAINING POWER OF SUPPLIERSBARGAINING POWER OF BUYERSINTENSITY OF COMPETITIVE RIVALRY
-
5.4 SUPPLY CHAIN ANALYSISRAW MATERIALGREASE COLLECTIONDISTRIBUTIONEND USER
- 5.5 TRENDS AND DISRUPTIONS IMPACTING CUSTOMERS’ BUSINESSES
-
5.6 CONNECTED MARKET: ECOSYSTEM
-
5.7 CASE STUDIES
-
5.8 INDUSTRY OUTLOOKGDP TRENDS AND FORECASTS FOR MAJOR ECONOMIES
- 5.9 KEY CONFERENCES & EVENTS (2022–2023)
-
5.10 KEY STAKEHOLDERS & BUYING CRITERIAKEY STAKEHOLDERS IN BUYING PROCESSBUYING CRITERIA
-
5.11 REGULATORY LANDSCAPEREGULATIONS RELATED TO GREASE
- 6.1 INTRODUCTION
-
6.2 BROWN GREASERESTAURANTS/FAST FOOD RESTAURANTSFOOD PROCESSING FACILITYWATER TREATMENT FACILITY
-
6.3 YELLOW GREASERESTAURANTS/FAST FOOD RESTAURANTSFOOD PROCESSING FACILITY
- 7.1 INTRODUCTION
-
7.2 YELLOW GREASEFUELPET FOOD FILLERSOTHERS
-
7.3 BROWN GREASEFUELPET FOOD FILLERSOTHERS
- 7.4 TIPPING FEE: PRIMARY INPUTS
- 8.1 INTRODUCTION
-
8.2 NORTH AMERICAUS- Growing government initiatives in biofuel production to drive marketCANADA- Government's focus to minimize greenhouse gas emissions to support marketMEXICO- Growing investment in energy & infrastructure sector to drive growth

- 9.1 INTRODUCTION
-
9.2 STRATEGIES ADOPTED BY KEY PLAYERSMARKET SHARE ANALYSIS OF KEY PLAYERS, 2022
- 9.3 KEY PLAYERS' STRATEGIES
-
9.4 COMPANY EVALUATION QUADRANTSTARSPERVASIVE PLAYERSEMERGING LEADERSPARTICIPANTS
-
9.5 STARTUPS/SMALL AND MEDIUM-SIZED ENTERPRISES (SMES) EVALUATION QUADRANTRESPONSIVE COMPANIESDYNAMIC COMPANIESSTARTING BLOCKSPROGRESSIVE COMPANIES
- 9.6 COMPETITIVE BENCHMARKING
-
9.7 COMPETITIVE SITUATION AND TRENDSPRODUCT LAUNCHESDEALSOTHER DEVELOPMENTS
-
10.1 DARLING INGREDIENTS, INC.BUSINESS OVERVIEWPRODUCTS OFFEREDRECENT DEVELOPMENTSMNM VIEW- Key strategies- Strategic choices- Weaknesses and competitive threats
-
10.2 BAKER COMMODITIES INC.BUSINESS OVERVIEWPRODUCTS OFFEREDRECENT DEVELOPMENTSMNM VIEW- Key strategies- Weaknesses and competitive threats
-
10.3 RESTAURANT TECHNOLOGIES, INC.BUSINESS OVERVIEWPRODUCTS OFFEREDRECENT DEVELOPMENTSMNM VIEW- Key strategies- Strategic choices- Weaknesses and competitive threats
-
10.4 MOPACBUSINESS OVERVIEWPRODUCTS OFFEREDMNM VIEW- Key strategies- Weaknesses and competitive threats
-
10.5 DOWNEY RIDGE ENVIRONMENTAL COMPANYBUSINESS OVERVIEWPRODUCTS OFFEREDRECENT DEVELOPMENTSMNM VIEW- Key strategies- Strategic choices- Weaknesses and competitive threats
-
10.6 OTHER PLAYERSGF COMMODITIES LLC.MAHONEY ENVIRONMENTAL INC.INDABA RENEWABLE FUELS CALIFORNIA LLCGRAND NATURAL INC.ACE GREASE SERVICE INC.SEQUENTIALGENUINE BIO-FUEL INC.ROCKY MOUNTAIN SUSTAINABLE ENTERPRISES, LLCGREEN ENERGY BIOFUELA&A GREASE & PUMPING SERVICEA&P GREASE TRAPPERSSMISSON-MATHIS ENERGY SOLUTIONSSOUTHWASTE DISPOSAL LLCFARMERS UNION INDUSTRIES LLC
- 11.1 DISCUSSION GUIDE
- 11.2 KNOWLEDGESTORE: MARKETSANDMARKETS’ SUBSCRIPTION PORTAL
- 11.3 CUSTOMIZATION OPTIONS
- 11.4 RELATED REPORTS
- 11.5 AUTHOR DETAILS
- TABLE 1 TRENDS AND FORECAST OF GDP, BY MAJOR ECONOMY, 2017–2024 (USD BILLION)
- TABLE 2 NORTH AMERICA FOG MARKET: DETAILED LIST OF CONFERENCES & EVENTS
- TABLE 3 INFLUENCE OF STAKEHOLDERS IN BUYING PROCESS FOR TOP TWO END-USE APPLICATIONS (%)
- TABLE 4 KEY BUYING CRITERIA FOR NORTH AMERICA FOG MARKET IN TOP 2 END-USE APPLICATIONS
- TABLE 5 NORTH AMERICA: ACTUAL FOG MARKET SIZE, BY TYPE, 2020–2044 (THOUSAND GALLON)
- TABLE 6 NORTH AMERICA: ACTUAL FOG MARKET SIZE, BY TYPE, 2020–2044 (USD MILLION)
- TABLE 7 NORTH AMERICA: POTENTIAL FOG MARKET SIZE, BY TYPE, 2020–2044 (THOUSAND GALLON)
- TABLE 8 NORTH AMERICA: POTENTIAL FOG MARKET SIZE, BY TYPE, 2020–2044 (USD MILLION)
- TABLE 9 BROWN GREASE MARKET SIZE, BY GENERATION, 2020–2044 (THOUSAND GALLON)
- TABLE 10 BROWN GREASE MARKET SIZE, BY GENERATION, 2020–2044 (USD MILLION)
- TABLE 11 YELLOW GREASE MARKET SIZE, BY GENERATION, 2020–2044 (THOUSAND GALLON)
- TABLE 12 YELLOW GREASE MARKET SIZE, BY GENERATION, 2020–2044 (USD MILLION)
- TABLE 13 NORTH AMERICA FOG MARKET: YELLOW GREASE MARKET SIZE, BY APPLICATION, 2020–2044 (THOUSAND GALLON)
- TABLE 14 NORTH AMERICA FOG MARKET: YELLOW GREASE MARKET SIZE, BY APPLICATION, 2020–2044 (USD MILLION)
- TABLE 15 NORTH AMERICA FOG MARKET: BROWN GREASE MARKET SIZE, BY APPLICATION, 2020–2044 (THOUSAND GALLON)
- TABLE 16 NORTH AMERICA FOG MARKET: BROWN GREASE MARKET SIZE, BY APPLICATION, 2020–2044 (USD MILLION)
- TABLE 17 NORTH AMERICA: ACTUAL FOG MARKET SIZE, BY COUNTRY, 2020–2044 (THOUSAND GALLON)
- TABLE 18 NORTH AMERICA: ACTUAL FOG MARKET SIZE, BY COUNTRY, 2020–2044 (USD MILLION)
- TABLE 19 NORTH AMERICA: POTENTIAL FOG MARKET SIZE, BY COUNTRY, 2020–2044 (THOUSAND GALLON)
- TABLE 20 NORTH AMERICA: POTENTIAL FOG MARKET SIZE, BY COUNTRY, 2020–2044 (USD MILLION)
- TABLE 21 US BIOFUELS SUPPLY AND DISPOSITION IN 2021 (BILLION GALLON)
- TABLE 22 US: ACTUAL FOG MARKET SIZE, BY TYPE, 2020–2044 (THOUSAND GALLON)
- TABLE 23 US: ACTUAL FOG MARKET SIZE, BY TYPE, 2020–2044 (USD MILLION)
- TABLE 24 US: POTENTIAL FOG MARKET SIZE, BY TYPE, 2020–2044 (THOUSAND GALLON)
- TABLE 25 US: POTENTIAL FOG MARKET SIZE, BY TYPE, 2020–2044 (USD MILLION)
- TABLE 26 US: ACTUAL BROWN GREASE MARKET SIZE, BY GENERATION, 2020–2044 (THOUSAND GALLON)
- TABLE 27 US: ACTUAL BROWN GREASE MARKET SIZE, BY GENERATION, 2020–2044 (USD MILLION)
- TABLE 28 US: ACTUAL YELLOW GREASE MARKET SIZE, BY GENERATION, 2020–2044 (THOUSAND GALLON)
- TABLE 29 US: ACTUAL YELLOW GREASE MARKET SIZE, BY GENERATION, 2020–2044 (USD MILLION)
- TABLE 30 US: ACTUAL BROWN GREASE MARKET SIZE, BY APPLICATION, 2020–2044 (THOUSAND GALLON)
- TABLE 31 US: ACTUAL BROWN GREASE MARKET SIZE, BY APPLICATION, 2020–2044 (USD MILLION)
- TABLE 32 US: ACTUAL YELLOW GREASE MARKET SIZE, BY APPLICATION, 2020–2044 (THOUSAND GALLON)
- TABLE 33 US: ACTUAL YELLOW GREASE MARKET SIZE, BY APPLICATION, 2020–2044 (USD MILLION)
- TABLE 34 CANADA: ACTUAL FOG MARKET SIZE, BY TYPE, 2020–2044 (THOUSAND GALLON)
- TABLE 35 CANADA: ACTUAL FOG MARKET SIZE, BY TYPE, 2020–2044 (USD MILLION)
- TABLE 36 CANADA: POTENTIAL FOG MARKET SIZE, BY TYPE, 2020–2044 (THOUSAND GALLON)
- TABLE 37 CANADA: POTENTIAL FOG MARKET SIZE, BY TYPE, 2020–2044 (USD MILLION)
- TABLE 38 CANADA: ACTUAL BROWN GREASE MARKET SIZE, BY GENERATION, 2020–2044 (THOUSAND GALLON)
- TABLE 39 CANADA: ACTUAL BROWN GREASE MARKET SIZE, BY GENERATION, 2020–2044 (USD MILLION)
- TABLE 40 CANADA: ACTUAL YELLOW GREASE MARKET SIZE, BY GENERATION, 2020–2044 (THOUSAND GALLON)
- TABLE 41 CANADA: ACTUAL YELLOW GREASE MARKET SIZE, BY GENERATION, 2020–2044 (USD MILLION)
- TABLE 42 CANADA: ACTUAL BROWN GREASE MARKET SIZE, BY APPLICATION, 2020–2044 (THOUSAND GALLON)
- TABLE 43 CANADA: ACTUAL BROWN GREASE MARKET SIZE, BY APPLICATION, 2020–2044 (USD MILLION)
- TABLE 44 CANADA: ACTUAL YELLOW GREASE MARKET SIZE, BY APPLICATION, 2020–2044 (THOUSAND GALLON)
- TABLE 45 CANADA: ACTUAL YELLOW GREASE MARKET SIZE, BY APPLICATION, 2020–2044 (USD MILLION)
- TABLE 46 MEXICO: POTENTIAL FOG MARKET SIZE, BY TYPE, 2020–2044 (THOUSAND GALLON)
- TABLE 47 MEXICO: POTENTIAL FOG MARKET SIZE, BY TYPE, 2020–2044 (USD MILLION)
- TABLE 48 FOG MARKET: SHARE OF KEY PLAYERS
- TABLE 49 STRATEGIC POSITIONING OF KEY PLAYERS
- TABLE 50 FOG MARKET: DETAILED LIST OF KEY PLAYERS
- TABLE 51 FOG MARKET: COMPETITIVE BENCHMARKING OF KEY PLAYERS
- TABLE 52 FOG MARKET: PRODUCT LAUNCHES
- TABLE 53 FOG MARKET: ACQUISITIONS
- TABLE 54 FOG MARKET: EXPANSIONS
- TABLE 55 DARLING INGREDIENTS, INC.: COMPANY OVERVIEW
- TABLE 56 DARLING INGREDIENTS, INC.: DEALS
- TABLE 57 DARLING INGREDIENTS, INC.: OTHERS
- TABLE 58 BAKER COMMODITIES INC.: COMPANY OVERVIEW
- TABLE 59 BAKER COMMODITIES INC.: PRODUCT LAUNCHES
- TABLE 60 RESTAURANT TECHNOLOGIES, INC.: COMPANY OVERVIEW
- TABLE 61 RESTAURANT TECHNOLOGIES, INC.: DEALS
- TABLE 62 RESTAURANT TECHNOLOGIES, INC.: PRODUCT LAUNCHES
- TABLE 63 MOPAC: COMPANY OVERVIEW
- TABLE 64 DOWNEY RIDGE ENVIRONMENTAL COMPANY: COMPANY OVERVIEW
- TABLE 65 DOWNEY RIDGE ENVIRONMENTAL COMPANY: PRODUCT LAUNCHES
- TABLE 66 DOWNEY RIDGE ENVIRONMENTAL COMPANY: OTHERS
- TABLE 67 GF COMMODITIES LLC.: COMPANY OVERVIEW
- TABLE 68 MAHONEY ENVIRONMENTAL INC.: COMPANY OVERVIEW
- TABLE 69 INDABA RENEWABLE FUELS CALIFORNIA LLC: COMPANY OVERVIEW
- TABLE 70 GRAND NATURAL INC.: COMPANY OVERVIEW
- TABLE 71 ACE GREASE SERVICE INC.: COMPANY OVERVIEW
- TABLE 72 SEQUENTIAL: COMPANY OVERVIEW
- TABLE 73 GENUINE BIO-FUEL INC.: COMPANY OVERVIEW
- TABLE 74 ROCKY MOUNTAIN SUSTAINABLE ENTERPRISES, LLC: COMPANY OVERVIEW
- TABLE 75 GREEN ENERGY BIOFUEL: COMPANY OVERVIEW
- TABLE 76 A&A GREASE & PUMPING SERVICE: COMPANY OVERVIEW
- TABLE 77 A&P GREASE TRAPPERS: COMPANY OVERVIEW
- TABLE 78 SMISSON-MATHIS ENERGY SOLUTIONS: COMPANY OVERVIEW
- TABLE 79 SOUTHWASTE DISPOSAL LLC: COMPANY OVERVIEW
- TABLE 80 FARMERS UNION INDUSTRIES LLC: COMPANY OVERVIEW
- FIGURE 1 NORTH AMERICA INEDIBLE FAT, OIL, AND GREASE (FOG) MARKET SEGMENTATION
- FIGURE 2 NORTH AMERICA FOG MARKET: RESEARCH DESIGN
- FIGURE 3 BREAKDOWN OF PRIMARY INTERVIEWS
- FIGURE 4 MARKET SIZE ESTIMATION: BOTTOM-UP APPROACH
- FIGURE 5 MARKET SIZE ESTIMATION: TOP-DOWN APPROACH
- FIGURE 6 NORTH AMERICA FOG MARKET: DATA TRIANGULATION
- FIGURE 7 YELLOW GREASE ACCOUNTED FOR LARGER SHARE IN 2021
- FIGURE 8 FUEL SEGMENT LED NORTH AMERICA FOG MARKET IN 2021
- FIGURE 9 US ACCOUNTED FOR LARGEST SHARE OF NORTH AMERICA FOG MARKET IN 2021
- FIGURE 10 GROWING DEMAND FROM FUEL APPLICATION TO DRIVE FOG MARKET
- FIGURE 11 YELLOW GREASE ACCOUNTED FOR LARGER SHARE
- FIGURE 12 CANADA TO REGISTER HIGHER CAGR DURING FORECAST PERIOD
- FIGURE 13 DRIVERS, RESTRAINTS, OPPORTUNITIES, AND CHALLENGES IN NORTH AMERICA FOG MARKET
- FIGURE 14 NORTH AMERICA FOG MARKET: PORTER’S FIVE FORCES ANALYSIS
- FIGURE 15 NORTH AMERICA FOG MARKET: SUPPLY CHAIN
- FIGURE 16 NORTH AMERICA FOG MARKET: CHANGING REVENUE MIX
- FIGURE 17 NORTH AMERICA FOG MARKET: ECOSYSTEM
- FIGURE 18 ASSESSMENT OF LUBRICANTS INDUSTRY
- FIGURE 19 MARKET SIZE ASSESSMENT OF LUBRICANTS AND SPECIALTIES OF LUBE OIL REFINERY
- FIGURE 20 STRATEGIC ASSESSMENT OF OFF-HIGHWAY LUBRICANT INDUSTRY
- FIGURE 21 INFLUENCE OF STAKEHOLDERS IN BUYING PROCESS
- FIGURE 22 KEY BUYING CRITERIA FOR FUEL AND PET FOOD FILLERS
- FIGURE 23 RESTAURANTS/FAST FOOD RESTAURANTS SEGMENT DOMINATES BROWN GREASE MARKET IN 2022
- FIGURE 24 RESTAURANTS/FAST FOOD RESTAURANTS SEGMENT DOMINATES YELLOW GREASE MARKET IN 2022
- FIGURE 25 FUEL SEGMENT DOMINATES NORTH AMERICA YELLOW GREASE MARKET IN 2022
- FIGURE 26 FUEL SEGMENT DOMINATES NORTH AMERICA BROWN GREASE MARKET IN 2022
- FIGURE 27 CANADA TO BE FASTEST-GROWING FOG MARKET
- FIGURE 28 NORTH AMERICA: FOG MARKET SNAPSHOT
- FIGURE 29 US MONTHLY BIODIESEL PRODUCTION, 2018–2020
- FIGURE 30 OVERVIEW OF STRATEGIES ADOPTED BY KEY PLAYERS IN FOG MARKET
- FIGURE 31 FOG MARKET: COMPANY EVALUATION QUADRANT, 2022
- FIGURE 32 START-UPS AND SMALL AND MEDIUM-SIZED ENTERPRISES (SMES) EVALUATION MATRIX, 2022
- FIGURE 33 DARLING INGREDIENTS, INC.: COMPANY SNAPSHOT
The study involved four major activities for estimating the current size of the North America FOG market. Exhaustive secondary research was conducted to gather information on the market, the peer market, and the parent market. The next step was to validate these findings, assumptions, and sizes with the industry experts across the value chain of the FOG market through primary research. Both the top-down and bottom-up approaches were employed to estimate the overall size of the North America FOG industry. After that, market breakdown and data triangulation procedures were used to determine the size of different segments and sub-segments of the market.
Secondary Research
In the secondary research process, various secondary sources such as Hoovers, Factiva, Bloomberg BusinessWeek, and Dun & Bradstreet were referred to, to identify and collect information for this study on the modular construction market. These secondary sources included annual reports, press releases & investor presentations of companies, white papers, certified publications, articles by recognized authors, regulatory bodies, trade directories, and databases.
Primary Research
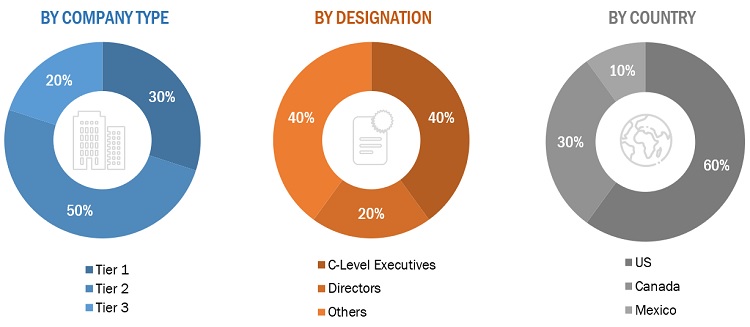
Various primary sources from both the supply and demand sides of the FOG market were interviewed to obtain qualitative and quantitative information. The primary sources from the supply-side included industry experts, such as Chief Executive Officers (CEOs), vice presidents, marketing directors, sales professionals, and related key executives from various leading companies and organizations operating in North America FOG industry. The breakdown of the profiles of primary respondents is as follows:
Breakdown of Primary Interviews

Notes: Companies are classified based on their revenue–Tier 1 = >USD 7 billion, Tier 2 = USD 500 million to USD 7 billion, and Tier 3 = <USD 500 million.
Others include sales, marketing, and product managers.
To know about the assumptions considered for the study, download the pdf brochure
Market Size Estimation
Both the top-down and bottom-up approaches were used to estimate and validate the size of the North America FOG market. These approaches were also used extensively to estimate the size of various dependent segments of the market. The research methodology used to estimate the market size included the following details:
- The key players were identified through extensive secondary research.
- The industry’s supply chain and market size, in terms of value, were determined through primary and secondary research processes.
- All percentage shares, split, and breakdowns were determined using secondary sources and verified through primary sources.
Data Triangulation
After arriving at the overall market size from the estimation process explained above, the total market was split into several segments and sub-segments. The data triangulation and market breakdown procedures were employed, wherever applicable, to complete the overall market engineering process and arrive at the exact statistics for all segments and sub-segments of the North America FOG market. The data was triangulated by studying various factors and trends from both the demand and supply sides.
Research Objectives
- To estimate and forecast the North America FOG market, in terms of value and volume.
- To provide detailed information about the major factors (drivers, restraints, opportunities, and challenges) influencing the market growth
- To define, describe, and forecast the market size based on generation, application, and region
- To forecast the market size, along with segments and submarkets, in key countries of North America: the US, Canada, and Mexico.
- To strategically analyze micro markets with respect to individual growth trends, prospects, and their contribution to the total market
- To analyze growth opportunities in the market for stakeholders and provide details on the competitive landscape for market leaders
- To strategically profile key players and comprehensively analyze their market shares and core competencies
- To analyze competitive developments, such as merger & acquisition, expansion & investment, agreement, and new product development in the modular construction market
Available Customizations
With the given market data, MarketsandMarkets offers customizations according to client-specific needs.
The following customization options are available for the North America FOG market report:
Product Analysis
- Product matrix, which offers a detailed comparison of the product portfolio of companies
Regional Analysis
- Further analysis of the modular construction market for additional countries
Company Information
- Detailed analysis and profiling of additional market players (up to five)


 Generating Response ...


Growth opportunities and latent adjacency in North America FOG Market