North America Renewable Diesel Market by feedstock (Waste oils, Vegetable oils), and Country (United States, Canada, Mexico) - Forecast to 2044
Updated on : April 15, 2024
North America Renewable Diesel Market
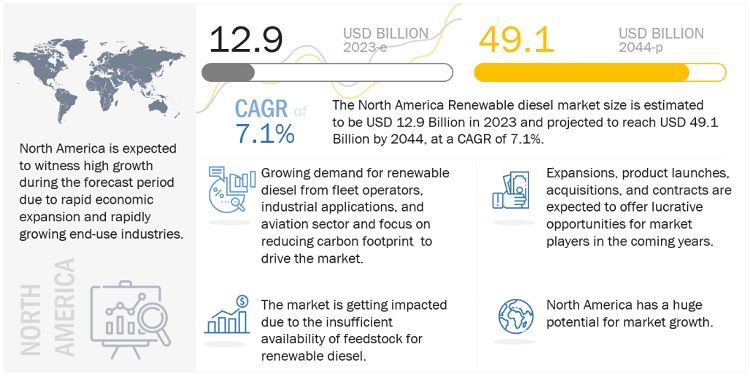
The North America Renewable Diesel Market was valued at USD 12.9 billion in 2023 and is projected to reach USD 49.1 billion by 2044, growing at 7.1% cagr from 2023 to 2044. The growth of this market is ascribed to the growing automotive industry and an increase in concern for the necessity for reduced environmental effects and tax credits by the government and investment in renewable energy. The technological advancement and enhancing supply chain of renewable diesel is the major opportunity in the market. However, the insufficient availability of feedstock may hinder the growth of the market.
Attractive Opportunities in the North America Renewable Diesel Market

e- Estimated, p- Projected
To know about the assumptions considered for the study, Request for Free Sample Report
North America Renewable Diesel Market Dynamics
Drivers- Tax credits by governments and investments in renewable energy
Governments across the globe are giving tax incentives and rebates to encourage the use of biofuels. For instance, the US and Europe have been providing support to the biofuel market in terms of tax incentives for producers, blenders, and suppliers. The US government gives USD 1 per gallon tax incentive to biofuel diesel manufacturers (however, the tax incentives expired on December 31, 2009). The Inflation Reduction Act of 2022 was approved by the US Senate in August 2022. The measure extends a number of current bioenergy and biofuel tax incentives in addition to including a wide variety of features that are advantageous to the biofuel and bioenergy businesses. The USD 1 per gallon blends tax credit for biodiesel and renewable diesel will be extended through the end of 2024.
Restraints- Limited availability of renewable diesel
Renewable diesel can be used in any diesel-powered engine. It can power cars on its own without needing to be blended and is a drop-in replacement for petroleum. It does not freeze at lower temperatures, unlike biodiesel, and is compatible with the current diesel engine infrastructure. The majority of manufacturers of heavy-duty trucks have also certified renewable diesel. However, it is a more recent option and has not been around as long as biodiesel. It is not yet being produced as widely and is thus less easily available to power passenger vehicles around the world. There is progress being made regarding the production of renewable diesel, but more has to be done to increase its use and accessibility.
Opportunities- Enhancing supply chain of renewable diesel
One of the main factors influencing the North America Renewable Diesel Industry is the rising demand for environmentally friendly fuels that guarantee complete combustion and can lower greenhouse gas (GHG) emissions. The demand for renewable diesel is also being fueled by its high degree of compatibility with current diesel engines. However, the demand-supply gap caused by insufficient production capacity is a major opportunity for market players. There is significant room for R&D in feedstock selection for product manufacturing, which is anticipated to open up prospects for market players.
Challenges - Availability of substitutes
The renewable diesel market may face competition from available alternatives. Long-term competitors include battery electric and fuel cell vehicles, renewable natural gas, and other alternative energy sources. While some diesel equipment might be replaced by renewable diesel, it is probable that conventional fuels will continue to be used in diesel equipment for many years to come, or conventional fuels may be used along with drop-in fuel substitutes to increase their sustainability.
North America Renewable Diesel Market Ecosystem

The Waste oil segment to register highest CAGR during forecast period.
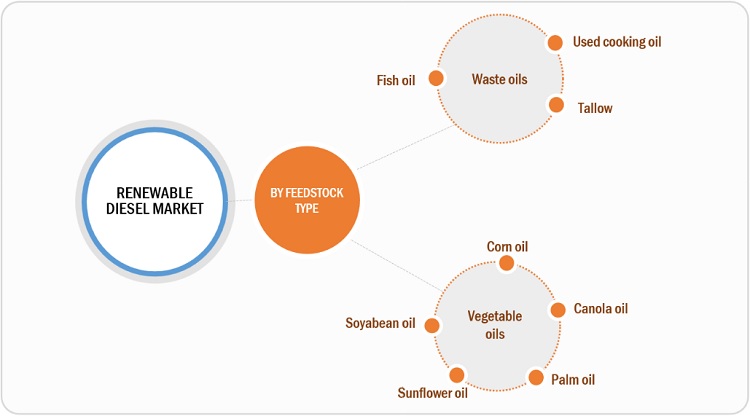
Tallow, used cooking oil, fish oil, lard, and poultry are considered under the waste oil segment. Tallow is also used as a primary ingredient in leather conditioners, aviation biofuels, and as flux for soldering. High availability and low price have increased the use of tallows in the production of biodiesel. A large quantity of tallow is produced in the US and Australia. According to the US Energy Information Administration, in 2020, biodiesel was second to fuel ethanol as the most produced and consumed biofuel in the US, accounting for about 11% and 12% of the total US biofuel production and consumption, respectively. Used cooking oil is less carbon intensive than soybean and other vegetable oil, resulting in more tradable credits under California's low-carbon fuel standard. This has increased feedstock pricing and demand as refiners and other manufacturers compete for supplies to profit from state and federal laws and tax credits. Fat obtained from poultry is a cheap and feasible source for biofuel production.
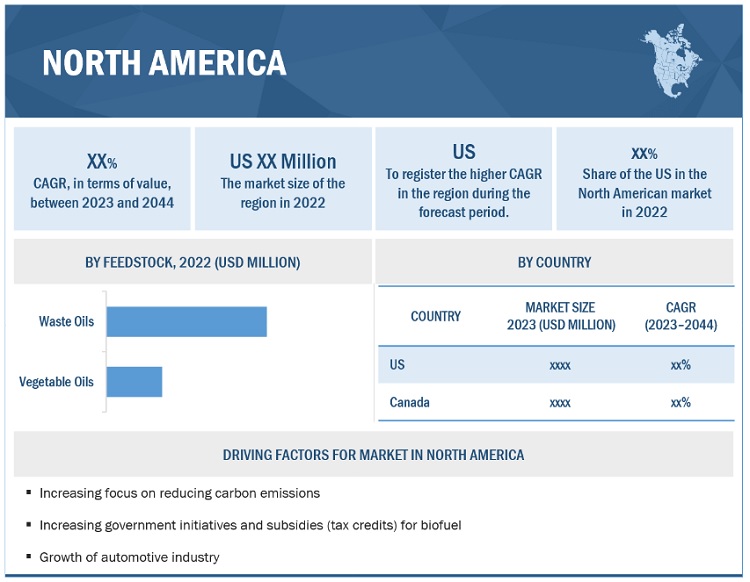
The US is the dominant country in the North America renewable diesel market in 2022.
The US dominates the renewable diesel market in North America and is expected to continue its dominance during the forecast period. Renewable diesel has some of the highest GHG reduction scores among existing programs, including the federal Renewable Fuel Standard (RFS) and the California Low-Carbon Fuel Standard (LCFS). As a result, program members are increasingly relying on renewable diesel to achieve escalating renewable fuel objectives. According to the EIA statistics, the 12, along with existing facilities, are estimated to generate roughly 135,000 barrels per day (bpd) of renewable diesel by 2025, up from around 80,000 bpd presently.

To know about the assumptions considered for the study, download the pdf brochure
North America Renewable Diesel Market Players
Key players such as Neste Oyj (Finland), Chevron Group (Renewable Energy Group) (US), PBF Energy Inc. (US), Valero Energy Corporation (US), Gevo, Inc (US), Phillips 66 (US), Marathon Petroleum Corporation (US), Aemetis, Inc. (US) have adopted various growth strategies, such as acquisitions, contracts, agreements, and new projects to increase their market shares and enhance their product portfolios.
Neste OYJ produces petroleum products and offers sustainable diesel. The company operates through the following divisions: Renewable Products, Oil Products, Marketing & Services, and Others. The Renewable Products segment manufactures, distributes, and retails renewable diesel, renewable jet fuels and solutions, renewable solvents, and renewable bioplastic raw materials. The oil products division offers diesel fuel, gasoline, aviation, and marine fuel, light and heavy fuel oils, base oils, gasoline additives, engine gasoline, solvents, liquid gases, and bitumen. The direct sales of petroleum products and related services are closed by the Marketing & Services division to end users such as individual drivers, businesses, transportation providers, farmers, and consumers of heating oil. The Others division offers engineering and technology solutions.
Chevron Renewable Energy Group is an energy and transportation company. The company is engaged in converting renewable resources into high-quality, sustainable fuels. The company's primary business is developing and manufacturing biofuels and renewable chemicals. It includes petroleum, renewable naphtha, glycerin, mixed fuels, REG-9000 biodiesel, bio-heat blended fuel, and renewable naphtha. With its wide range of operational capabilities, the company can produce advanced biofuels from oils, natural fats, sugar, and greases while also offering its customers services such as feedstock development, fuel production, construction and upgrade work, operations management, fuel marketing, and fuel distribution. The US, Germany, and the Netherlands are where the Renewable Energy Group (REG) is active.
North America Renewable Diesel Market Report Scope
|
Report Metric |
Details |
|
Years Considered |
2020–2044 |
|
Base year |
2022 |
|
Forecast period |
2023–2044 |
|
Unit considered |
Value (USD Billion) and Volume (Million Gallon) |
|
Segments |
Feedstock Type |
|
Regions |
North America Region |
|
Companies |
The major players are Neste OYJ (Finland), Chevron Renewable Energy Group (U.S.), PBF Energy Inc. (U.S.), Valero Energy Corporation (U.S.), Gevo, Inc. (U.S.) and others are covered in the Renewable diesel market. |
This research report categorizes the north america renewable diesel market on the basis of Feedstock Type and North America region.
North America Renewable Diesel Market by Feedstock Type
- Waste oils
- Vegetable oils
North America Renewable Diesel Market by Region
- North America
The market has been further analyzed for the key countries in each of these regions.
Recent Developments
- In November 2022, Neste acquired the used cooking oil collection and aggregation business from Crimson Renewable Energy to strengthen its renewable raw material sourcing platform.
- In September 2022, Neste acquired Agri Trading to strengthen its renewable raw material trading and sourcing to serve the increasing customer demand for renewable and circular solutions.
- In August 2022, Restaurant Technologies and Chevron Renewable Energy Group partnered to create a circular economy to reuse restaurant cooking oil as fuel.
Frequently Asked Questions (FAQ):
What are your views on the growth prospects of the North America renewable diesel market?
U.S. production capacity for renewable diesel could increase significantly through 2024, based on several announcements for projects that either are currently under construction or could be in development soon. This growth is driven by higher state and federal targets for renewable fuel, favorable tax credits, and the conversion of existing petroleum refineries into renewable diesel refineries.
What is the current scenario, and how will it change in the future?
The Government is giving the higher blending targets which is the major driver in the current scenario and which will increase the production capacities in the future.
What is the average price range for renewable diesel?
Approx. price is given below (2022)
Renewable diesel (California only): $4.05/gallon, B-20 Biodiesel: $3.05/gallon, Propane: $2.98/gallon
What are the trends in the North America renewable diesel market? How do you see the market changing in the future?
Biodiesel and renewable diesel are expected to play a growing role in decarbonizing the diesel transportation industry, as the increased attention on climate change and laws aimed at reducing greenhouse gas (GHG) emissions bring new growth drivers to the transportation and biofuels businesses.
Who are the major players in the North America renewable diesel market?
Neste Oyj (Finland), Chevron Group (Renewable Energy Group) (US), PBF Energy Inc. (US), Valero Energy Corporation (US) .
To speak to our analyst for a discussion on the above findings, click Speak to Analyst


- 5.1 INTRODUCTION
-
5.2 MARKET DYNAMICSDRIVERS- Increasing focus on reducing carbon emissions- Growth of automotive industry- Environment friendly and better performance compared with biodiesels- Tax credits by governments and investments in renewable energyRESTRAINTS- Limited availability of renewable diesel- Lack of proper infrastructureOPPORTUNITIES- Enhancing supply chain of renewable dieselCHALLENGES- Insufficient availability of feedstocks- Requirement for wastewater treatment facilities- Availability of substitutes- Finding suitable location for producing renewable diesel
-
5.3 INDUSTRY TRENDSPORTER'S FIVE FORCES ANALYSIS- Bargaining power of suppliers- Bargaining power of buyers- Threat of new entrants- Threat of substitutes- Intensity of competitive rivalry
- 5.4 SUPPLY CHAIN ANALYSIS
- 5.5 TECHNOLOGY ANALYSIS
- 5.6 PRICING ANALYSIS
-
5.7 PATENT ANALYSISINTRODUCTIONMETHODOLOGYDOCUMENT TYPEINSIGHTSJURISDICTION ANALYSISTOP COMPANIES/APPLICANTS
-
5.8 REGULATORY LANDSCAPEREGULATORY BODIES, GOVERNMENT AGENCIES, AND OTHER ORGANIZATIONS
-
5.9 ECOSYSTEM MAPPING
-
5.10 TRENDS/DISRUPTIONS IMPACTING CUSTOMERS' BUSINESSES
-
5.11 TRADE ANALYSISIMPORT SCENARIOEXPORT SCENARIO
- 5.12 KEY CONFERENCES AND EVENTS, 2022–2023
- 5.13 MACROECONOMIC OVERVIEW
-
5.14 CASE STUDYRENEWABLE DIESEL AIDING IN REDUCING GREENHOUSE GAS EMISSIONS BY USE IN PRIVATE FLEET IN CALIFORNIA
- 5.15 ADJACENT AND CONNECTED MARKETS
- 5.16 TENOR OF SALES CONTRACTS
- 6.1 INTRODUCTION
-
6.2 WASTE OILTALLOWUSED COOKING OILFISH OIL
- 6.3 VEGETABLE OIL
- 7.1 INTRODUCTION
-
7.2 NORTH AMERICAUS- To dominate market during forecast periodCANADA- Clean fuel standard to reduce country's greenhouse gas emissionsMEXICO

- 8.1 INTRODUCTION
- 8.2 STRATEGIES ADOPTED BY KEY PLAYERS
- 8.3 KEY STRATEGIES ADOPTED BY KEY MARKET PLAYERS
-
8.4 COMPANY EVALUATION QUADRANTSTARSPERVASIVE PLAYERSEMERGING LEADERSPARTICIPANTS
-
8.5 START-UPS/SMALL AND MEDIUM-SIZED ENTERPRISES (SMES) EVALUATION QUADRANTRESPONSIVE COMPANIESDYNAMIC COMPANIESSTARTING BLOCKSPROGRESSIVE COMPANIES
- 8.6 REVENUE ANALYSIS OF TOP PLAYERS
- 8.7 COMPETITIVE BENCHMARKING
-
8.8 COMPETITIVE SITUATION AND TRENDSPRODUCT LAUNCHESDEALS, 2019–2022OTHER DEVELOPMENTS, 2019–2022
-
9.1 KEY PLAYERSNESTE OYJ- Business overview- Products offered- Recent developments- MnM viewCHEVRON GROUP (RENEWABLE ENERGY GROUP)- Business overview- Products offered- Recent developments- MnM viewPBF ENERGY INC.- Business overview- Products offered- Recent developments- MnM viewVALERO ENERGY CORPORATION- Business overview- Products offered- Recent developments- MnM viewGEVO, INC.- Business overview- Products offered- Recent developments- MnM viewPHILLIPS 66- Business overview- Products offered- Recent developments- MnM viewMARATHON PETROLEUM CORPORATION- Business overview- Products offered- Recent developmentsAEMETIS, INC.- Business overview- Products offered- Recent developmentsSHELL PLC- Business overview- Products offered- Recent developmentsGLOBAL CLEAN ENERGY HOLDINGS, INC.- Business overview- Products offered- Recent developments
-
9.2 OTHER PLAYERSVERBIO VEREINIGTE BIOENERGIE AG (VERBIO AG)CANADA CLEAN FUELS INCFORGE HYDROCARBONS CORPORATIONCARGILL, INCORPORATEDGENUINE BIO-FUEL INC.ROCKY MOUNTAIN SUSTAINABLE ENTERPRISES, LLCFARMERS UNION INDUSTRIES LLCAMERICAN GREENFUELS, LLCSMISSON-MATHIS ENERGY SOLUTIONSIMPERIAL OIL LTD.LOWER MAINLAND BIODIESEL INC
- 10.1 DISCUSSION GUIDE
- 10.2 KNOWLEDGESTORE: MARKETSANDMARKETS’ SUBSCRIPTION PORTAL
- 10.3 CUSTOMIZATION OPTIONS
- 10.4 RELATED REPORTS
- 10.5 AUTHOR DETAILS
- TABLE 1 RENEWABLE DIESEL MARKET: PORTER'S FIVE FORCE ANALYSIS
- TABLE 2 COMPARISON OF PROPERTIES: PETROLEUM DIESEL, BIODIESEL, AND RENEWABLE DIESEL
- TABLE 3 NATIONAL AVERAGE PRICE BETWEEN OCTOBER 1 AND OCTOBER 15, 2022
- TABLE 4 GRANTED PATENTS ACCOUNTED FOR 41.8 % OF ALL PATENTS IN LAST 10 YEARS
- TABLE 5 LIST OF REGULATORY BODIES, GOVERNMENT AGENCIES, AND OTHER ORGANIZATIONS
- TABLE 6 IMPORT SCENARIO FOR HS CODE 382600, BY COUNTRY, 2017–2021 (USD THOUSAND)
- TABLE 7 EXPORT SCENARIO FOR HS CODE: 382600, BY COUNTRY, 2017–2021 (USD THOUSAND)
- TABLE 8 RENEWABLE DIESEL MARKET: DETAILED LIST OF CONFERENCES AND EVENTS
- TABLE 9 GDP GROWTH: ANNUAL PERCENTAGE CHANGE PROJECTION WORLDWIDE
- TABLE 10 SUSTAINABLE AVIATION FUEL (SAF)
- TABLE 11 RENEWABLE DIESEL
- TABLE 12 RENEWABLE DIESEL MARKET SIZE, BY FEEDSTOCK, 2020–2044 (GALLON MILLION)
- TABLE 13 RENEWABLE DIESEL MARKET SIZE, BY FEEDSTOCK, 2020–2044 (USD MILLION)
- TABLE 14 NORTH AMERICA: RENEWABLE DIESEL MARKET SIZE, BY COUNTRY, 2020–2044 (MILLION GALLON)
- TABLE 15 NORTH AMERICA: RENEWABLE DIESEL MARKET SIZE, BY COUNTRY, 2020–2044 (USD MILLION)
- TABLE 16 US RENEWABLE DIESEL FUEL AND OTHER BIOFUEL PLANT PRODUCTION CAPACITY ((JANUARY 1, 2022)
- TABLE 17 US: RENEWABLE DIESEL MARKET SIZE, BY FEEDSTOCK, 2020–2044 (MILLION GALLON)
- TABLE 18 US: RENEWABLE DIESEL MARKET SIZE, BY FEEDSTOCK, 2020–2044 (USD MILLION)
- TABLE 19 CANADA: RENEWABLE DIESEL MARKET SIZE, BY FEEDSTOCK, 2020–2044 (MILLION GALLON)
- TABLE 20 CANADA: RENEWABLE DIESEL MARKET SIZE, BY FEEDSTOCK, 2020–2044 (USD MILLION)
- TABLE 21 STRATEGIC POSITIONING OF KEY PLAYERS
- TABLE 22 RENEWABLE DIESEL MARKET: LIST OF KEY PLAYERS
- TABLE 23 RENEWABLE DIESEL MARKET: COMPETITIVE BENCHMARKING OF KEY PLAYERS
- TABLE 24 RENEWABLE DIESEL MARKET: PRODUCT LAUNCHES
- TABLE 25 RENEWABLE DIESEL MARKET: DEALS
- TABLE 26 RENEWABLE DIESEL MARKET: OTHER DEVELOPMENTS
- TABLE 27 NESTE OYJ: COMPANY OVERVIEW
- TABLE 28 NESTE OYJ: PRODUCTS OFFERED
- TABLE 29 NESTE OYJ: DEALS
- TABLE 30 CHEVRON GROUP (RENEWABLE ENERGY GROUP): COMPANY OVERVIEW
- TABLE 31 CHEVRON GROUP (RENEWABLE ENERGY GROUP): PRODUCTS OFFERED
- TABLE 32 CHEVRON GROUP (RENEWABLE ENERGY GROUP): DEALS
- TABLE 33 CHEVRON GROUP (RENEWABLE ENERGY GROUP): PRODUCT LAUNCHES
- TABLE 34 PBF ENERGY INC.: COMPANY OVERVIEW
- TABLE 35 PBF ENERGY INC.: PRODUCTS OFFERED
- TABLE 36 PBF ENERGY INC.: DEALS
- TABLE 37 PBF ENERGY INC.: OTHERS
- TABLE 38 VALERO ENERGY CORPORATION: COMPANY OVERVIEW
- TABLE 39 VALERO ENERGY CORPORATION: OTHERS
- TABLE 40 GEVO, INC.: COMPANY OVERVIEW
- TABLE 41 GEVO, INC.: PRODUCTS OFFERED
- TABLE 42 GEVO, INC.: DEALS
- TABLE 43 PHILLIPS 66: COMPANY OVERVIEW
- TABLE 44 PHILLIPS 66: PRODUCTS OFFERED
- TABLE 45 PHILLIPS 66: DEALS
- TABLE 46 PHILLIPS 66: OTHERS
- TABLE 47 MARATHON PETROLEUM CORPORATION: COMPANY OVERVIEW
- TABLE 48 MARATHON PETROLEUM CORPORATION: PRODUCTS OFFERED
- TABLE 49 MARATHON PETROLEUM CORPORATION: DEALS
- TABLE 50 MARATHON PETROLEUM CORPORATION: OTHERS
- TABLE 51 AEMETIS, INC.: COMPANY OVERVIEW
- TABLE 52 AEMETIS, INC.: PRODUCTS OFFERED
- TABLE 53 AEMETIS, INC.: DEALS
- TABLE 54 AEMETIS, INC.: OTHERS
- TABLE 55 SHELL PLC: COMPANY OVERVIEW
- TABLE 56 SHELL PLC: PRODUCTS OFFERED
- TABLE 57 SHELL PLC: DEALS
- TABLE 58 SHELL PLC: OTHERS
- TABLE 59 GLOBAL CLEAN ENERGY HOLDINGS, INC.: COMPANY OVERVIEW
- TABLE 60 GLOBAL CLEAN ENERGY HOLDINGS, INC.: PRODUCTS OFFERED
- TABLE 61 GLOBAL CLEAN ENERGY HOLDINGS, INC.: DEALS
- TABLE 62 VERBIO VEREINIGTE BIOENERGIE AG (VERBIO AG): COMPANY OVERVIEW
- TABLE 63 CANADA CLEAN FUELS INC: COMPANY OVERVIEW
- TABLE 64 FORGE HYDROCARBONS CORPORATION: COMPANY OVERVIEW
- TABLE 65 CARGILL, INCORPORATED: COMPANY OVERVIEW
- TABLE 66 GENUINE BIO-FUEL INC.: COMPANY OVERVIEW
- TABLE 67 ROCKY MOUNTAIN SUSTAINABLE ENTERPRISES, LLC: COMPANY OVERVIEW
- TABLE 68 FARMERS UNION INDUSTRIES LLC: COMPANY OVERVIEW
- TABLE 69 AMERICAN GREENFUELS, LLC: COMPANY OVERVIEW
- TABLE 70 SMISSON-MATHIS ENERGY SOLUTIONS: COMPANY OVERVIEW
- TABLE 71 IMPERIAL OIL LTD.: COMPANY OVERVIEW
- TABLE 72 LOWER MAINLAND BIODIESEL INC: COMPANY OVERVIEW
- FIGURE 1 NORTH AMERICA RENEWABLE DIESEL MARKET: RESEARCH DESIGN
- FIGURE 2 BREAKDOWN OF PRIMARY INTERVIEWS
- FIGURE 3 MARKET SIZE ESTIMATION: BOTTOM-UP APPROACH
- FIGURE 4 MARKET SIZE ESTIMATION: TOP-DOWN APPROACH
- FIGURE 5 NORTH AMERICA RENEWABLE DIESEL MARKET: DATA TRIANGULATION
- FIGURE 6 WASTE OIL SEGMENT ACCOUNTED FOR LARGER SHARE IN 2022
- FIGURE 7 NORTH AMERICA: RENEWABLE DIESEL MARKET, 2023–2044
- FIGURE 8 INCREASING FOCUS ON REDUCING CARBON EMISSIONS TO DRIVE RENEWABLE DIESEL MARKET GROWTH
- FIGURE 9 WASTE OIL SEGMENT ACCOUNTED FOR DOMINANT SHARE OF RENEWABLE DIESEL MARKET IN 2022
- FIGURE 10 CANADA TO REGISTER HIGHER CAGR IN NORTH AMERICA RENEWABLE DIESEL MARKET
- FIGURE 11 DRIVERS, RESTRAINTS, OPPORTUNITIES, AND CHALLENGES IN RENEWABLE DIESEL MARKET
- FIGURE 12 GLOBAL AUTOMOBILE PRODUCTION (UNITS)
- FIGURE 13 PORTER'S FIVE FORCES ANALYSIS: RENEWABLE DIESEL MARKET
- FIGURE 14 RENEWABLE DIESEL SUPPLY CHAIN
- FIGURE 15 NUMBER OF PATENTS PUBLISHED FROM 2013 TO 2023
- FIGURE 16 NUMBER OF PATENTS PUBLISHED, YEAR-WISE (2012-2022)
- FIGURE 17 PATENT ANALYSIS, BY TOP JURISDICTIONS
- FIGURE 18 TOP 10 COMPANIES/APPLICANTS WITH HIGHEST NUMBER OF PATENTS
- FIGURE 19 RENEWABLE DIESEL MARKET: ECOSYSTEM MAP
- FIGURE 20 RENEWABLE DIESEL MARKET: TRENDS IMPACTING CUSTOMER'S BUSINESS
- FIGURE 21 WASTE OIL SEGMENT DOMINATED RENEWABLE DIESEL MARKET IN 2022
- FIGURE 22 NORTH AMERICA: RENEWABLE DIESEL MARKET SNAPSHOT
- FIGURE 23 OVERVIEW OF STRATEGIES ADOPTED BY KEY PLAYERS IN RENEWABLE DIESEL MARKET
- FIGURE 24 RENEWABLE DIESEL MARKET: COMPANY EVALUATION QUADRANT, 2022
- FIGURE 25 START-UPS AND SMALL AND MEDIUM-SIZED ENTERPRISES (SMES) EVALUATION MATRIX, 2022
- FIGURE 26 REVENUE ANALYSIS OF KEY COMPANIES, 2019–2021
- FIGURE 27 NESTE OYJ: COMPANY SNAPSHOT
- FIGURE 28 CHEVRON GROUP (RENEWABLE ENERGY GROUP): COMPANY SNAPSHOT
- FIGURE 29 PBF ENERGY INC.: COMPANY SNAPSHOT
- FIGURE 30 VALERO ENERGY CORPORATION: COMPANY SNAPSHOT
- FIGURE 31 GEVO, INC.: COMPANY SNAPSHOT
- FIGURE 32 PHILLIPS 66: COMPANY SNAPSHOT
- FIGURE 33 MARATHON PETROLEUM CORPORATION: COMPANY SNAPSHOT
- FIGURE 34 AEMETIS, INC.: COMPANY SNAPSHOT
- FIGURE 35 SHELL PLC: COMPANY SNAPSHOT
This research involved the use of extensive secondary sources and databases, such as Factiva and Bloomberg, to identify and collect information useful for a technical and market-oriented study of the Renewable diesel market. Primary sources included industry experts from related industries and preferred suppliers, manufacturers, distributors, technologists, standards & certification organizations, and organizations related to all segments of the value chain of this industry. In-depth interviews have been conducted with various primary respondents, such as key industry participants, subject matter experts (SMEs), executives of key companies, and industry consultants, to obtain and verify critical qualitative and quantitative information as well as to assess growth prospects.
Secondary Research
In the secondary research process, various sources such as annual reports, press releases, and investor presentations of companies; white papers; and publications from recognized websites and databases have been referred to for identifying and collecting information. Secondary research has been used to obtain key information about the industry's supply chain, the total pool of key players, market classification and segmentation according to the industry trends to the bottom-most level, regional markets, and key developments from both market-and technology-oriented perspectives.
Primary Research
The North America Renewable Diesel Industry comprises several stakeholders in the supply chain, which include suppliers, processors, and end-product manufacturers. Various primary sources from the supply and demand sides of the markets have been interviewed to obtain qualitative and quantitative information. The primary participants from the demand side include key opinion leaders, executives, vice presidents, and CEOs of companies in the Renewable diesel market. Primary sources from the supply side include associations and institutions involved in the Renewable diesel industry, key opinion leaders, and processing players.
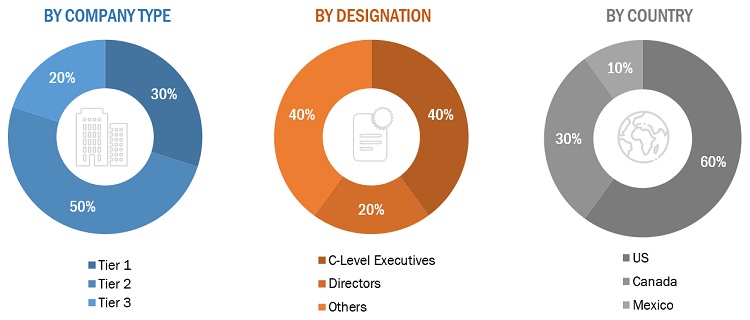
Following is the breakdown of primary respondents

Notes: Others include sales, marketing, engineers, and product managers.
Tier 1= USD 1 Billion; Tier 2 = below USD 1 Billion to USD 500 Million; and Tier 3 = Below USD 500 Million.
To know about the assumptions considered for the study, download the pdf brochure
Market Size Estimation
Both top-down and bottom-up approaches were used to estimate and validate the size of the North America Renewable diesel market. The research methodology used to estimate the market size includes the following:
- The key players in the industry were identified through extensive secondary research.
- The supply chain of the industry and market size, in terms of value, were determined through primary and secondary research.
- All percentage shares split, and breakdowns were determined using secondary sources and verified through primary sources.
- All possible parameters that affect the markets covered in this research study were accounted for, viewed in extensive detail, verified through primary research, and analyzed to obtain the final quantitative and qualitative data.
- The research includes the study of reports, reviews, and newsletters of key industry players along with extensive interviews with key officials, such as directors and marketing executives.
Market Size Estimation: Bottom-Up Approach
Data Triangulation
After arriving at the total market size from the estimation process explained above, the overall market was split into several segments and subsegments. To complete the overall market size estimation process and arrive at the exact statistics for all segments and subsegments, the data triangulation and market breakdown procedures have been employed, wherever applicable. The data have been triangulated by studying various factors and trends from both the demand and supply sides. In addition, the market size has been validated by using both the top-down and bottom-up approaches.
Report Objectives
- To define, describe, and forecast the North America Renewable diesel market in terms of value and volume.
- To provide insights regarding the significant factors influencing the growth of the market (drivers, restraints, opportunities, and challenges)
- To analyze and forecast the market based on type, reinforcement material, resin type, region, and end-use application.
- To forecast the market size, in terms of value and volume, with respect to North America region.
- To analyze the opportunities in the market for stakeholders and provide details of the competitive landscape.
- To strategically profile key players in the market.
- To analyze competitive developments in the market, such as new product launches, capacity expansions, and mergers & acquisitions.
- To strategically profile the leading players and comprehensively analyze their key developments in the market.
Available Customizations:
Along with the given market data, MarketsandMarkets offers customizations as per the specific needs of the companies. The following customization options are available for the report:
Product Analysis:
- Product Matrix which gives a detailed comparison of the product portfolio of each company.
Company Information:
- Detailed analysis and profiling of additional market players (up to 5)


 Generating Response ...


Growth opportunities and latent adjacency in North America Renewable Diesel Market