The study involved four major activities in estimating the market size for fuel additives market. Exhaustive secondary research was done to collect information on the market, the peer market, and the parent market. The next step was to validate these findings, assumptions, and sizing with industry experts across the value chain through primary research. Both top-down and bottom-up approaches were employed to estimate the complete market size. After that, the market breakdown and data triangulation procedures were used to estimate the market size of the segments and subsegments.
Secondary Research
Secondary sources used in this study included annual reports, press releases, and investor presentations of companies; white papers; certified publications; articles from recognized authors; and gold standard & silver standard websites such as Factiva, ICIS, Bloomberg, and others. The findings of this study were verified through primary research by conducting extensive interviews with key officials such as CEOs, VPs, directors, and other executives. The breakdown of profiles of the primary interviewees is illustrated in the figure below:
Primary Research
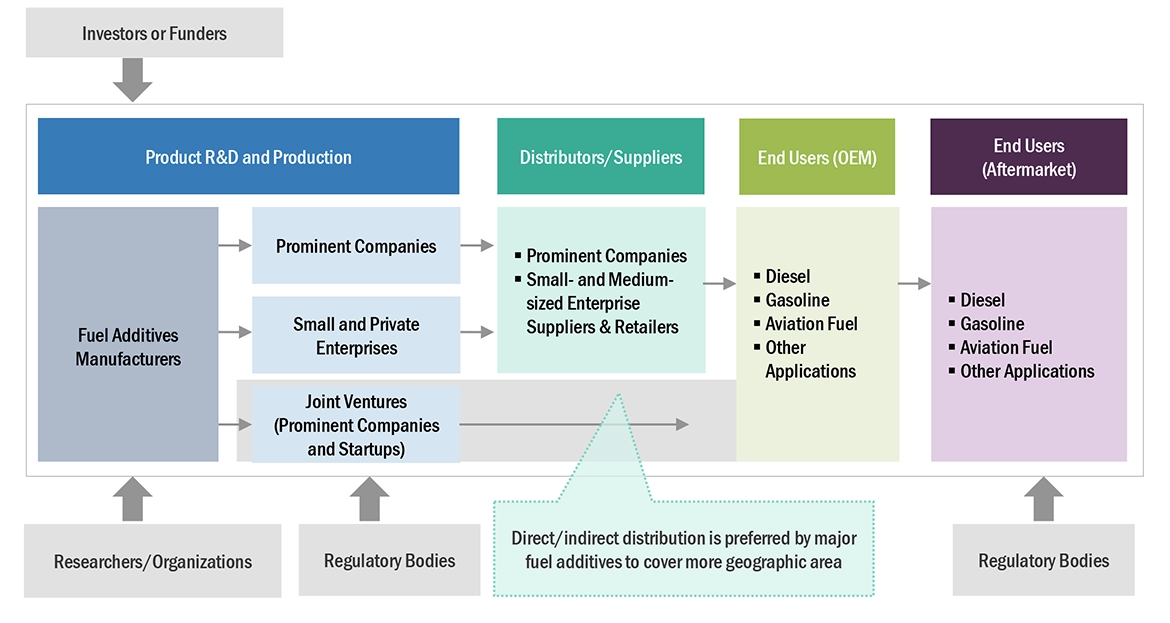
The fuel additives market comprises several stakeholders, such as raw material suppliers, end-product manufacturers, and regulatory organizations in the supply chain. The demand side of this market is characterized from key opinion leaders in various applications for the fuel additives market. The supply side is characterized by advancements in technology and diverse application industries. Various primary sources from both the supply and demand sides of the market were interviewed to obtain qualitative and quantitative information.
Breakdown of Primary Participants

Note: Tier 1, Tier 2, and Tier 3 companies are classified based on their market revenue in 2022/ 2023, available in the public domain, product portfolios, and geographical presence.
Other designations include consultants and sales, marketing, and procurement managers.
To know about the assumptions considered for the study, download the pdf brochure
|
COMPANY NAME
|
DESIGNATION
|
|
Innospec Inc.
|
Senior Manager
|
|
Infineum International Limited
|
Innovation Manager
|
|
Chevron Oronite Company LLC
|
Vice-President
|
|
Afton Chemical Corporation (US)
|
Production Supervisor
|
|
BASF SE
|
Sales Manager
|
Market Size Estimation
Both top-down and bottom-up approaches were used to estimate and validate the total size of the fuel additives market. These methods were also used extensively to estimate the size of various subsegments in the market. The research methodology used to estimate the market size includes the following:
-
The key players in the industry have been identified through extensive secondary research.
-
The supply chain of the industry has been determined through primary and secondary research.
-
All percentage shares, splits, and breakdowns have been determined using secondary sources and verified through primary sources.
-
All possible parameters that affect the markets covered in this research study have been accounted for, viewed in extensive detail, verified through primary research, and analyzed to obtain the final quantitative and qualitative data.
Fuel additives Market: Bottom-Up Approach

To know about the assumptions considered for the study, Request for Free Sample Report
Fuel additives Market: Top-Down Approach

Data Triangulation
After arriving at the overall market size—using the market size estimation processes as explained above—the market was split into several segments and subsegments. To complete the overall market engineering process and arrive at the exact statistics of each market segment and subsegment, data triangulation, and market breakdown procedures were employed, wherever applicable. The data was triangulated by studying various factors and trends from both the demand and supply sides in the fuel additives industry.
Market Definition
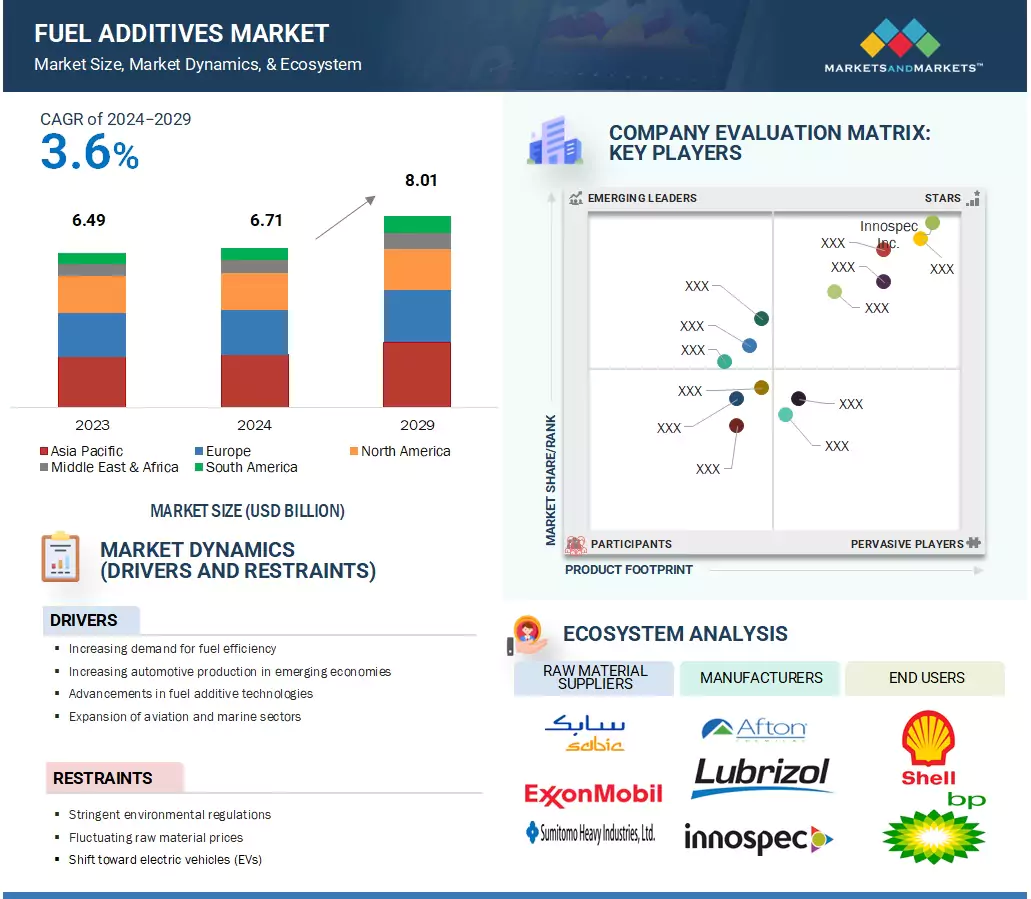
Fuel additives are chemicals used to improve the efficiency of fuel. These additives help fuels in meeting emission control standards and improve engine or vehicle performance. Apart from these functions, fuel additives also help in the reduction of corrosion and enhance combustion in various applications in the commercial, automotive, industrial, and aerospace sectors. They are compounds formulated to enhance the quality and efficiency of fuels.
Key Stakeholders
-
Fuel additives manufacturers
-
Fuel additives suppliers
-
Raw material suppliers
-
Service providers
-
Application sector companies
-
Government bodies
Report Objectives
-
To define, describe, and forecast the fuel additives market in terms of value
-
To provide detailed information regarding the drivers, opportunities, restraints, and challenges influencing market growth
-
To estimate and forecast the market size by ingredient type, end-use industry, and region
-
To forecast the size of the market for five main regions: North America, Asia Pacific, Europe, South America, and the Middle East & Africa, along with their key countries
-
To strategically analyze micromarkets1 with respect to their growth trends, prospects, and contribution to the overall market
-
To analyze opportunities in the market for stakeholders and provide a competitive landscape for market leaders
-
To analyze competitive developments, such as deals and expansions, in the market
-
To analyze the impact of the recession on the market
-
To analyze the impact of COVID-19 on the market and end-use industries
-
To strategically profile key players and comprehensively analyze their growth strategies
Available Customizations
Along with the given market data, MarketsandMarkets offers customizations according to the company’s specific needs. The following customization options are available for the report:
Regional Analysis
-
Further breakdown of a region with respect to a particular country or additional end-use industry
Company Information
-
Detailed analysis and profiles of additional market players (up to five)


Carlos
Dec, 2015
General information on fuel additive market and growth prospects.
Louis
Oct, 2014
Maxican maket of fuel additive market with understanding of key upcoming products and requirements of reaw materials .
John
Mar, 2016
Market analysis report on fuel additives companies to support a start-up fuel additive company with patent-pending technology..
Terry
Oct, 2016
Overview of the Fuel Additives market in AMEA Automotive and Marine applications. Also need details on manufacturers, end-users, and other industry participants..
Ramesh
Jan, 2013
Incomplete.
Chris
Jan, 2016
Go to market strategy for oil additive market.
Guy
Mar, 2017
Fuel enhancers for gasoline and diesel.
Martin
Sep, 2018
Diesel fuel additive in automotive mainly for trucks..
chief
Jul, 2014
Report for Fuel Additives market .
Anant
Aug, 2019
Specific information on petroleum products and processes.
Jody
May, 2019
Potential market opportunities for fuel and oil additives.
Dinesh
Sep, 2019
Understand the additive market better so to reorient the business in order to gain a bigger market share.
Arun
Sep, 2019
General market trends.
Georgy
Jun, 2014
Report on Nano carbon additive .
Paul
Aug, 2013
Interest in fuel additive market report.
anthony
Dec, 2016
Diesel fuel saver market and companies involved in intensive diesel engine operations..
Nameer
Nov, 2019
Market Potential of Consumer Fuel Additives in United Arab Emirates and regional exports market including vehicles on road, market competetions, pricing, and sales channel.
Perry
Oct, 2014
Irrelevant.
Chandler
Sep, 2013
Interested in market information on diesel fuel additive in Alaska.
Kevin
Aug, 2019
Global Fuel Additives market insights.
David
Jun, 2018
Custom study on fuel additive market.
Anthony
Jun, 2019
Fuel additives sales data for diesel engines and for petrol engines annually for U.S. and Canada and Mexico.
Adrian
Jun, 2014
want to buy the report fir less price option.
Chimbili
Jun, 2015
Specific information required on Fuel Additives for Deposit control, Antioxidant, Corrosion Inhibitor, Lubricity & Cetane Improvers and Others.
Alphonce
May, 2013
Information on fuel additives markets for Kenyan and East Africa market.
Rajagopalan
Apr, 2015
Looking for catalyst, Nano Lubricants, emulsion, direct water injection.
Michal
Mar, 2018
Interested in specific sections of Fuel additives market.
Robert
Mar, 2019
Specific insights on Fuel additives market..
Jon
Mar, 2019
Fuel catalyst for the bunker and diesel fuel markets mainly focused on marine vessels.