Oleoresins Market by Source (Paprika, Capsicum, Seed spices, Turmeric, Herbs, Ginger, Cinnamon & cassia), Application (Food & Beverages, Pharmaceutical & Nutraceutical, Personal Care Products, Feed), Extraction Process, and Region - Global Forecast to 2025


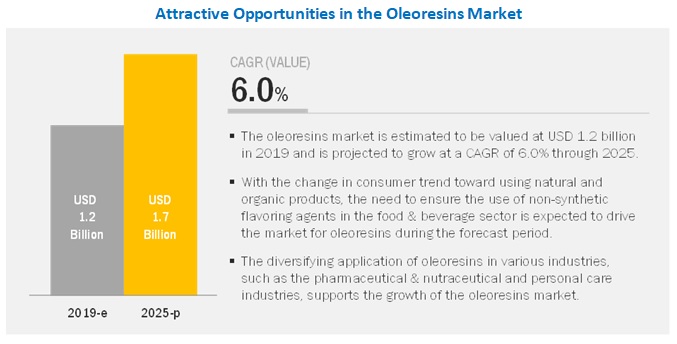
[153 Pages Report] According to MarketsandMarkets, the global oleoresins market is estimated to be valued at USD 1.2 billion in 2019 and is projected to reach USD 1.7 billion by 2025, recording a CAGR of 6.0% from 2019 to 2025. Oleoresins are botanical extracts of essential oils and resin constituents. They form the flavor and aromatic profile of the plant from which they are extracted. Oleoresins are volatile or non-volatile compounds obtained from spices using solvents. They prove to be more shelf-stable than the whole spice and can be custom-made to suit the requirements of the buyers. They are mainly used in processed foods such as soups, sauces, dressings, cheeses, chutneys, confectionery products, snacks, processed meat & seafood, baked food, processed vegetables, other dairy products, and beverages. Oleoresins are botanical extracts of essential oils and resin constituents.
The rising trend of using natural flavors in processed food and an increasing number of QSRs have led to a surge in demand for oleoresins. The rise in awareness regarding the side-effects of synthetic flavors and health benefits offered by phytomedicines and herbal extracts has significantly driven the growth of the market.
The market is estimated to be dominated by the food & beverage segment from 2019 to 2025.
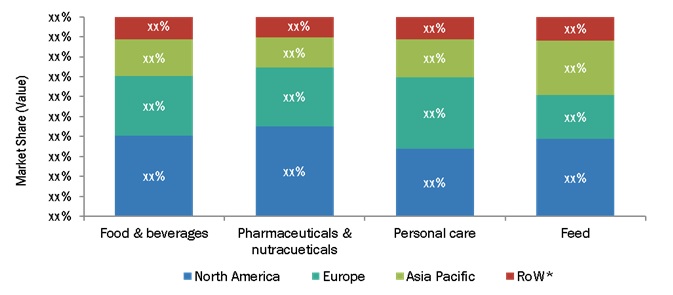
Among the different applications of plant extracts, the market is estimated to be dominated by the food & beverages segment from 2019 to 2025, owing to the wide usage of oleoresins that provide a natural flavor and fragrance in confectioneries and beverages. Awareness among consumers about the benefits of consuming products infused with natural ingredients such as oleoresins is on the rise. Along with this, the rising awareness of the ill-effects of heavy doses of allopathic medicine, an increase in antibiotic allergies among people, growth in the vegan population, and busy lifestyles drive the growth of this application.
North America is expected to dominate the oleoresins market during the forecast period.
North America accounted for the largest share in 2018 This dominance is attributed to the large scale demand for processed food in this region, which inadvertently creates a demand for oleoresins. Asian countries have traditionally been using plant-derived medicines for various applications. The oleoresins market has gained momentum, globally, at a commercial level in the last 10 to 15 years, owing to the growing instances of diseases caused by synthetic and chemical-based products. Furthermore, substantial investment in plant-derived nutritional & health products is expected to present promising opportunities for the growth and diversification of the Asia Pacific oleoresins market. Due to all these factors, the region is projected to grow at the highest CAGR during the forecast period.
Market Dynamics
Driver: Rise in the trend of using natural flavors in food processing
Oleoresins extracted from a particular spice or herb provide the flavor characteristics of its ground form with a more rapid flavor release. Oleoresins are produced to preserve the robust flavor and aroma of the spice and are extensively used in the natural food colors and flavors market. The increasing demand for natural and clean label products and strict regulations regarding the use of artificial colors and flavors in food products are factors driving the market demand for oleoresins. Moreover, additional health benefits of specific natural food colors and flavors and advanced technological innovations have boosted the growth of the natural food colors and flavors market, globally.
Restraints: Availability and maintaining stocks of raw materials and price fluctuations
Spices needed to produce oleoresins are available seasonally, whereas their requirement is throughout the year. The companies have to purchase and stock across seasons, bearing the risk of sudden loss. The prices of raw materials fluctuate and increase due to various agro-climatic reasons. The frequent price fluctuation in the commodity market poses a high risk for the stock.
Another serious concern faced by Indian manufacturers is the re-export time granted to processors. Processors can import spices but have to re-export them in a value-added form within 120 days or pay a duty of 70% of the import value. Indian processors are demanding an extension of the period, given that the availability of spices is dwindling in India due to the large scale dependence on the agro-climatic situation. The Oleoresins market has become a commodity product with thin margins. Reducing costs and moving up the value chain are the only ways companies can survive and grow in the market, making this a restraint for the entire market.
Opportunities: Increase in demand for feed phytogenics
Livestock require adequate nutrition and care for optimum growth and development; with the increase in awareness in terms of food safety, growing concerns about livestock health, and focus on increasing the feed intake, and greater resistance to the use of antibiotics in feed are some of the major factors that make oleoresins preferred ingredients in livestock nutrition.
Feed phytogenics or plant-based feed phytogenics such as herbs, essential oils, and oleoresins are a group of natural ingredients used in animal nutrition. They play an essential role in providing balanced nutrition to livestock. The rise in demand for various animal products such as eggs and meat are the major driving factors for the oleoresins market. To ensure that animals receive enough nutrition for better growth and development and, ultimately, good quality animal products, growers feed them with various products that increase their performance and productivity. The inclusion of feed phytogenics differs by livestock, depending upon their nutrient requirements and feed intake.
Scope of the Report
|
Report Metric |
Details |
|
Market size available for years |
2017–2025 |
|
Base year considered |
2018 |
|
Forecast period |
2019–2025 |
|
Forecast units |
Value (USD), Volume (Tons) |
|
Segments covered |
Source, Application, Extraction Process, and Region |
|
Geographies covered |
North America, Asia Pacific, Europe, and RoW |
|
Companies covered |
Major players covered, including: |
The research report categorizes the market into the following segments and subsegments:
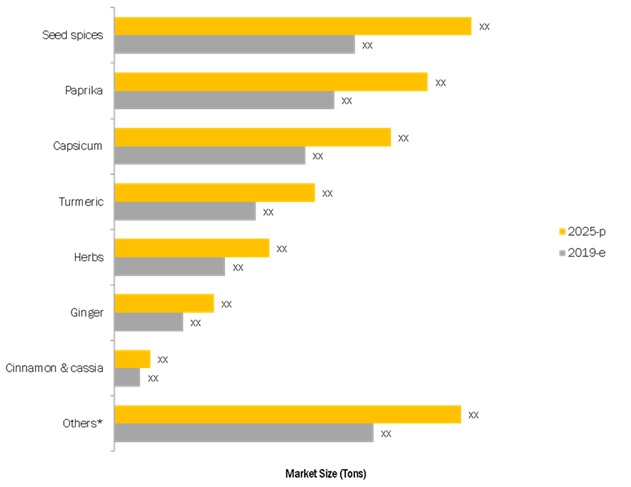
Sources
- Paprika
- Capsicum
- Seed spices
- Turmeric
- Ginger
- Cinnamon & cassia
- Herbs
- Others (cardamom, floral, asafetida, tamarind, nutmeg, onion, and garlic)
Application
- Food & beverages
- Pharmaceuticals & nutraceuticals
- Personal care products
- Feed
Extraction process
- Solvent extraction
- Supercritical fluid extraction
By Region
- North America
- Europe
- Asia Pacific
- Rest of the World (RoW)
Key Market Players
Synthite Industries Pvt. Ltd. (India), Givaudan (Switzerland), Akay Group Ltd. (India), Kancor Ingredients (India), Kalsec Inc. (US), and Plant Lipids (India).
Recent Developments
- In January 2019, Givaudan opened a new Flavors technical and commercial center in Casablanca, Morocco. The new center is designated to meet the evolving needs of its African customers with innovative taste and flavor solutions.
- In December 2017, PT. Indesso Aroma launched its new R&D; center at its Cileungsi plant in Indonesia. The center would support the company’s vision in developing ingredients for food, flavor, and fragrance industry.
- In January 2017, Mul Group announced the opening of its sister company—Mul Aromatiques, aimed at better and secured sourcing of raw materials. The new company supports the role of managing the production chain, which helps the company to sustain its processes.
- In 2017, Ungerer Columbia, a new subsidiary of the company, was established with the opening of a new plant in the Latin American region. The expansion would help the company to cater to the new market and strengthen its global presence.
Critical questions the report answers:
- What are the upcoming trends for the oleoresins market?
- Which segment provides the most opportunity for growth?
- Who are the leading vendors operating in this market?
- What are the opportunities for new market entrants?
To speak to our analyst for a discussion on the above findings, click Speak to Analyst
 Exclusive indicates content/data unique to MarketsandMarkets and not available with any competitors.
Table of Contents
1 Introduction (Page No. - 17)
1.1 Objectives of the Study
1.2 Market Definition
1.3 Study Scope
1.4 Periodization Considered
1.5 Currency Considered
1.6 Units Considered
1.7 Stakeholders
2 Research Methodology (Page No. - 21)
2.1 Research Data
2.1.1 Secondary Data
2.1.1.1 Key Data From Secondary Sources
2.1.2 Primary Data
2.1.2.1 Breakdown of Primary Interviews
2.2 Market Size Estimation
2.3 Market Breakdown and Data Triangulation
2.4 Research Assumptions & Limitations
2.4.1 Assumptions
2.4.2 Limitations
3 Executive Summary (Page No. - 29)
4 Premium Insights (Page No. - 33)
4.1 Opportunities in the Oleoresins Market
4.2 Oleoresins Market, By Process, 2018
4.3 North America: Oleoresins Market, By Source & Country
4.4 Oleoresins Market, By Application & Region, 2018
4.5 Oleoresins Market, By Key County/Region, 2019–2025
5 Market Overview (Page No. - 36)
5.1 Introduction
5.2 Macroeconomic Indicators
5.2.1 Increase in Demand for Oleoresins in Countries With Growing Gdp
5.2.2 Rise in Population
5.2.3 Increase in Middle-Class Population
5.3 Market Dynamics
5.3.1 Drivers
5.3.1.1 Growth in Demand From the Food Industry
5.3.1.1.1 Rise in the Trend of Using Natural Flavors in Food Processing 3
5.3.1.1.2 Burgeoning Demand for Processed Food
5.3.1.2 Increase in the Presence of Modern Retail Outlets
5.3.1.3 Growth in Awareness About Health Benefits Offered By Oleoresins
5.3.2 Restraints
5.3.2.1 Availability and Maintaining Stocks of Raw Materials and Price Fluctuations
5.3.2.2 High Initial Investment Costs Prevent New Entrants From Entering the Market
5.3.3 Opportunities
5.3.3.1 Increase in Demand for Feed Phytogenics
5.3.4 Challenges
5.3.4.1 Lack of Awareness and Ability to Distinguish Between Natural and Adulterated Products
5.4 Regulatory Framework
5.4.1 North America
5.4.1.1 US
5.4.2 Europe
5.4.3 Asia Pacific
5.4.3.1 India
5.4.3.2 Japan
5.4.3.3 Australia & New Zealand
6 Oleoresins Market, By Source (Page No. - 49)
6.1 Introduction
6.2 Paprika
6.2.1 Increase in Imports of Paprika Oleoresins From the European Region to Drive Its Market Growth
6.3 Capsicum
6.3.1 The Demand for Capsicum Oleoresins Remains High Due to Its Increasing Application in the Pharmaceuticals & Nutraceuticals Industry
6.4 Seed Spices
6.4.1 Black Pepper is One of the Majorly Used Seed Spice Oleoresin in the Food & Beverage Industry
6.5 Turmeric
6.5.1 Turmeric Oleoresins Possess Anti-Inflammatory and Antiseptic Properties
6.6 Herbs
6.6.1 Herb Oleoresins are Majorly Used for Flavoring Purpose
6.7 Ginger
6.7.1 Ginger Oleoresin is Used for Beverage Preparation in the North American Countries
6.8 Cinnamon & Cassia
6.8.1 Cinnamon & Cassia Oleoresin is Used as Preservative Due to Its Antimicrobial Properties
6.9 Others
7 Oleoresins Market, By Application (Page No. - 61)
7.1 Introduction
7.2 Food & Beverages
7.2.1 Growing Interest of Leading Flavor Manufacturers in Oleoresin Products Drives the Food & Beverage Industry
7.3 Pharmaceuticals & Nutraceuticals
7.3.1 Higher Demand for Capsicum Oleoresin in the Pharmaceutical Industry
7.4 Personal Care Products
7.4.1 Rise in Consumer Preference for Natural Personal Care Products Supports the Growth of Oleoresin
7.5 Feed
7.5.1 Growing Interest of Feed Manufacturers in Phytogenic Additives Drives the Market for Oleoresin in the Feed Sector
8 Oleoresins Market, By Extraction Process (Page No. - 69)
8.1 Introduction
8.2 Solvent Extraction
8.2.1 Solvent Extraction Process is Preferred for Oleoresin Extraction By Small Players in the Industry
8.3 Supercritical Fluid Extraction Process
8.3.1 Higher Efficacy of Supercritical Fluid Method in the Production of Quality Oleoresin Products to Drive Its Growth in the Market
9 Oleoresins Market, By Region (Page No. - 75)
9.1 Introduction
9.2 North America
9.2.1 US
9.2.1.1 The Demand for Naturally Flavored Products in the Food, Cosmetics, and Pharmaceutical Industries is Growing in the US
9.2.2 Mexico
9.2.2.1 Increase in Awareness of Healthier Diet and the Economic Growth of the Country to Influence the Market Growth
9.2.3 Canada
9.2.3.1 Rise in Concerns Over the Potential Side Effects of the Over-the-Counter (Otc) Products to Drive the Growth of the Market
9.3 Europe
9.3.1 Germany
9.3.1.1 Germany is One of the Top Importers of Oleoresins Across the Globe
9.3.2 UK
9.3.2.1 Use of Natural Spice and Herb Extracts as A Suitable Alternative for Synthetic Additives Drives the Market for Oleoresins in the UK
9.3.3 Italy
9.3.3.1 Growth in the Processed Food Industry Drives the Italian Oleoresins Market
9.3.4 Spain
9.3.4.1 Government Initiatives Toward Improving the Composition of Food & Beverage Products Drive the Market for Oleoresins
9.3.5 France
9.3.5.1 Increasing Use of Herbal Extracts in Pharmaceutical Products Drives the Herb-Based Oleoresins Market
9.3.6 Netherlands
9.3.6.1 Food Manufacturers in the Netherlands are Replacing Unhealthy Food Ingredients With Spices and Herbs
9.3.7 Rest of Europe
9.4 Asia Pacific
9.4.1 China
9.4.1.1 Setting Up of Facilities in Southeast Asia By Key Players Driving the Market for Oleoresins in China
9.4.2 India
9.4.2.1 Presence of Key Players Coupled With the Growing Awareness About the Benefits of Oleoresins Supporting Market Growth
9.4.3 Japan
9.4.3.1 The Growing Application of Oleoresins in the Nutraceuticals Segment Drives the Market Growth
9.4.4 Indonesia
9.4.4.1 Indonesia: One of the Major Exporters of Oleoresins
9.4.5 Rest of Asia Pacific
9.5 Rest of the World
9.5.1 South America
9.5.1.1 Release of Brazilian Dietary Guidelines in 2014 Changed the Consumer Food Preferences in South America
9.5.2 Middle East & Africa
9.5.2.1 Increase in Demand for Natural Ingredients in the Food Sector Drives the Growth of the Oleoresins Market
10 Competitive Landscape (Page No. - 114)
10.1 Overview
10.2 Competitive Leadership Mapping
10.2.1 Visionary Leaders
10.2.2 Innovators
10.2.3 Dynamic Differentiators
10.2.4 Emerging Companies
10.3 Strength of Product Portfolio
10.4 Business Strategy Excellence
10.5 Competitive Scenario
10.5.1 New Product Launches
10.5.2 Expansions
10.5.3 Acquisitions
10.5.4 Partnerships
11 Company Profiles (Page No. - 123)
(Business Overview, Products Offered, Recent Developments, SWOT Analysis & MnM View)*
11.1 Akay Group Ltd.
11.2 Synthite Industries Private Ltd.
11.3 AVT Naturals
11.4 Givaudan
11.5 Pt. Indesso Aroma
11.6 Vidya Herbs Private Limited
11.7 Ungerer & Company
11.8 Kancor Ingredients Limited
11.9 Plant Lipids
11.10 Kalsec Inc.
11.11 Gazignaire
11.12 Universal Oleoresins
Business Overview, Products Offered, Recent Developments, SWOT Analysis and MnM View; Please Note In-Depth Coverage in Various Sections is Subjected to Data Availability) the Companies are Listed in No Particular Order, But as A Representation of the Market’s Ecosystem.
12 Appendix (Page No. - 146)
12.1 Discussion Guide
12.2 Knowledge Store: Marketsandmarkets’ Subscription Portal
12.3 Available Customizations
12.4 Related Reports
12.5 Author Details
List of Tables (108 Tables)
Table 1 USD Exchange Rates, 2014–2018
Table 2 Oleoresins Market Snapshot, 2019 vs. 2025
Table 3 Oleoresins Market Size, By Source, 2017–2025 (USD Million)
Table 4 Oleoresins Market Size, By Source, 2017–2025 (Tons)
Table 5 Paprika: Oleoresins Market Size, By Region, 2017–2025 (USD Million)
Table 6 Paprika: By Market Size, By Region, 2017–2025 (Tons)
Table 7 Capsicum: By Market Size, By Region, 2017–2025 (USD Million)
Table 8 Capsicum: By Market Size, By Region, 2017–2025 (Tons)
Table 9 Seed Spices: By Market Size, By Region, 2017–2025 (USD Million)
Table 10 Seed Spices: By Market Size, By Region, 2017–2025 (Tons)
Table 11 Turmeric: By Market Size, By Region, 2017–2025 (USD Million)
Table 12 Turmeric: By Market Size, By Region, 2017–2025 (Tons)
Table 13 Herbs: By Market Size, By Region, 2017–2025 (USD Million)
Table 14 Herbs: By Market Size, By Region, 2017–2025 (Tons)
Table 15 Ginger: By Market Size, By Region, 2017–2025 (USD Million)
Table 16 Ginger: Oleoresins Market Size, By Region, 2017–2025 (Tons)
Table 17 Cinnamon & Cassia: By Market Size, By Region, 2017–2025 (USD Million)
Table 18 Cinnamon & Cassia: By Market Size, By Region, 2017–2025 (Tons)
Table 19 Others: By Market Size, By Region, 2017–2025 (USD Million)
Table 20 Others: By Market Size, By Region, 2017–2025 (Tons)
Table 21 Oleoresins Market Size, By Application, 2017–2025 (USD Million)
Table 22 Oleoresins Market Size, By Application, 2017–2025 (Tons)
Table 23 Food & Beverages: Oleoresins Market Size, By Region, 2017–2025 (USD Million)
Table 24 Food & Beverages: By Market Size, By Region, 2017–2025 (Tons)
Table 25 Pharmaceuticals & Nutraceuticals: Oleoresins Market Size, By Region, 2017–2025 (USD Million)
Table 26 Pharmaceuticals & Nutraceuticals: By Market Size, By Region, 2017–2025 (Tons)
Table 27 Personal Care Products: By Market Size, By Region, 2017–2025 (USD Million)
Table 28 Personal Care Products: By Market Size, By Region, 2017–2025 (Tons)
Table 29 Feed: Oleoresins Market Size, By Region, 2017–2025 (USD Million)
Table 30 Feed: Market Size, By Region, 2017–2025 (Tons)
Table 31 Oleoresins Market Size, By Extraction Process, 2017–2025 (USD Million)
Table 32 Oleoresins Market Size, By Extraction Process, 2017–2025 (Tons)
Table 33 Solvent Extraction: Oleoresins Market Size, By Region, 2017–2025 (USD Million)
Table 34 Solvent Extraction: By Market Size, By Region, 2017–2025 (Tons)
Table 35 Supercritical Fluid Extraction: By Market Size, By Region, 2017–2025 (USD Million)
Table 36 Supercritical Fluid Extraction: By Market Size, By Region, 2017–2025 (Tons)
Table 37 Oleoresins Market Size, By Region, 2017–2025 (USD Million)
Table 38 Market Size, By Region, 2017–2025 (Tons)
Table 39 North America: Oleoresins Market Size, By Country, 2017–2025 (USD Million)
Table 40 North America: By Market Size, By Country, 2017–2025 (Tons)
Table 41 North America: By Market Size, By Application, 2017–2025 (USD Million)
Table 42 North America: By Market Size, By Application, 2017–2025 (Tons)
Table 43 North America: By Market Size, By Source, 2017–2025 (USD Million)
Table 44 North America: By Market Size, By Source, 2017–2025 (Tons)
Table 45 North America: By Market Size, By Extraction Process, 2017–2025 (USD Million)
Table 46 North America: Market Size, By Extraction Process, 2017–2025 (Tons)
Table 47 US: By Market Size, By Application, 2017–2025 (USD Million)
Table 48 US: By Market Size, By Application, 2017–2025 (Tons)
Table 49 Mexico: Oleoresins Market Size, By Application, 2017–2025 (USD Million)
Table 50 Mexico: By Market Size, By Application, 2017–2025 (Tons)
Table 51 Canada: By Market Size, By Application, 2017–2025 (USD Million)
Table 52 Canada: By Market Size, By Application, 2017–2025 (Tons)
Table 53 Europe: By Market Size, By Country, 2017–2025 (USD Million)
Table 54 Europe: By Market Size, By Country, 2017–2025 (Tons)
Table 55 Europe: By Market Size, By Source, 2017–2025 (USD Million)
Table 56 Europe: By Market Size, By Source, 2017–2025 (Tons)
Table 57 Europe: Oleoresins Market Size, By Application, 2017–2025 (USD Million)
Table 58 Europe: Market Size, By Application, 2017–2025 (Tons)
Table 59 Europe: By Market Size, By Extraction Process, 2017–2025 (USD Million)
Table 60 Europe: Market Size, By Extraction Process, 2017–2025 (Tons)
Table 61 Germany: Oleoresins Market Size, By Application, 2017–2025 (USD Million)
Table 62 Germany: Market Size, By Application, 2017–2025 (Tons)
Table 63 UK: Oleoresins Market Size, By Application, 2017–2025 (USD Million)
Table 64 UK: By Market Size, By Application, 2017–2025 (Tons)
Table 65 Italy: By Market Size, By Application, 2017–2025 (USD Million)
Table 66 Italy: Oleoresins Market Size, By Application, 2017–2025 (Tons)
Table 67 Spain: By Market Size, By Application, 2017–2025 (USD Million)
Table 68 Spain: Oleoresins Market Size, By Application, 2017–2025 (Tons)
Table 69 France: By Market Size, By Application, 2017–2025 (USD Million)
Table 70 France: Oleoresins Market Size, By Application, 2017–2025 (Tons)
Table 71 Netherlands: By Market Size, By Application, 2017–2025 (USD Million)
Table 72 Netherlands: By Market Size, By Application, 2017–2025 (Tons)
Table 73 Rest of Europe: By Market Size, By Application, 2017–2025 (USD Million)
Table 74 Rest of Europe: By Market Size, By Application, 2017–2025 (Tons)
Table 75 Asia Pacific: Oleoresins Market Size, By Country, 2017-2025 (USD Million)
Table 76 Asia Pacific: By Market Size, By Country, 2017-2025 (Tons)
Table 77 Asia Pacific: By Market Size, By Source, 2017-2025 (USD Million)
Table 78 Asia Pacific: By Market Size, By Source, 2017-2025 (Tons)
Table 79 Asia Pacific: Oleoresins Market Size, By Application, 2017-2025 (USD Million)
Table 80 Asia Pacific: By Market Size, By Application, 2017-2025 (Tons)
Table 81 Asia Pacific: By Market Size, By Extraction Process, 2017-2025 (USD Million)
Table 82 Asia Pacific: By Market Size, By Extraction Process, 2017-2025 (Tons)
Table 83 China: Oleoresins Market Size, By Application, 2017-2025 (USD Million)
Table 84 China: By Market Size, By Application, 2017-2025 (Tons)
Table 85 India: By Market Size, By Application, 2017-2025 (USD Million)
Table 86 India: By Market Size, By Application, 2017-2025 (Tons)
Table 87 Japan: By Market Size, By Application, 2017-2025 (USD Million)
Table 88 Japan: By Market Size, By Application, 2017-2025 (Tons)
Table 89 Indonesia: Oleoresins Market Size, By Application, 2017-2025 (USD Million)
Table 90 Indonesia: Oleoresins Market Size, By Application, 2017-2025 (Tons)
Table 91 Rest of Asia Pacific: Oleoresins Market Size, By Application, 2017-2025 (USD Million)
Table 92 Rest of Asia Pacific: By Market Size, By Application, 2017-2025 (Tons)
Table 93 RoW: Oleoresins Market Size, By Region, 2017–2025 (USD Million)
Table 94 RoW: By Market Size, By Region, 2017–2025 (Tons)
Table 95 RoW: Oleoresins Market Size, By Source, 2017–2025 (USD Million)
Table 96 RoW: By Market Size, By Source, 2017–2025 (Tons)
Table 97 RoW: Market Size, By Application, 2017–2025 (USD Million)
Table 98 RoW: Market Size, By Application, 2017–2025 (Tons)
Table 99 RoW: By Market Size, By Extraction Process, 2017–2025 (USD Million)
Table 100 RoW: Market Size, By Extraction Process, 2017–2025 (Tons)
Table 101 South America: Oleoresins Market Size, By Application, 2017–2025 (USD Million)
Table 102 South America: By Market Size, By Application, 2017–2025 (Tons)
Table 103 Middle East & Africa: By Market Size, By Application, 2017–2025 (USD Million)
Table 104 Middle East & Africa: Oleoresins Market Size, By Application, 2017–2025 (Tons)
Table 105 New Product Launches, 2014-2019
Table 106 Expansions, 2014-2019
Table 107 Acquisitions, 2014-2019
Table 108 Investments, Agreements, and Partnerships, 2014-2019
List of Figures (41 Figures)
Figure 1 Oleoresins: Market Segmentation
Figure 2 Regional Segmentation
Figure 3 Research Design
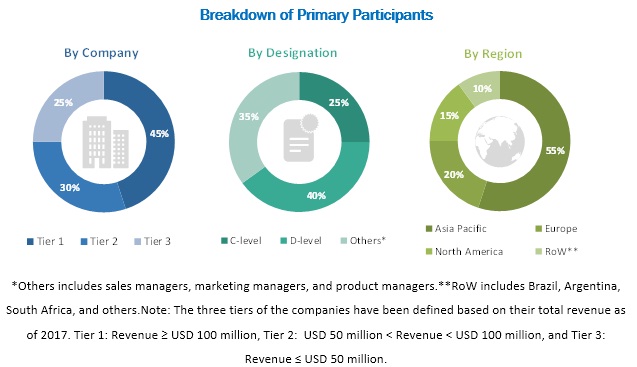
Figure 4 Breakdown of Primary Interviews: By Company Type, Designation, and Region
Figure 5 Market Size Estimation Methodology: Top-Down Approach
Figure 6 Market Size Estimation Methodology: Bottom-Up Approach
Figure 7 Market Breakdown and Data Triangulation
Figure 8 Oleoresins Market Size, By Source, 2019 vs. 2025 (USD Million)
Figure 9 Market Size, By Application, 2019 vs. 2025 (USD Million)
Figure 10 Market Size, By Extraction Process, 2019 vs. 2025 (USD Million)
Figure 11 Market Share & Growth, By Region
Figure 12 Rising Demand for Processed Food Drives the Market for Oleoresins
Figure 13 Solvent Extraction Process Gaining Popularity for Oloeresin Production
Figure 14 North America: the Us Was One of the Major Importers of Oleoresins Across the Globe in 2018
Figure 15 North America Accounted for the Largest Share of the Market for the Food & Beverages in 2018
Figure 16 India is Projected to Witness High Growth During the Forecast Period
Figure 17 Asia Pacific: Gdp Growth, 2015–2018
Figure 18 Global Population Projected to Reach ~9.8 Billion By 2050
Figure 19 Middle-Class Population is Projected to Be the Largest in Asia Pacific By 2030
Figure 20 Market Dynamics
Figure 21 Attractive Opportunities in the Natural Food Colors & Flavors Market
Figure 22 Attractive Opportunities in the Processed Food Market
Figure 23 Indian Foodservice Industry, By Category, 2017
Figure 24 Poultry is Projected to Be the Fastest-Growing Segment Between 2018 & 2023
Figure 25 Oleoresins Market Size, By Source, 2019 vs. 2025 (USD Million)
Figure 26 Oleoresins Market Size, By Source, 2019 vs. 2025 (Tons)
Figure 27 Oleoresins Market Size, By Application, 2019 vs. 2025 (USD Million)
Figure 28 Oleoresins Market Size, By Application, 2019 vs. 2025 (Tons)
Figure 29 Oleoresins Market Size, By Extraction Process, 2019 vs. 2025 (USD Million)
Figure 30 Oleoresins Market Size, By Extraction Process, 2019 vs. 2025 (Tons)
Figure 31 India to Record the Highest Growth Rate During the Forecast Period in the Oleoresins Market
Figure 32 North America: Oleoresins Market Snapshot
Figure 33 Asia Pacific: Regional Snapshot
Figure 34 Global Oleoresins Market (Global): Competitive Leadership Mapping, 2018
Figure 35 Key Developments of the Leading Players in the Oleoresins Market, 2014 –2019
Figure 36 Akay Group: SWOT Analysis
Figure 37 Synthite Industries Private Ltd.: SWOT Analysis
Figure 38 AVT Naturals: Company Snapshot
Figure 39 AVT Naturals: SWOT Analysis
Figure 40 Givaudan: Company Snapshot
Figure 41 Givaudan: SWOT Analysis
The study involved four major activities in estimating the oleoresins market size. Exhaustive secondary research was conducted to collect information on the market, peer market, and parent market. The next step was to validate these findings, assumptions, and sizing with industry experts across the value chain through primary research. Both the top-down and bottom-up approaches were employed to estimate the complete market size. Thereafter, market breakdown and data triangulation were used to estimate the market size of segments and subsegments.
Secondary Research
In the secondary research process, various secondary sources such as Hoovers, Bloomberg BusinessWeek, and Dun & Bradstreet were referred to, to identify and collect information for this study. These secondary sources included annual reports, press releases & investor presentations of companies, white papers, certified publications, articles by recognized authors, gold & silver standard websites, food safety organizations, regulatory bodies, trade directories, and databases.
Primary Research
The market comprises several stakeholders, such as raw material suppliers, processors, end-product manufacturers, and regulatory organizations in the supply chain. The demand-side of the market is characterized by the presence of food and beverage products processors, importers/exporters, and research institutions. The supply-side is characterized by the presence of key oleoresins manufacturers, suppliers, distributors, researchers, and service providers. Various primary sources from both the supply- and demand-sides of the market were interviewed to obtain qualitative and quantitative information. Given below is the breakdown of the primary respondents.
To know about the assumptions considered for the study, download the pdf brochure
Market Size Estimation
Both the top-down and bottom-up approaches were used to estimate and validate the total size of the oleoresins market. These methods were also used extensively to estimate the size of various subsegments in the market. The research methodology used to estimate the market size includes the following:
- The key players were identified through extensive primary and secondary research.
- The value chain and market size of the oleoresins market, in terms of value, were determined through primary and secondary research.
- All percentage shares, splits, and breakdowns were determined using secondary sources and verified through primary sources.
- All possible parameters that affect the market covered in this research study were accounted for, viewed in extensive detail, verified through primary research, and analyzed to obtain the final quantitative and qualitative data.
- The research included the study of reports, reviews, newsletters of top market players, along with extensive interviews for opinions from key leaders, such as CEOs, directors, and marketing executives.
Data Triangulation/
After arriving at the overall market size from the estimation process described above, the total market was split into several segments. To complete the overall market engineering process and arrive at the exact statistics for all segments, the data triangulation and market breakdown procedures were employed, wherever applicable. The data was triangulated by studying various factors and trends from both the demand and supply sides. In addition, the market size was validated using both top-down and bottom-up approaches. It was then verified through primary interviews. Hence, three approaches were adopted—top-down approach, bottom-up approach, and the one involving expert interviews. Only when the values arrived at from the three points match, the data is assumed to be correct.
Report Objectives
- To describe and forecast the oleoresins market, in terms of source, application, extraction process, and region
- To describe and forecast the oleoresins market, in terms of value, by region–Asia Pacific, Europe, North America, and the Rest of the World-along with their respective countries
- To provide detailed information regarding the major factors influencing market growth (drivers, restraints, opportunities, and challenges)
- To strategically analyze micromarkets with respect to individual growth trends, prospects, and contributions to the overall market
- To study the complete value chain of oleoresins market
- To analyze opportunities in the market for stakeholders by identifying the high-growth segments of the oleoresins market
- To strategically profile the key players and comprehensively analyze their market position, in terms of ranking and core competencies, along with details on the competitive landscape of market leaders
- To analyze strategic approaches such as acquisitions & divestments, expansions, product launches & approvals, and agreements in the oleoresins market
Available Customizations
Based on the given market data, MarketsandMarkets offers customizations in the reports according to client-specific requirements. The available customization options are as follows:
Geographic Analysis
- Further breakdown of the Rest of the World oleoresins market into South America and the Middle East & Africa
- Further breakdown of the Rest of Asia Pacific oleoresins market into Vietnam, Malaysia, Thailand, the Philippines, and South Korea.
- Further breakdown of the Rest of Europe oleoresins market into Austria, Portugal, Ireland, Sweden, Bulgaria, Belgium, Turkey, Russia, Poland, and Denmark.
Segment Analysis
- Further breakdown of the oleoresins applications market, by country


Growth opportunities and latent adjacency in Oleoresins Market
I would like to know which segments of the Oleoresins market provide maximum growth opportunities.
I am interested in two reports - The food Flavors market and the Oleoresins market. I need to know if the data allows for the creation of perhaps a pivot table that allows us to do a �deep dive� rather than a �criss-cross� for these two reports? I would also like to look at and quantify Natural Flavors, in China, by Application, by Flavor and by Form or any other such deep dives.
I am interested in two reports - The food Flavors market and the Oleoresins market. I need to know if the data allows for the creation of perhaps a pivot table that will enable us to do a �deep dive� rather than a �criss-cross� for these two reports. I would also like to look at and quantify Natural Flavors, in China, by Application, by Flavor, and by Form or any other such deep dives.