Titanium Dioxide Market by Grade (Rutile, Anatase), Process (Sulfate, Chloride), Application (Paints & Coating, Plastics, Paper, Inks), & Region(North America, Europe, Asia Pacific, MEA, South America) - Global Forecasts to 2026
Updated on : March 20, 2024
Titanium Dioxide Market
The global titanium dioxide market was valued at USD 20.9 billion in 2021 and is projected to reach USD 27.9 billion by 2026, growing at 5.9% cagr from 2021 to 2026. It is driven by paints & coatings application in construction, automotive and industries during the forecast period. APAC is dominating the region in paint & coating applications with an increase in demand from China and India.
To know about the assumptions considered for the study, Request for Free Sample Report
Titanium Dioxide Market Dynamics
Drivers: Thriving construction sector worldwide
The booming construction industry, including both residential and non-residential infrastructure, across the world is one of the major factors boosting the demand for paints and coatings. The housing market in the US is growing steadily. According to the US Census Bureau, the total construction value in April 2021 increased by 9.8% compared to April 2020. The APAC region is the largest market for the construction industry, with China, India, and other Southeast Asian countries being the epicenter of construction activities. The growth in the construction industry is driven by rapid urbanization and industrialization, an increase in purchasing power parity (PPP), a high standard of living, and growth in disposable income. China is the leading market for titanium dioxide in the construction sector.
Titanium dioxide finds applications in architectural paints and coatings. Architectural paints must have UV and water resistance, whereas some specialized coatings need to be chemical and corrosion-resistant. Titanium dioxide provides an excellent durable coating that can resist UV rays from the sun and maintain a newly painted look for a significant time. Titanium dioxide is used in paints and coatings meant for exterior surfaces for better color fading, chalking, and cracking resistance. Further, it has a photocatalyst ability that enables self-cleaning and provides protection against bacteria, algae, fungi, and pollution. The use of titanium dioxide in paints and coatings ensure ease of application, a long-lasting fresh look, fewer coatings, easy cleaning surfaces, According to the OECD, the annual household disposable income has increased globally. The high disposable income of consumers increases their purchasing power and also improves the standard of living. These factors drive the demand for interior decoration and home renovation, leading to the surging demand for decorative paints and coatings, which, in turn, accelerates the growth of the titanium dioxide market for the construction sector
Restraints: Stringent environmental policies of governments, especially in APAC and EU, banning use of titanium dioxide
Several waste products are released during the production of titanium dioxide; therefore, several restrictions have been implemented by governments across the world to control the emission and ensure careful disposal of this waste.
Titanium dioxide is manufactured either by using sulfuric acid called the sulfate process or chlorine, which is known as the chloride process. In the sulfate process, the proposition of waste release is higher—China is the leading manufacturer of titanium dioxide globally. Most manufacturing plants utilize the sulfate process to manufacture titanium dioxide and dump a large amount of sulphuric acid into the seawater.
Titanium dioxide itself is acidic, and its improper disposable method creates numerous environmental problems. The dumping of sulfuric acid into the sea causes a sudden drop in the pH value of receiving water and reduces the oxygen levels in the water, thereby destroying marine life. Also, when dumped into the soil, sulphuric acid is released into the air, causing a harmful effect on the environment. The Government of China and the European government have enforced environmental policies to prohibit the discharge of the waste generated during the manufacturing of titanium dioxide into rivers or seawater and harmonize programs that limit discharge and wastewater. All these regulations restrict the production of titanium dioxide across many regions, impacting the growth of the titanium dioxide market.
Opportunities: Increased use of ultrafine particles of titanium dioxide in cosmetics and construction industries
Ultrafine titanium dioxide, also called nanoscale titanium dioxide, has a particle size of less than 100 nm. Ultrafine nanomaterial titanium dioxide has properties such as excellent transparency, better dispensability, and more effective ultraviolet (UV) scattering and absorbing properties. UV radiations released by the sun are available in two wavelengths: UVA and UVB. These UV radiations are harmful to the skin and cause sunburn, cancer, and other problems. The ultrafine titanium dioxide is used in various applications in the cosmetics industry, such as creams, loose and pressed powders, eyeshadows, blush, and sunscreens. The ultrafine nanoparticles of titanium dioxide provide flawless effect, better protection against harmful sun rays, and brightness.
Nanoparticles of titanium dioxide are also rapidly used in the construction industry. Construction materials are combined with titanium photocatalyst to improve self-cleaning, antibacterial action, air purification, and pollution resistance. Nanoparticles of titanium dioxide are primarily used in the construction industry of the United States, Germany, China, and Spain.
Challenges: Volatility in cost of Titanium Dioxide
The fluctuation in the prices of raw materials required in the production of titanium dioxide directly impacts the growth of the titanium dioxide market. Factors impacting the prices of raw materials necessary to manufacture titanium dioxide are the constant changes in import and export policies and stringent government norms imposed for environmental safety. In China, the sulfate process is used to produce titanium dioxide. Hence, the use of sulfur in the sulfuric acid industry in China mainly relies on export. Therefore, the change in the international market price of sulfur will directly affect the price of sulfuric acid, thereby affecting the price of titanium dioxide.
Recently, volatility in titanium dioxide prices is observed because of constant changes in the prices of raw materials such as ilmenite and rutile. Hence, any fluctuations in their price affecting the manufacturing cost of the product. The leading Venator company has stated the price change in raw materials as one of the main reasons for the changes in the prices of titanium dioxide. Moreover, the shift toward the chloride process for titanium dioxide production also impacts the price of titanium dioxide.
Paints & Coatings is the largest segment by application in the Titanium Dioxide market.
The paints & coatings industry is the largest segment by applications for the Titanium Dioxide market. Titanium dioxide is utilized in paints and coatings to provide better coverage, brightness, whiteness, opacity, and durability. Titanium dioxide finds applications in different paints and coatings that include architectural coatings, automotive OEM coatings, general industrial finishes, powder coatings, waterborne paints, protective coatings, wood finishes, and other coatings. The rapidly growing housing and construction sector, increasing gross domestic product (GDP), ongoing rapid urbanization, and increasing disposable income propel the paints and coatings market. In addition, technological advancements in automotive, wood, and industrial sectors support market growth
APAC is estimated to be the largest market for Titanium Dioxide.
APAC accounted for the largest share of the Titanium Dioxide market in 2020, followed by Europe and North America. Increasing investments in infrastructure development projects, growing urbanization, improving standard of living, and thriving automotive sector, as well as high economic growth, are the key factors for the region's overall growth. The strengthening economy of countries such as China and India attracts new investments from global manufacturers. APAC is the largest market for the paints and coating industry, driven by the increasing population and rapid urbanization in China and India. The titanium dioxide market in the region is dominated by China, followed by India. Titanium dioxide is primarily utilized in the construction and automobile industries for paints and coatings applications. Titanium dioxide manufacturer in the APAC region include. Lomon Billions Group (China), TAYCA CORPORATION (Japan), ISHIHARA SANGYO KAISHA, LTD.(Japan), Travancore Titanium Products Ltd.(India) and Others. Lomon Billions Group, the third-largest manufacturer of titanium dioxide globally, has its production plants in China. The company has a production capacity of over 1.01 million tons of titanium dioxide annually. Apart from Lomon Billions, there many small and mid-size enterprises (SMEs) produce titanium dioxide in the APAC region.
To know about the assumptions considered for the study, download the pdf brochure
Titanium Dioxide Market Players
The leading players in the Titanium Dioxide market are The Chemours Company (US), Tronox Holding PLC (US), Lomon Billions Group (China), Venator Materials PLC (UK), Kronos Worldwide Inc. (US), INEOS (UK), CINKARNA Celje d.d. (Slovenia), Evonik Industries AG (Germany), TAYCA CORPORATION (Japan), ILUKA RESOURCES (Australia), and ISHIHARA SANGYO KAISHA, LTD. (Japan).
Read More: Titanium Dioxide Companies
Titanium Dioxide Market Report Scope
Report Metric |
Details |
Market Size Value in 2021 |
USD 20.9 billion |
Revenue Forecast in 2026 |
USD 27.9 billion |
CAGR |
5.9% |
Years Considered |
2019-2026 |
Base year |
2020 |
Forecast period |
2021-2026 |
Unit considered |
Value (USD Million), Volume (Kilotons) |
Segments |
Grade, Process, Applications and Region |
Regions |
APAC, North America, Europe, Middle East & Africa and South America |
Companies |
The major players are, The Chemours Company (US), Tronox Holding PLC (US), Lomon Billions Group (China), Venator Materials PLC (UK), Kronos Worldwide Inc (US), INEOS (UK), CINKARNA Celje d.d. (Slovenia), Evonik Industries AG (Germany), TAYCA CORPORATION (Japan), ILUKA RESOURCES (Australia), and ISHIHARA SANGYO KAISHA, LTD.(Japan) are covered in the Titanium Dioxide market. |
This research report categorizes the global Titanium Dioxide market on the basis of Grade, Process, Application, and Region.
On the basis of Grade
- Rutile
- Anatase
On the basis of Process
- Chloride
- Sulfate
On the basis of Application
- Paints & Coatings
- Plastics
- Papers
- Inks
- Others
On the basis of Region
- North America
- Europe
- Asia Pacific (APAC)
- Middle East & Africa (MEA)
- South America
The market has been further analyzed for the key countries in each of these regions.
Recent Developments
- In July 2020, Lomon Billions planned to invest USD 2 billion to expand mining operations in Panzhihua City, China, to produce ilmenite.
- In May 2020, Tronox Holdings plc signed an agreement with Eramet S.A (France) to acquire the TiZir Titanium and Iron ("TTI") business for USD 300 million.
- In January 2020, Lomon Billions planned to invest USD 98.5 million in its subsidiary Gansu Guotai Metal Co., Ltd (China). It is a new titanium metal subsidiary that will be involved in mining ilmenite.
- In August 2019, The Chemours Company acquired Southern Ionics Minerals, LLC (SIM) (Florida, US). SIM was involved in the mining and processing of titanium and zirconium mineral sands.
- In May 2019, INEOS Enterprises acquired National Titanium Dioxide Company Limited (Cristal) from Tronox Limited for USD 700 Million.
- In April 2019, Tronox Holdings plc acquired The National Titanium Dioxide Company Limited (Cristal) (Kuwait) for USD 1.67 Billion.
Frequently Asked Questions (FAQ):
How big is the Titanium Dioxide Market?
Titanium Dioxide Market worth $27.9 billion by 2026.
What is the growth rate of Titanium Dioxide Market?
Titanium Dioxide Market grows at a CAGR of 5.9% during the forecast period.
What is the major driver influencing the growth of the Titanium Dioxide market?
The major driver influencing the growth of Titanium Dioxide is the growth in construction sector and lightweight vehicle across the globe.
How is the Titanium Dioxide market segmented by grade?
The Titanium Dioxide market is segmented Rutile and Anatase by grade.
What is the major challenge in the Titanium Dioxide market?
Volatility in cost of titanium dioxide is a major challenge in the Titanium Dioxide market.
How is the Titanium Dioxide market segmented by the process?
By process titanium dioxide is segmented to chloride and sulfate process.
What are the major opportunities in the Titanium Dioxide market?
Increased use of ultrafine particles of titanium dioxide in cosmetics and construction industries is an opportunity for the Titanium Dioxide market.
How is the Titanium Dioxide market segmented by applications?
By Application the market is segmented into paints & coatings, plastics, papers, Inks, and Others.
Which region has the largest market for titanium dioxide?
APAC has the largest market for Titanium Dioxide owing to the increase in demand from India and China.
How market is segment for titanium dioxide by region?
On the basis of region the market is segmented into North America, Europe, APAC, Middle East & Africa and South America
What is titanium dioxide?
Titanium Dioxide (TiO2, titanium (IV) oxide or Titania) is the oxide of the metal titanium, occurs naturally in several kinds of rocks and mineral sands. Titanium is the ninth most common element in the earth’s crust. It is a white solid inorganic substance that is thermally stable, chemically inert, non-flammable, has excellent ultraviolet (UV) resistant qualities, and acts as a UV absorbent.
Who are the major manufacturers of TITANIUM DIOXIDE?
The major manufacturers of titanium dioxide are The Chemours Company (US), Tronox Holding PLC (US), Lomon Billions Group (China), Venator Materials PLC (UK), Kronos Worldwide Inc. (US), INEOS (UK), CINKARNA Celje d.d. (Slovenia), Evonik Industries AG (Germany), TAYCA CORPORATION (Japan), ILUKA RESOURCES (Australia), and ISHIHARA SANGYO KAISHA, LTD. (Japan). .
To speak to our analyst for a discussion on the above findings, click Speak to Analyst
TABLE OF CONTENTS
1 INTRODUCTION (Page No. - 28)
1.1 STUDY OBJECTIVES
1.2 MARKET DEFINITION
TABLE 1 MARKET SEGMENT DEFINITION, BY GRADE
TABLE 2 MARKET SEGMENT DEFINITION, BY PROCESS
TABLE 3 MARKET SEGMENT DEFINITION, BY APPLICATION
1.3 MARKET SCOPE
FIGURE 1 TITANIUM DIOXIDE MARKET SEGMENTATION
1.3.1 INCLUSIONS & EXCLUSIONS
TABLE 4 INCLUSIONS & EXCLUSIONS IN REPORT
1.4 YEARS CONSIDERED
1.5 CURRENCY
1.6 PACKAGE SIZE
1.7 LIMITATIONS
1.8 STAKEHOLDERS
1.9 SUMMARY OF CHANGES
2 RESEARCH METHODOLOGY (Page No. - 34)
2.1 RESEARCH DATA
FIGURE 2 TITANIUM DIOXIDE MARKET: RESEARCH DESIGN
2.1.1 SECONDARY DATA
2.1.1.1 Key data from secondary sources
2.1.2 PRIMARY DATA
2.1.2.1 Key data from primary sources
2.1.2.2 Key industry insights
2.1.2.3 Breakdown of primary interviews
2.2 MARKET SIZE ESTIMATION
2.2.1 SUPPLY-SIDE APPROACH: ASCERTAINING SHARE OF TOP PLAYERS IN GLOBAL MARKET, IN TERMS OF SUPPLY
FIGURE 3 APPROACH 1: BASED ON PRODUCTION CAPACITY & INDUSTRY UTILIZATION RATES, 2020
2.2.2 DEMAND-SIDE APPROACH: BASED ON ASSESSMENT OF REGIONAL DEMAND AND ITS SHARE IN GLOBAL MARKET
FIGURE 4 APPROACH 2: BASED ON 2020 TOTALREGIONAL DEMAND ESTIMATE
2.3 DATA TRIANGULATION
FIGURE 5 TITANIUM DIOXIDE MARKET: DATA TRIANGULATION
2.4 RESEARCH ASSUMPTIONS AND LIMITATIONS
2.4.1 ASSUMPTIONS
2.4.2 LIMITATIONS
2.4.3 GROWTH RATE ASSUMPTIONS
2.5 FORECAST FACTOR IMPACTING GROWTH
FIGURE 6 FORECAST FACTOR IMPACTING GROWTH
3 EXECUTIVE SUMMARY (Page No. - 44)
FIGURE 7 RUTILE-GRADE TITANIUM DIOXIDE HELD LARGEST MARKET SHARE IN 2020
FIGURE 8 SULFATE PROCESS HELD LARGEST SHARE OF TITANIUM DIOXIDE MARKET IN 2020
FIGURE 9 PAINTS AND COATINGS ACCOUNTED FOR LARGEST MARKET SHARE IN 2020
FIGURE 10 APAC TO BE FASTEST-GROWING MARKET FOR TITANIUM DIOXIDE DURING FORECAST PERIOD
4 PREMIUM INSIGHTS (Page No. - 48)
4.1 SIGNIFICANT OPPORTUNITIES IN TITANIUM DIOXIDE MARKET
FIGURE 11 PAINTS & COATINGS AND PLASTIC APPLICATIONS TO OFFER GROWTH OPPORTUNITIES TO MARKET PLAYERS
4.2 TITANIUM DIOXIDE MARKET IN APAC, BY APPLICATION, GRADE, AND COUNTRY, 2020
FIGURE 12 CHINA CAPTURED LARGEST MARKET SHARE IN APAC, IN TERMS OF VOLUME, IN 2020
4.3 TITANIUM DIOXIDE MARKET, BY GRADE
FIGURE 13 RUTILE-GRADE TITANIUM DIOXIDE TO DOMINATE OVERALL MARKET, IN TERMS OF VOLUME, DURING 2021–2026
4.4 TITANIUM DIOXIDE MARKET, BY PROCESS
FIGURE 14 SULFATE PROCESS TO LEAD OVERALL TITANIUM DIOXIDE MARKET, IN TERMS OF VOLUME, FROM 2021 TO 2026
4.5 TITANIUM DIOXIDE MARKET, BY APPLICATION
FIGURE 15 PAINTS & COATINGS TO COMMAND OVERALL TITANIUM DIOXIDE MARKET, IN TERMS OF VOLUME, THROUGHOUT FORECAST PERIOD
4.6 TITANIUM DIOXIDE MARKET, BY COUNTRY
FIGURE 16 INDIA TO WITNESS HIGHEST CAGR IN GLOBAL TITANIUM DIOXIDE MARKET, IN TERMS OF VOLUME, FROM 2021 TO 2026
5 MARKET OVERVIEW (Page No. - 52)
5.1 INTRODUCTION
FIGURE 17 MARKET DYNAMICS: DRIVERS, RESTRAINTS, OPPORTUNITIES, AND CHALLENGES
5.1.1 DRIVERS
5.1.1.1 Thriving construction sector worldwide
FIGURE 18 NEW HOUSES SOLD IN US, 2016–2020
TABLE 5 NET ANNUAL GROWTH RATE OF HOUSEHOLD DISPOSABLE INCOME, BY COUNTRY, 2017–2020
5.1.1.2 Growing demand for do-it-yourself paints and coating solutions amid COVID-19 pandemic
5.1.1.3 Surging demand for lightweight vehicles
5.1.1.4 Booming cosmetics and personal care industry
FIGURE 19 YEAR-OVER-YEAR GROWTH RATE OF GLOBAL COSMETICS INDUSTRY (%), 2011–2020
5.1.2 RESTRAINTS
5.1.2.1 Stringent environmental policies of governments regarding production of titanium dioxide
5.1.3 OPPORTUNITY
5.1.3.1 Increased use of ultrafine particles of titanium dioxide in cosmetics and construction industries
5.1.3.2 Increased use of titanium dioxide as photocatalyst
5.1.4 CHALLENGES
5.1.4.1 Uncertainty about safety of titanium dioxide
5.1.4.2 Volatility in cost of titanium dioxide
5.2 PORTER’S FIVE FORCES ANALYSIS
FIGURE 20 TITANIUM DIOXIDE MARKET: PORTER’S FIVE FORCES ANALYSIS
5.2.1 BARGAINING POWER OF SUPPLIERS
5.2.2 BARGAINING POWER OF BUYERS
5.2.3 INTENSITY OF COMPETITIVE RIVALRY
5.2.4 THREAT OF NEW ENTRANTS
5.2.5 THREAT OF SUBSTITUTES
TABLE 6 TITANIUM DIOXIDE MARKET: PORTER’S FIVE FORCES ANALYSIS
5.3 TITANIUM DIOXIDE ECOSYSTEM
FIGURE 21 TITANIUM DIOXIDE ECOSYSTEM
5.4 VALUE CHAIN ANALYSIS
FIGURE 22 VALUE CHAIN ANALYSIS
5.5 AVERAGE PRICE ANALYSIS
FIGURE 23 WEIGHTED AVERAGE PRICING ANALYSIS (USD/TON) OF TITANIUM DIOXIDE, BY REGION, 2020
5.6 TRADE ANALYSIS
TABLE 7 TITANIUM DIOXIDE EXPORT, BY COUNTRY, 2019–2020 (TONS)
TABLE 8 TITANIUM DIOXIDE IMPORT, BY COUNTRY, 2019–2020, (TONS)
5.7 TECHNOLOGY ANALYSIS
5.7.1 PROCESS TO OBTAIN TITANIUM DIOXIDE
5.7.1.1 Method of manufacturing titanium dioxide using chloride process
FIGURE 24 MANUFACTURING TITANIUM DIOXIDE USING CHLORIDE PROCESS
5.7.1.2 Method of manufacturing titanium dioxide using sulfate process
FIGURE 25 MANUFACTURING TITANIUM DIOXIDE USING SULFATE PROCESS
5.7.2 SURFACE TREATMENT OF TITANIUM DIOXIDE
5.8 TRADE AND REGULATORY LANDSCAPE
5.8.1 REACH – ECHA REGULATION
5.8.2 CODE OF FEDERAL REGULATION (CFR)
5.8.3 REGULATION PERTAINING TO USE OF TITANIUM DIOXIDE IN SUNSCREENS
5.9 PATENT ANALYSIS
5.9.1 INTRODUCTION
5.9.2 METHODOLOGY
5.9.3 DOCUMENT TYPE
FIGURE 26 NUMBER OF PATENTS FILED IN LAST 10 YEARS
5.9.4 PUBLICATION TRENDS
FIGURE 27 YEAR-WISE DATA OF NUMBER OF PATENTS PUBLISHED, 2010–2020
5.9.5 INSIGHT
5.9.6 JURISDICTION ANALYSIS (2010–2020)
FIGURE 28 PATENT ANALYSIS FOR TOP 10 JURISDICTIONS
5.9.7 TOP COMPANIES/APPLICANTS OF PATENTS
FIGURE 29 TOP 10 COMPANIES/APPLICANTS WITH HIGHEST NUMBER OF PATENTS, 2010–2020
TABLE 9 LIST OF PATENTS BY KRONOS INTERNATIONAL INC., 2017–2019
TABLE 10 LIST OF PATENTS BY TRONOX LLC., 2016–202
TABLE 11 LIST OF PATENTS BY DUPONT
TABLE 12 LIST OF PATENTS BY CRISTAL USA INC.
TABLE 13 TOP 10 PATENT OWNERS (US) IN LAST 10 YEARS
5.10 CASE STUDY
5.10.1 UTILIZATION OF INNOVATIVE NANO TITANIUM PIGMENTS IN COSMETICS INDUSTRY
5.10.2 USE OF TITANIUM DIOXIDE AS PHOTOCATALYST TO PREVENT AIR POLLUTION
5.11 TRENDS/DISRUPTIONS IMPACTING CUSTOMERS’ BUSINESSES
FIGURE 30 ENERGY EFFICIENCY IN BUILDING & CONSTRUCTION TO ENHANCE FUTURE REVENUE MIX
TABLE 14 SHIFT IMPACTING YC AND YCC
5.12 RANGE SCENARIO OF TITANIUM DIOXIDE MARKET
FIGURE 31 TITANIUM DIOXIDE MARKET, RANGE SCENARIO, 2019–2026
5.13 MACROECONOMIC INDICATOR
TABLE 15 GDP GROWTH PROJECTION WORLDWIDE
TABLE 16 GLOBAL AUTOMOTIVE PRODUCTION, BY COUNTRY
5.14 COVID-19 IMPACT
FIGURE 32 PRE- AND POST-COVID ANALYSIS OF TITANIUM DIOXIDE DEMAND
5.15 ADJACENT AND RELATED MARKETS
5.15.1 INTRODUCTION
5.15.2 LIMITATIONS
5.15.3 PAINTS & COATINGS MARKET
5.15.3.1 Market definition
5.15.3.2 Paints & coatings market, by resin type
TABLE 17 ARCHITECTURAL PAINTS & COATINGS MARKET SIZE, BY RESIN TYPE, 2020–2025 (KILOTON)
TABLE 18 ARCHITECTURAL PAINTS & COATINGS MARKET SIZE, BY RESIN TYPE, 2020–2025 (USD MILLION)
TABLE 19 INDUSTRIAL PAINTS & COATINGS MARKET SIZE, BY RESIN TYPE, 2020–2025 (KILOTON)
TABLE 20 INDUSTRIAL PAINTS & COATINGS MARKET SIZE, BY RESIN TYPE, 2020–2025 (USD MILLION)
5.15.3.3 PAINTS & COATINGS MARKET, BY TECHNOLOGY
TABLE 21 ARCHITECTURAL PAINTS & COATINGS MARKET SIZE, BY TECHNOLOGY, 2020–2025 (KILOTON)
TABLE 22 ARCHITECTURAL PAINTS & COATINGS MARKET SIZE, BY TECHNOLOGY, 2020–2025 (USD MILLION)
TABLE 23 INDUSTRIAL PAINTS & COATINGS MARKET SIZE, BY TECHNOLOGY, 2020–2025 (KILOTON)
TABLE 24 INDUSTRIAL PAINTS & COATINGS MARKET SIZE, BY TECHNOLOGY, 2020–2025 (USD MILLION)
5.15.3.4 PAINTS & COATINGS MARKET, BY END-USE INDUSTRY
TABLE 25 ARCHITECTURAL PAINTS & COATINGS MARKET SIZE, BY END-USE INDUSTRY, 2020–2025 (KILOTON)
TABLE 26 ARCHITECTURAL PAINTS & COATINGS MARKET SIZE, BY END-USE INDUSTRY, 2020–2025 (USD MILLION)
TABLE 27 INDUSTRIAL PAINTS & COATINGS MARKET SIZE, BY END-USE INDUSTRY, 2020–2025 (KILOTON)
TABLE 28 INDUSTRIAL PAINTS & COATINGS MARKET SIZE, BY END-USE INDUSTRY, 2020–2025 (USD MILLION)
5.15.3.5 Paints & coatings market, by region
TABLE 29 PAINTS & COATINGS MARKET SIZE, BY REGION, 2020–2025 (KILOTON)
TABLE 30 PAINTS & COATINGS MARKET SIZE, BY REGION, 2020–2025 (USD MILLION)
5.15.4 ANTIMICROBIAL COATINGS MARKET
5.15.4.1 Market definition
5.15.4.2 Antimicrobial coatings market, by type
TABLE 31 ANTIMICROBIAL COATINGS MARKET SIZE, BY TYPE, 2018–2025 (TON)
TABLE 32 ANTIMICROBIAL COATINGS MARKET SIZE, BY TYPE, 2018–2025 (USD MILLION)
5.15.4.3 Antimicrobial coatings market, by application
TABLE 33 ANTIMICROBIAL COATINGS MARKET SIZE, BY APPLICATION, 2018–2025 (TON)
TABLE 34 ANTIMICROBIAL COATINGS MARKET SIZE, BY APPLICATION, 2018–2025 (USD MILLION)
5.15.4.4 Antimicrobial coatings market, by region
TABLE 35 ANTIMICROBIAL COATINGS MARKET SIZE, BY REGION, 2018–2025 (TON)
TABLE 36 ANTIMICROBIAL COATINGS MARKET SIZE, BY REGION, 2018–2025 (USD MILLION)
5.15.5 INORGANIC PIGMENTS MARKET
5.15.5.1 Market definition
5.15.5.2 Inorganic pigments market, by pigment type
TABLE 37 INORGANIC PIGMENTS MARKET SIZE, BY PIGMENT TYPE, 2017–2024 (KILOTON)
TABLE 38 INORGANIC PIGMENTS MARKET SIZE, BY PIGMENT TYPE, 2017–2024 (USD MILLION)
5.15.5.3 INORGANIC PIGMENTS MARKET, BY APPLICATION
TABLE 39 INORGANIC PIGMENTS MARKET SIZE, BY APPLICATION, 2017–2024 (KILOTON)
TABLE 40 INORGANIC PIGMENTS MARKET SIZE, BY APPLICATION, 2017–2024 (USD MILLION)
5.15.5.4 INORGANIC PIGMENTS MARKET, BY END-USE INDUSTRY
TABLE 41 INORGANIC PIGMENTS MARKET SIZE, BY END-USE INDUSTRY, 2017–2024 (KILOTON)
TABLE 42 INORGANIC PIGMENTS MARKET SIZE, BY END-USE INDUSTRY, 2017–2024 (USD MILLION)
5.15.5.5 INORGANIC PIGMENTS MARKET, BY REGION
TABLE 43 INORGANIC PIGMENTS MARKET SIZE, BY REGION, 2017–2024 (KILOTON)
TABLE 44 INORGANIC PIGMENTS MARKET SIZE, BY REGION, 2017–2024 (USD MILLION)
6 TITANIUM DIOXIDE MARKET, BY GRADE (Page No. - 101)
6.1 INTRODUCTION
TABLE 45 DIFFERENCE BETWEEN RUTILE AND ANATASE
FIGURE 33 RUTILE SEGMENT ACCOUNTED FOR LARGEST SHARE OF OVERALL TITANIUM DIOXIDE MARKET IN 2020 (IN TERMS OF VOLUME)
TABLE 46 TITANIUM DIOXIDE MARKET, BY GRADE, 2019–2026 (KILOTON)
TABLE 47 TITANIUM DIOXIDE MARKET, BY GRADE, 2019–2026 (USD MILLION)
6.2 RUTILE
6.2.1 GROWING USE OF RUTILE TITANIUM DIOXIDE IN PAINTS AND COATINGS OWING TO IMPROVED ABILITY TO SCATTER LIGHT IN PAINT FILMS
TABLE 48 TITANIUM DIOXIDE MARKET FOR RUTILE, BY REGION, 2019–2026 (KILOTON)
TABLE 49 TITANIUM DIOXIDE MARKET FOR RUTILE, BY REGION, 2019–2026 (USD MILLION)
6.3 ANATASE
6.3.1 INCREASING UTILIZATION OF ANATASE-GRADE TITANIUM DIOXIDE IN PHOTOCATALYTIC APPLICATIONS
TABLE 50 TITANIUM DIOXIDE MARKET FOR ANATASE, BY REGION, 2019–2026 (KILOTON)
TABLE 51 TITANIUM DIOXIDE MARKET FOR ANATASE, BY REGION, 2019–2026 (USD MILLION)
7 TITANIUM DIOXIDE MARKET, BY PROCESS (Page No. - 106)
7.1 INTRODUCTION
TABLE 52 TITANIUM DIOXIDE PRODUCTION CAPACITY OF MAJOR PLAYERS, BY PROCESS TYPE, 2020
FIGURE 34 SULFATE PROCESS ACCOUNTED FOR LARGEST SHARE OF OVERALL MARKET FOR TITANIUM DIOXIDE IN 2020 (IN TERMS OF VOLUME)
TABLE 53 TITANIUM DIOXIDE MARKET, BY PROCESS, 2019–2026 (KILOTON)
7.2 CHLORIDE
7.2.1 REQUIREMENT FOR HIGH-PURITY TITANIUM DIOXIDE TO FUEL DEMAND
TABLE 54 TITANIUM DIOXIDE MARKET FOR CHLORIDE PROCESS, BY REGION, 2019–2026 (KILOTON)
7.3 SULFATE
7.3.1 DECLINE IN USE OF SULFATE PROCESS DURING FORECAST PERIOD OWING TO ITS DRAWBACKS
TABLE 55 TITANIUM MARKET IN SULFATE PROCESS, BY REGION, 2019–2026 (KILOTON)
8 TITANIUM DIOXIDE MARKET, BY APPLICATION (Page No. - 110)
8.1 INTRODUCTION
FIGURE 35 PAINTS & COATINGS ACCOUNTED FOR LARGEST SHARE OF OVERALL TITANIUM DIOXIDE MARKET IN 2020 (IN TERMS OF VOLUME)
TABLE 56 TITANIUM DIOXIDE MARKET, BY APPLICATION, 2019–2026 (KILOTON)
TABLE 57 TITANIUM DIOXIDE MARKET, BY APPLICATION, 2019–2026 (USD MILLION)
8.1.1 PAINTS & COATINGS
8.1.1.1 Measurable increase in DIY paint and coating market amid pandemic drives demand for titanium dioxide in paints and coatings applications
TABLE 58 TITANIUM DIOXIDE MARKET FOR PAINTS & COATINGS, BY REGION, 2019–2026 (KILOTON)
TABLE 59 TITANIUM DIOXIDE MARKET FOR PAINTS & COATINGS, BY REGION, 2019–2026 (USD MILLION)
8.1.2 PLASTICS
8.1.2.1 Significant growth in packaging industry to foster demand for titanium dioxide for plastics applications
TABLE 60 TITANIUM DIOXIDE MARKET FOR PLASTICS, BY REGION, 2019–2026 (KILOTON)
TABLE 61 TITANIUM DIOXIDE MARKET FOR PLASTICS, BY REGION, 2019–2026 (USD MILLION)
8.1.3 PAPER
8.1.3.1 Increased demand for decorative papers to fuel titanium dioxide market growth for paper and pulp applications
TABLE 62 TITANIUM DIOXIDE MARKET FOR PAPER, BY REGION, 2019–2026 (KILOTON)
TABLE 63 TITANIUM DIOXIDE MARKET FOR PAPER, BY REGION, 2019–2026 (USD MILLION)
8.1.4 INKS
8.1.4.1 Considerable increase in demand for titanium dioxide from APAC for ink applications to foster market growth
TABLE 64 TITANIUM DIOXIDE MARKET FOR INKS, BY REGION, 2019–2026 (KILOTON)
TABLE 65 TITANIUM DIOXIDE MARKET FOR INKS, BY REGION, 2019–2026 (USD MILLION)
8.1.5 OTHERS
TABLE 66 TITANIUM DIOXIDE MARKET FOR OTHER APPLICATIONS, BY REGION, 2019–2026 (KILOTON)
TABLE 67 TITANIUM DIOXIDE MARKET FOR OTHER APPLICATIONS, BY REGION, 2019–2026 (USD MILLION)
9 TITANIUM DIOXIDE MARKET, BY REGION (Page No. - 119)
9.1 INTRODUCTION
FIGURE 36 REGIONAL SNAPSHOT: ASIA PACIFIC EMERGING AS NEW HOTSPOT
TABLE 68 TITANIUM DIOXIDE MARKET, BY REGION, 2019–2026 (KILOTON)
TABLE 69 TITANIUM DIOXIDE MARKET SIZE, BY REGION, 2019–2026 (USD MILLION)
9.2 NORTH AMERICA
FIGURE 37 TITANIUM DIOXIDE MARKET SNAPSHOT IN NORTH AMERICA: US TO LEAD TITANIUM DIOXIDE MARKET IN NORTH AMERICA
TABLE 70 TITANIUM DIOXIDE MARKET IN NORTH AMERICA, BY COUNTRY, 2019–2026 (KILOTON)
TABLE 71 TITANIUM DIOXIDE MARKET IN NORTH AMERICA, BY COUNTRY, 2019–2026 (USD MILLION)
TABLE 72 TITANIUM DIOXIDE MARKET IN NORTH AMERICA, BY PROCESS, 2019–2026 (KILOTON)
TABLE 73 TITANIUM DIOXIDE MARKET IN NORTH AMERICA, BY GRADE, 2019–2026 (KILOTON)
TABLE 74 TITANIUM DIOXIDE MARKET IN NORTH AMERICA, BY GRADE, 2019–2026 (USD MILLION)
TABLE 75 TITANIUM DIOXIDE MARKET IN NORTH AMERICA, BY APPLICATION, 2019–2026 (KILOTON)
TABLE 76 TITANIUM DIOXIDE MARKET IN NORTH AMERICA, BY APPLICATION, 2019–2026 (USD MILLION)
9.2.1 US
9.2.1.1 Thriving end-user industries such as construction and cosmetics in country to drive demand for titanium dioxide
TABLE 77 TITANIUM DIOXIDE MARKET IN US, BY GRADE, 2019–2026 (KILOTON)
TABLE 78 TITANIUM DIOXIDE MARKET IN US, BY GRADE, 2019–2026 (USD MILLION)
TABLE 79 TITANIUM DIOXIDE MARKET IN US, BY APPLICATION, 2019–2026 (KILOTON)
TABLE 80 TITANIUM DIOXIDE MARKET IN US, BY APPLICATION, 2019–2026 (USD MILLION)
9.2.2 CANADA
9.2.2.1 Increasing investment in construction projects to propel titanium dioxide market growth
FIGURE 38 SHIPMENT-, IMPORT-, AND EXPORT-RELATED STATISTICAL DATA FOR CHEMICALS AND PAINTS, COATINGS, AND ADHESIVES INDUSTRIES, 2015–2019
TABLE 81 TITANIUM DIOXIDE MARKET IN CANADA, BY GRADE, 2019–2026 (KILOTON)
TABLE 82 TITANIUM DIOXIDE MARKET IN CANADA, BY GRADE, 2019–2026 (USD MILLION)
TABLE 83 TITANIUM DIOXIDE MARKET IN CANADA, BY APPLICATION, 2019–2026 (KILOTON)
TABLE 84 TITANIUM DIOXIDE MARKET IN CANADA, BY APPLICATION, 2019–2026 (USD MILLION)
9.2.3 MEXICO
9.2.3.1 Booming construction sector to drive demand for titanium dioxide in Mexico
TABLE 85 TITANIUM DIOXIDE MARKET IN MEXICO, BY GRADE, 2019–2026 (KILOTON)
TABLE 86 TITANIUM DIOXIDE MARKET IN MEXICO, BY GRADE, 2019–2026 (USD MILLION)
TABLE 87 TITANIUM DIOXIDE MARKET IN MEXICO, BY APPLICATION, 2019–2026 (KILOTON)
TABLE 88 TITANIUM DIOXIDE MARKET IN MEXICO, BY APPLICATION, 2019–2026 (USD MILLION)
9.3 EUROPE
TABLE 89 TITANIUM DIOXIDE MARKET IN EUROPE , BY COUNTRY, 2019–2026 (KILOTON)
TABLE 90 TITANIUM DIOXIDE MARKET IN EUROPE , BY COUNTRY, 2019–2026 (USD MILLION)
TABLE 91 TITANIUM DIOXIDE MARKET IN EUROPE , BY PROCESS, 2019–2026 (KILOTON)
TABLE 92 TITANIUM DIOXIDE MARKET IN EUROPE , BY GRADE, 2019–2026 (KILOTON)
TABLE 93 TITANIUM DIOXIDE MARKET IN EUROPE, BY GRADE, 2019–2026 (USD MILLION)
TABLE 94 TITANIUM DIOXIDE MARKET IN EUROPE, BY APPLICATION, 2019–2026 (KILOTON)
TABLE 95 TITANIUM DIOXIDE MARKET IN EUROPE, BY APPLICATION, 2019–2026 (USD MILLION)
9.3.1 GERMANY
9.3.1.1 Favorable economic environment for construction sector to foster market growth
TABLE 96 TITANIUM DIOXIDE MARKET IN GERMANY, BY GRADE, 2019–2026 (KILOTON)
TABLE 97 TITANIUM DIOXIDE MARKET IN GERMANY, BY GRADE, 2019–2026 (USD MILLION)
TABLE 98 TITANIUM DIOXIDE MARKET IN GERMANY, BY APPLICATION, 2019–2026 (KILOTON)
TABLE 99 TITANIUM DIOXIDE MARKET IN GERMANY, BY APPLICATION, 2019–2026 (USD MILLION)
9.3.2 UK
9.3.2.1 Significant increase in decorative coatings to fuel demand for titanium dioxide
FIGURE 39 SALES OF PAINTS & COATINGS AND PRINTING INKS, 2019 (USD MILLION)
TABLE 100 TITANIUM DIOXIDE MARKET IN UK, BY GRADE, 2019–2026 (KILOTON)
TABLE 101 TITANIUM DIOXIDE MARKET IN UK, BY GRADE, 2019–2026 (USD MILLION)
TABLE 102 TITANIUM DIOXIDE MARKET IN UK, BY APPLICATION, 2019–2026 (KILOTON)
TABLE 103 TITANIUM DIOXIDE MARKET IN UK, BY APPLICATION, 2019–2026 (USD MILLION)
9.3.3 FRANCE
9.3.3.1 Strong preference for DIY environment-friendly coatings to spur growth of market for paints and coatings
TABLE 104 TITANIUM DIOXIDE MARKET FRANCE, BY GRADE, 2019–2026 (KILOTON)
TABLE 105 TITANIUM DIOXIDE MARKET FRANCE, BY GRADE, 2019–2026 (USD MILLION)
TABLE 106 TITANIUM DIOXIDE MARKET IN FRANCE, BY APPLICATION, 2019–2026 (KILOTON)
TABLE 107 TITANIUM DIOXIDE MARKET IN FRANCE, BY APPLICATION, 2019–2026 (USD MILLION)
9.3.4 RUSSIA
9.3.4.1 Steady development in construction sector to support titanium dioxide market growth
TABLE 108 TITANIUM DIOXIDE MARKET IN RUSSIA, BY GRADE, 2019–2026 (KILOTON)
TABLE 109 TITANIUM DIOXIDE MARKET IN RUSSIA , BY GRADE, 2019–2026 (USD MILLION)
TABLE 110 TITANIUM DIOXIDE MARKET IN RUSSIA , BY APPLICATION, 2019–2026 (KILOTON)
TABLE 111 TITANIUM DIOXIDE MARKET IN RUSSIA, BY APPLICATION, 2019–2026 (USD MILLION)
9.3.5 ITALY
9.3.5.1 Increased use of titanium dioxide as photocatalyst in construction sector boosts market growth
TABLE 112 TITANIUM DIOXIDE MARKET IN ITALY, BY GRADE, 2019–2026 (KILOTON)
TABLE 113 TITANIUM DIOXIDE MARKET IN ITALY, BY GRADE, 2019–2026 (USD MILLION)
TABLE 114 TITANIUM DIOXIDE MARKET IN ITALY, BY APPLICATION, 2019–2026 (KILOTON)
TABLE 115 TITANIUM DIOXIDE MARKET IN ITALY, BY APPLICATION, 2019–2026 (USD MILLION)
9.3.6 REST OF EUROPE
TABLE 116 TITANIUM DIOXIDE MARKET IN REST OF EUROPE, BY GRADE, 2019–2026 (KILOTON)
TABLE 117 TITANIUM DIOXIDE MARKET IN REST OF EUROPE, BY GRADE, 2019–2026 (USD MILLION)
TABLE 118 TITANIUM DIOXIDE MARKET IN REST OF EUROPE, BY APPLICATION, 2019–2026 (KILOTON)
TABLE 119 TITANIUM DIOXIDE MARKET IN REST OF EUROPE, BY APPLICATION, 2019–2026 (USD MILLION)
9.4 APAC
FIGURE 40 TITANIUM DIOXIDE MARKET SNAPSHOT IN APAC: CHINA & INDIA TO LEAD TITANIUM DIOXIDE MARKET
TABLE 120 TITANIUM DIOXIDE MARKET IN APAC , BY COUNTRY, 2019–2026 (KILOTON)
TABLE 121 TITANIUM DIOXIDE MARKET IN APAC, BY COUNTRY, 2019–2026 (USD MILLION)
TABLE 122 TITANIUM DIOXIDE MARKET IN APAC, BY PROCESS, 2019–2026 (KILOTON)
TABLE 123 TITANIUM DIOXIDE MARKET IN APAC, BY GRADE, 2019–2026 (KILOTON)
TABLE 124 TITANIUM DIOXIDE MARKET IN APAC , BY GRADE, 2019–2026 (USD MILLION)
TABLE 125 TITANIUM DIOXIDE MARKET IN APAC , BY APPLICATION, 2019–2026 (KILOTON)
TABLE 126 TITANIUM DIOXIDE MARKET IN APAC , BY APPLICATION, 2019–2026 (USD MILLION)
9.4.1 CHINA
9.4.1.1 Chloride process preferred for titanium dioxide production in China
TABLE 127 TITANIUM DIOXIDE MARKET IN CHINA, BY GRADE, 2019–2026 (KILOTON)
TABLE 128 TITANIUM DIOXIDE MARKET IN CHINA , BY GRADE, 2019–2026 (USD MILLION)
TABLE 129 TITANIUM DIOXIDE MARKET IN CHINA, BY APPLICATION, 2019–2026 (KILOTON)
TABLE 130 TITANIUM DIOXIDE MARKET IN CHINA , BY APPLICATION, 2019–2026 (USD MILLION)
9.4.2 INDIA
9.4.2.1 Make in India initiative to drive demand for coatings for industrial applications
TABLE 131 TITANIUM DIOXIDE MARKET IN INDIA, BY GRADE, 2019–2026 (KILOTON)
TABLE 132 TITANIUM DIOXIDE MARKET IN INDIA , BY GRADE, 2019–2026 (USD MILLION)
TABLE 133 TITANIUM DIOXIDE MARKET IN INDIA, BY APPLICATION, 2019–2026 (KILOTON)
TABLE 134 TITANIUM DIOXIDE MARKET IN INDIA, BY APPLICATION, 2019–2026 (USD MILLION)
9.4.3 JAPAN
9.4.3.1 Increased demand for titanium dioxide pigments for automotive coating applications to augment market growth
FIGURE 41 PRODUCTION & CONSUMPTION OF PAINTS & INKS, 2016–2020 (TONS)
TABLE 135 TITANIUM DIOXIDE MARKET IN JAPAN, BY GRADE, 2019–2026 (KILOTON)
TABLE 136 TITANIUM DIOXIDE MARKET IN JAPAN , BY GRADE, 2019–2026 (USD MILLION)
TABLE 137 TITANIUM DIOXIDE MARKET IN JAPAN , BY APPLICATION, 2019–2026 (KILOTON)
TABLE 138 TITANIUM DIOXIDE MARKET IN JAPAN, BY APPLICATION, 2019–2026 (USD MILLION)
9.4.4 SOUTH KOREA
9.4.4.1 Government’s deliberate investments into manufacturing segment to drive demand for coatings in industrial applications
TABLE 139 TITANIUM DIOXIDE MARKET IN SOUTH KOREA , BY GRADE, 2019–2026 (KILOTON)
TABLE 140 TITANIUM DIOXIDE MARKET IN SOUTH KOREA, BY GRADE, 2019–2026 (USD MILLION)
TABLE 141 TITANIUM DIOXIDE MARKET IN SOUTH KOREA , BY APPLICATION, 2019–2026 (KILOTON)
TABLE 142 TITANIUM DIOXIDE MARKET IN SOUTH KOREA , BY APPLICATION, 2019–2026 (USD MILLION)
9.4.5 AUSTRALIA
9.4.5.1 High feedstock availability for manufacturing titanium dioxide supports market growth in Australia
TABLE 143 TITANIUM DIOXIDE MARKET IN AUSTRALIA , BY GRADE, 2019–2026 (KILOTON)
TABLE 144 TITANIUM DIOXIDE MARKET IN AUSTRALIA , BY GRADE, 2019–2026 (USD MILLION)
TABLE 145 TITANIUM DIOXIDE MARKET IN AUSTRALIA, BY APPLICATION, 2019–2026 (KILOTON)
TABLE 146 TITANIUM DIOXIDE MARKET IN AUSTRALIA , BY APPLICATION, 2019–2026 (USD MILLION)
9.4.6 REST OF APAC
TABLE 147 TITANIUM DIOXIDE MARKET IN REST OF APAC , BY GRADE, 2019–2026 (KILOTON)
TABLE 148 TITANIUM DIOXIDE MARKET IN REST OF APAC, BY GRADE, 2019–2026 (USD MILLION)
TABLE 149 TITANIUM DIOXIDE MARKET IN REST OF APAC , BY APPLICATION, 2019–2026 (KILOTON)
TABLE 150 TITANIUM DIOXIDE MARKET IN REST OF APAC, BY APPLICATION, 2019–2026 (USD MILLION)
9.5 MIDDLE EAST AND AFRICA (MEA)
TABLE 151 TITANIUM DIOXIDE MARKET IN MIDDLE EAST & AFRICA, BY COUNTRY, 2019–2026 (KILOTON)
TABLE 152 TITANIUM DIOXIDE MARKET IN MIDDLE EAST & AFRICA, BY COUNTRY, 2019–2026 (USD MILLION)
TABLE 153 TITANIUM DIOXIDE MARKET IN MIDDLE EAST & AFRICA, BY PROCESS, 2019–2026 (KILOTON)
TABLE 154 TITANIUM DIOXIDE MARKET IN MIDDLE EAST & AFRICA, BY GRADE, 2019–2026 (KILOTON)
TABLE 155 TITANIUM DIOXIDE MARKET IN MIDDLE EAST & AFRICA, BY GRADE, 2019–2026 (USD MILLION)
TABLE 156 TITANIUM DIOXIDE MARKET IN MIDDLE EAST & AFRICA, BY APPLICATION, 2019–2026 (KILOTON)
TABLE 157 TITANIUM DIOXIDE MARKET IN MIDDLE EAST & AFRICA, BY APPLICATION, 2019–2026 (USD MILLION)
9.5.1 SAUDI ARABIA
9.5.1.1 Vision 2030 and other infrastructure development projects of Saudi Arabian government that boost growth of construction industry will lead to spike in demand for titanium dioxide
FIGURE 42 VARIATION IN PRODUCTION OUTPUT IN SAUDI ARABIA FOR FIRST HALF OF 2020 VS. FIRST HALF OF 2019, BY INDUSTRY (%)
TABLE 158 TITANIUM DIOXIDE MARKET IN SAUDI ARABIA, BY GRADE, 2019–2026 (KILOTON)
TABLE 159 TITANIUM DIOXIDE MARKET IN SAUDI ARABIA, BY GRADE, 2019–2026 (USD MILLION)
TABLE 160 TITANIUM DIOXIDE MARKET IN SAUDI ARABIA, BY APPLICATION, 2019–2026 (KILOTON)
TABLE 161 TITANIUM DIOXIDE MARKET IN SAUDI ARABIA, BY APPLICATION, 2019–2026 (USD MILLION)
9.5.2 UAE
9.5.2.1 Country’s focus on development projects to spur demand for titanium dioxide
TABLE 162 TITANIUM DIOXIDE MARKET IN UAE, BY GRADE, 2019–2026 (KILOTON)
TABLE 163 TITANIUM DIOXIDE MARKET IN UAE, BY GRADE, 2019–2026 (USD MILLION)
TABLE 164 TITANIUM DIOXIDE MARKET IN UAE, BY APPLICATION, 2019–2026 (KILOTON)
TABLE 165 TITANIUM DIOXIDE MARKET IN UAE , BY APPLICATION, 2019–2026 (USD MILLION)
9.5.3 SOUTH AFRICA
9.5.3.1 High titanium content feedstocks in region to propel market growth
TABLE 166 TITANIUM DIOXIDE MARKET IN SOUTH AFRICA, BY GRADE, 2019–2026 (KILOTON)
TABLE 167 TITANIUM DIOXIDE MARKET IN SOUTH AFRICA, BY GRADE, 2019–2026 (USD MILLION)
TABLE 168 TITANIUM DIOXIDE MARKET IN SOUTH AFRICA, BY APPLICATION, 2019–2026 (KILOTON)
TABLE 169 TITANIUM DIOXIDE MARKET IN SOUTH AFRICA, BY APPLICATION, 2019–2026 (USD MILLION)
9.5.4 REST OF MIDDLE EAST & AFRICA
TABLE 170 TITANIUM DIOXIDE MARKET IN REST OF MIDDLE EAST & AFRICA, BY GRADE, 2019–2026 (KILOTON)
TABLE 171 TITANIUM DIOXIDE MARKET IN REST OF MIDDLE EAST & AFRICA, BY GRADE, 2019–2026 (USD MILLION)
TABLE 172 TITANIUM DIOXIDE MARKET IN REST OF MIDDLE EAST & AFRICA, BY APPLICATION, 2019–2026 (KILOTON)
TABLE 173 TITANIUM DIOXIDE MARKET REST OF MIDDLE EAST & AFRICA, BY APPLICATION, 2019–2026 (USD MILLION)
9.6 SOUTH AMERICA
TABLE 174 TITANIUM DIOXIDE MARKET IN SOUTH AMERICA, BY COUNTRY, 2019–2026 (KILOTON)
TABLE 175 TITANIUM DIOXIDE MARKET IN SOUTH AMERICA, BY COUNTRY, 2019–2026 (USD MILLION)
TABLE 176 TITANIUM DIOXIDE MARKET IN SOUTH AMERICA, BY PROCESS, 2019–2026 (KILOTON)
TABLE 177 TITANIUM DIOXIDE MARKET IN SOUTH AMERICA, BY GRADE, 2019–2026 (KILOTON)
TABLE 178 TITANIUM DIOXIDE MARKET IN SOUTH AMERICA, BY GRADE, 2019–2026 (USD MILLION)
TABLE 179 TITANIUM DIOXIDE MARKET IN SOUTH AMERICA, BY APPLICATION, 2019–2026 (KILOTON)
TABLE 180 TITANIUM DIOXIDE MARKET IN SOUTH AMERICA, BY APPLICATION, 2019–2026 (USD MILLION)
9.6.1 BRAZIL
9.6.1.1 Rapid urbanization in Brazil to promote construction engineering activities
TABLE 181 TITANIUM DIOXIDE MARKET IN BRAZIL, BY GRADE, 2019–2026 (KILOTON)
TABLE 182 TITANIUM DIOXIDE MARKET IN BRAZIL, BY GRADE, 2019–2026 (USD MILLION)
TABLE 183 TITANIUM DIOXIDE MARKET IN BRAZIL, BY APPLICATION, 2019–2026 (KILOTON)
TABLE 184 TITANIUM DIOXIDE MARKET IN BRAZIL, BY APPLICATION, 2019–2026 (USD MILLION)
9.6.2 ARGENTINA
9.6.2.1 Booming construction industry to support titanium dioxide market growth
TABLE 185 TITANIUM DIOXIDE MARKET IN ARGENTINA, BY GRADE, 2019–2026 (KILOTON)
TABLE 186 TITANIUM DIOXIDE MARKET IN ARGENTINA, BY GRADE, 2019–2026 (USD MILLION)
TABLE 187 TITANIUM DIOXIDE MARKET IN ARGENTINA, BY APPLICATION, 2019–2026 (KILOTON)
TABLE 188 TITANIUM DIOXIDE MARKET IN ARGENTINA, BY APPLICATION, 2019–2026 (USD MILLION)
9.6.3 REST OF SOUTH AMERICA
TABLE 189 TITANIUM DIOXIDE MARKET IN REST OF SOUTH AMERICA, BY GRADE, 2019–2026 (KILOTON)
TABLE 190 TITANIUM DIOXIDE MARKET IN REST OF SOUTH AMERICA, BY GRADE, 2019–2026 (USD MILLION)
TABLE 191 TITANIUM DIOXIDE MARKET IN REST OF SOUTH AMERICA, BY APPLICATION, 2019–2026 (KILOTON)
TABLE 192 TITANIUM DIOXIDE MARKET IN REST OF SOUTH AMERICA, BY APPLICATION, 2019–2026 (USD MILLION)
10 COMPETITIVE LANDSCAPE (Page No. - 176)
10.1 INTRODUCTION
FIGURE 43 OVERVIEW OF STRATEGIES ADOPTED BY KEY PLAYERS BETWEEN 2018 AND 2021
10.2 REVENUE ANALYSIS
FIGURE 44 REVENUE ANALYSIS OF TOP 5 COMPANIES FROM 2016 TO 2020
10.3 MARKET SHARE ANALYSIS
FIGURE 45 MARKET SHARE OF KEY PLAYERS, 2020 (BY PRODUCTION CAPACITY)
10.3.1 STRATEGIC POSITIONING OF KEY PLAYERS
10.3.2 COMPANY EVALUATION MATRIX DEFINITION AND TECHNOLOGY
10.3.2.1 Star
10.3.2.2 Emerging leader
10.3.2.3 pervasive
10.3.2.4 Participant
FIGURE 46 COMPANY EVALUATION QUADRANT, 2020
10.3.3 SMALL AND MEDIUM-SIZED ENTERPRISES (SME) EVALUATION MATRIX
10.3.3.1 Progressive companies
10.3.3.2 Responsive companies
10.3.3.3 Dynamic companies
10.3.3.4 Starting blocks
FIGURE 47 START-UPS AND SMALL AND MEDIUM-SIZED ENTERPRISES (SMES) EVALUATION MATRIX, 2020
10.4 RANKING ANALYSIS OF KEY MARKET PLAYERS, 2020
FIGURE 48 RANKING ANALYSIS OF TOP FIVE PLAYERS IN TITANIUM DIOXIDE MARKET, 2020
10.5 COMPETITIVE BENCHMARKING
10.5.1 COMPANY PRODUCT FOOTPRINT
10.5.2 COMPANY APPLICATION FOOTPRINT
10.5.3 COMPANY REGION FOOTPRINT
10.6 COMPETITIVE SCENARIO AND TRENDS
10.6.1 MARKET EVALUATION FRAMEWORK
TABLE 193 MARKET EVALUATION FRAMEWORK (2018–2021)
10.6.2 EXPANSION
TABLE 194 EXPANSION, 2018–2021
10.6.3 AGREEMENT
TABLE 195 AGREEMENT, 2018–2021
10.6.4 DEALS
TABLE 196 DEALS, 2018–2021
11 COMPANY PROFILES (Page No. - 189)
(Business Overview, Products Offered, Recent Developments, SWOT Analysis, MnM View)*
11.1 MAJOR PLAYERS
11.1.1 THE CHEMOURS COMPANY
FIGURE 49 THE CHEMOURS COMPANY: COMPANY SNAPSHOT
11.1.2 TRONOX HOLDINGS PLC
FIGURE 50 TRONOX HOLDINGS PLC: COMPANY SNAPSHOT
11.1.3 LOMON BILLIONS GROUP
FIGURE 51 LOMON BILLIONS GROUP: COMPANY SNAPSHOT
11.1.4 VENATOR MATERIALS PLC
FIGURE 52 VENATOR MATERIALS PLC: COMPANY SNAPSHOT
11.1.5 KRONOS WORLDWIDE, INC.
FIGURE 53 KRONOS WORLDWIDE INC.: COMPANY SNAPSHOT
11.1.6 INEOS GROUP LTD
FIGURE 54 INEOS GROUP LTD: COMPANY SNAPSHOT
11.1.7 CINKARNA CELJE DD.
FIGURE 55 CINKARNA CELJE DD: COMPANY SNAPSHOT
11.1.8 EVONIK INDUSTRIES AG
FIGURE 56 EVONIK INDUSTRIES AG: COMPANY SNAPSHOT
11.1.9 TAYCA CORPORATION
FIGURE 57 TAYCA CORPORATION: COMPANY SNAPSHOT
11.1.10 ILUKA RESOURCES
FIGURE 58 ILUKA RESOURCES: COMPANY SNAPSHOT
11.2 OTHER PLAYERS
11.2.1 ISHIHARA SANGYO KAISHA, LTD.
FIGURE 59 ISHIHARA SANGYO KAISHA, LTD.: COMPANY SNAPSHOT
11.2.2 SHANGHAI JIUTA CHEMICAL CO. LTD.
11.2.3 GRUPA AZOTY SA.
FIGURE 60 GRUPA AZOTY SA: COMPANY SNAPSHOT
11.2.4 SWASTIK INTERCHEM PRIVATE LIMITED
11.2.5 KISH COMPANY, INC
11.2.6 PRECHEZA A. S.
11.2.7 CNNC HUA YUAN TITANIUM DIOXIDE CO., LTD
11.2.8 TRAVANCORE TITANIUM PRODUCTS LTD.
11.2.9 SHANDONG JINHAI TITANIUM RESOURCES TECHNOLOGY CO., LTD.
11.2.10 GUANGDONG HUI YUN TITANIUM INDUSTRY CORPORATION LIMITED
11.2.11 GPRO TITANIUM INDUSTRY CO., LTD.
11.2.12 TITANOS GROUP
*Details on Business Overview, Products Offered, Recent Developments, SWOT Analysis, MnM View might not be captured in case of unlisted companies.
12 APPENDIX (Page No. - 234)
12.1 DISCUSSION GUIDE
12.2 KNOWLEDGE STORE: MARKETSANDMARKETS SUBSCRIPTION PORTAL
12.3 AVAILABLE CUSTOMIZATIONS
12.4 RELATED REPORTS
12.5 AUTHOR DETAILS
This research involves the use of extensive secondary sources and databases, such as Factiva and Bloomberg, to identify and collect information useful for a technical and market-oriented study of the titanium dioxide market. Primary sources include industry experts from related industries and preferred suppliers, manufacturers, distributors, technologists, standards & certification organizations, and organizations related to all segments of the value chain of this industry. In-depth interviews have been conducted with various primary respondents, such as key industry participants, subject matter experts (SMEs), executives of key companies, and industry consultants to obtain and verify critical qualitative and quantitative information as well as to assess growth prospects.
Titanium Dioxide Market Secondary Research
In the secondary research process, various sources such as annual reports, press releases, and investor presentations of companies; white papers; and publications from recognized websites and databases have been referred to for identifying and collecting information. Secondary research has been used to obtain key information about the industry's supply chain, the total pool of key players, market classification and segmentation according to the industry trends to the bottom-most level, regional markets, and key developments from both market and technology-oriented perspectives.
Titanium Dioxide Market Primary Research
The titanium dioxide market comprises several stakeholders in the supply chain, which include distributors, titanium dioxide manufacturers, carriers, and end users. Various primary sources from the supply and demand sides of the markets have been interviewed to obtain qualitative and quantitative information. The primary participants from the demand side include key opinion leaders, executives, vice presidents, and CEOs of companies in the titanium dioxide market. Primary sources from the supply side include associations and institutions involved in the titanium dioxide industry, key opinion leaders, and processing players in the titanium dioxide market.
Following is the breakdown of primary respondents—
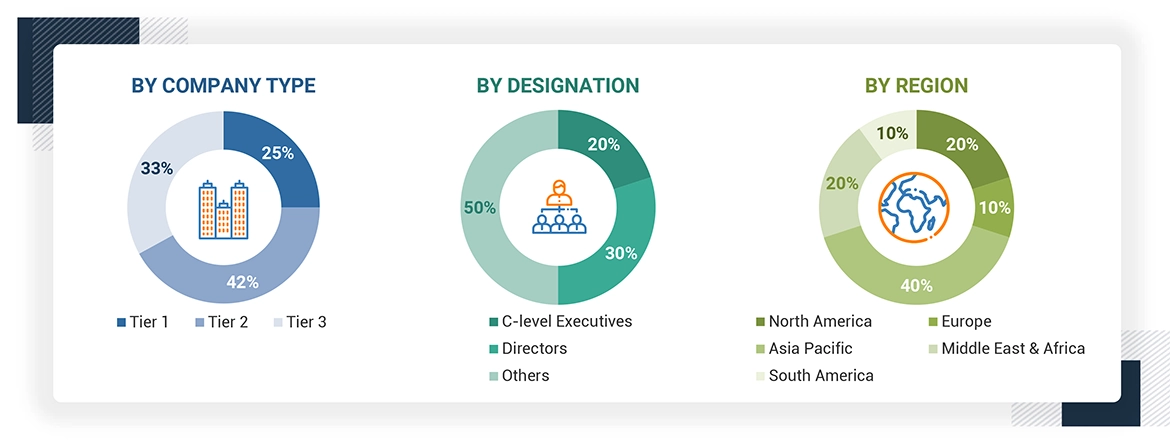
To know about the assumptions considered for the study, download the pdf brochure
Market Size Estimation
Both top-down and bottom-up approaches were used to estimate and validate the size of the global Titanium Dioxide market. The research methodology used to estimate the market size includes the following:
- The key players in the industry were identified through extensive secondary research.
- The supply chain of the industry and market size, in terms of value, were determined through primary and secondary research.
- All percentage shares split, and breakdowns were determined using secondary sources and verified through primary sources.
- All possible parameters that affect the markets covered in this research study were accounted for, viewed in extensive detail, verified through primary research, and analyzed to obtain the final quantitative and qualitative data.
- The research includes the study of annual reports, reviews, titanium dioxide associations, and newsletters of key industry players along with extensive interviews with key officials, such as directors and marketing executives.
Supply-Side Approach: Ascertaining share of top players in global market, in terms of supply
The titanium dioxide market is consolidated, and the top five players accounted for more than half of the global supply. In this approach, the information pertaining to the production capacities and plant utilization rates has been gathered for each leading player involved in the market.
- The production capacity of the key players such as Chemours, Tronox, and Lomon Billions was around 1.25, 1.07, and 1.01 million tons, respectively, in 2020.
- The average utilization rate for the titanium dioxide plant in 2020 was ~ 82% according to the titanium dioxide association.
- Based on that, the overall production of titanium dioxide has been estimated. Further, the insights pertaining to net trade have been collected from industry experts and the public domain. Then, balancing the production and net trade data, the global consumption of titanium dioxide has been calculated for the estimated year.
To know about the assumptions considered for the study, Request for Free Sample Report
Titanium Dioxide Market Data Triangulation
After arriving at the total market size from the estimation process explained above, the overall market was split into several segments and subsegments. To complete the overall market size estimation process and arrive at the exact statistics for all segments and subsegments, the data triangulation and market breakdown procedures have been employed, wherever applicable. The data have been triangulated by studying various factors and trends from both the demand and supply sides. In addition, the market size has been validated by using both the top-down and bottom-up approaches.
Titanium Dioxide Market Report Objectives
- To define, describe, and forecast the global titanium dioxide market in terms of value & volume
- To provide insights regarding significant factors influencing the growth of the market (drivers, restraints, opportunities, and challenges)
- To analyze and forecast the market based on grade, process and applications
- To analyze the impact of COVID-19 on the market
- To forecast the market size, in terms of volume and value, with respect to five main regions, namely, North America, Europe, APAC, the Middle East & Africa, and South America
- To analyze the opportunities in the market for stakeholders and provide details of the competitive landscape
- To strategically profile key players in the market
- To analyze competitive developments in the market, such as new product launch, capacity expansion, and merger & acquisition
- To strategically profile the leading players and comprehensively analyze their key developments, such as expansions and mergers & acquisitions, in the titanium dioxide market.
Titanium Dioxide Market Report Available Customizations:
Along with the given market data, MarketsandMarkets offers customizations as per the specific needs of the companies. The following customization options are available for the report:
Titanium Dioxide Market Product Analysis
- Product Matrix which gives a detailed comparison of the product portfolio of each company
Titanium Dioxide Market Regional Analysis
- Further breakdown of the Rest of APAC titanium dioxide market
- Further breakdown of Rest of Europe titanium dioxide market
Titanium Dioxide Market Company Information
- Detailed analysis and profiling of additional market players (up to 5)
Growth opportunities and latent adjacency in Titanium Dioxide Market