Organic Pigments Market

Report Code CH 1530
Published in Apr, 2024, By MarketsandMarkets™
Download PDF

Choose License Type

Buy Report Now Inquire Before Buying

Organic Pigments Market by Source (Synthetic and Natural), Type (Azo, Phthalocyanine, High-Performance Pigments(HPPs)), Application (Printing inks, Paints & Coatings, Plastics), and Region - Global Forecast to 2029

Overview

The organic pigments market is projected to grow from USD 4.4 billion in 2024 to USD 6.0 billion by 2029, at a CAGR of 6.5%. The global organic pigments market was down by around 16.7% from 2022 due to the weak demand in the Western Market. The Western market was challenged by the rise in inflation, volatility in commodity prices, and disruption in the supply chain, resulting in recessionary trends and thereby hampering the demand for organic pigments. However, It is expected to witness moderate growth during the forecast period, owing to the increasing demand for paints & coatings, printing inks, and plastics applications. Most of the demand is for high-performance pigments (HPPs). The major applications of organic pigments are printing inks, paints & coatings, plastics and other applications.

Attractive Opportunities in the Organic Pigments Market

Asia Pacific

The Asia Pacific region’s organic pigments market presents attractive opportunities due to the increasing demand for environment friendly products in various end-use sectors.

The market growth is attributed to the increasing demand for environment friendly products from various sectors

Surging demand in developing countries, like, China, India, and other countries in the Asia Pacific region.

Product innovation, investment, and collaboration are the key strategies adopted by companies operating in the organic pigments market.

Increasing adoption of organic pigments in printing inks, paints & coatings, plastics, and many other applications driving the demand for organic pigments in the region.

Global Organic Pigments Market Dynamics

Driver: High demand for enhanced aesthetics in various applications areas

The growing competition in the printing ink sector is pushing companies to offer better shades and vivid colors to printed text. The demand for different printing finishes has risen due to the increasing competition among brands and their need to place their product distinctly. Organic pigments in the form of color concentrates and masterbatches provide a variety of color shades, and customized colors can also be manufactured according to customer requirements. Continuous innovations in the market are expected to be driven by the increasing need for enhanced aesthetics in printing inks for better marketing.

Restraint: Higher cost of organic pigments

Organic pigments are more expensive than inorganic pigments, which is a major restraint for the market. Usually, pigments constitute upwards of 50% of the total cost of the final products. These are limited to paints, inks, and coatings applications. The market is witnessing a normal growth rate; however, the size is smaller than that of the inorganic pigments. Inorganic pigment producers experience economies of scale in their production processes, while organic pigments are produced in small quantities. Hence, the production cost for organic pigments is higher, increasing the final product's price.


Opportunity: Growing demand for color filters

The color filter is a major liquid crystal display component, directly determining the picture quality. The increasing demand for notebooks/PCs, mobiles, and televisions drives the market quickly. The color filters used in these display devices employ colored pigments (organic), UV-curable carrier resins, photoinitiators, organic solvents, and dispersants. Organic pigments are used in these filters for specific primary color (RGB), spectral hue, vividness, and durability. This has drastically reduced the power consumption of display devices, thereby helping grow organic pigments in the display market. The following table analyses the growth in demand for electronics that use LCD/LED displays. This increase in demand for LCD/LEDs is expected to boost the demand for organic pigments in the color filter application.

Challenge: Increasing environmental regulations and lower supply

Asia Pacific is the major hub of raw materials and intermediaries for organic pigments. China and India are the major producers due to the lower raw materials and labor costs. Pigment quality is determined by the manufacturing process and raw materials' quality. With the increasing restrictions in China, India, and other countries worldwide, many producers are forced to refine their products and optimize their manufacturing processes to reduce pollution. These pigments are mainly used in the food, cosmetics, and coating & paints industries. As these end users continuously demand changes in chemistry as per changing regulations, the smaller players lack the competitive edge. Only players with exceptional R&D teams and financial means can survive in the market. The prominent and exceptional players immediately imply the required changes and cope with the recent trends and requirements in the market.

Global Organic Pigments Market Ecosystem Analysis

The ecosystem of the organic pigments market is an interconnected network encompassing various stakeholders, technologies, and application industries. At its core, producing and adopting organic pigments involves a collaborative effort among raw material suppliers, researchers, manufacturers, and end users. As the organic pigments market expands, it integrates with coating, printing ink, plastics, and many other industries, creating a multifaceted ecosystem. The feedback loop between these sectors drives innovation, with end users providing valuable insights for further improvements. Overall, the ecosystem of the organic pigments market thrives on collaboration, innovation, and a shared commitment to harnessing the properties of organic pigments for a wide range of applications.


Based on the source, natural source segment is estimated to be the fastest-growing source during the forecast period in terms of value.

Natural pigments use materials occurring naturally in the environment. These pigments were mostly extracted from various parts of plants to provide different shades. Flowers were the most used parts, along with peels, pulps, and seeds. Natural pigments also used animal by-products, such as blood and microbial products, as raw materials. Nowadays, bio-based chemical compounds such as ethanol are used to manufacture pigments. These pigments are very sensitive and require special care in preserving and storing.

Based on the type, High-performance pigments (HPPs) segment is estimated to be the fastest-growing type during the forecast period, in terms of value.

HPPs have excellent lightfastness and heat stability; they are resistant to various chemicals, which makes them suitable for applications requiring high performance. Different types of organic HPPs are benzimidazolones, quinacridone, perylene, dioxazine violet, isoindolinones and isoindolines, disazo condensations, phthalocyanines, and diketo-pyrrolo-pyrroles. Due to their superior properties, HPPs are widely accepted in the printing ink, coatings, and paints industries.

Europe region holds the largest share of the Organic Pigments Market.

Europe is the second-largest organic pigments market globally. The major industries in the region include automotive, building & construction, and packaging. These industries consume plastics in large volumes, which is increasing the consumption of organic pigments. The demand for organic pigments is high in the paints & coatings application in the building & construction and automotive industries. Germany is the key organic pigments market in Europe, which has a high growth potential due to the increasing use of these pigments in the automotive industry for paints & coatings applications.


Recent Developments of Organic Pigments Market industry

  • In December 2022, Sudarshan Chemical Industries Limited introduced two pigments under their organic pigments portfolio. These products have applications in plastics and coating applications. In January 2022, Heubach completed the acquisition of Clariant’s global pigment business. This acquisition allows the company to expand and improve its pigments business and more future growth opportunities.
  • In July 2022, DIC Corporation announced a second-phase agreement with Debut Biotechnology, Inc. to create natural red pigments for nutrition, food, and cosmetic applications.

Key Market Players

Want to explore hidden markets that can drive new revenue in Organic Pigments Market?

Scope of the Report

Report Attribute Details
Market size available for years 2020–2029
Base year considered 2023
Forecast period 2024–2029
Units considered Value (USD Million), Volume (Kiloton)
Segments Covered Source, Type, Application and Region
Geographies covered Europe, North America, Asia Pacific, South America, Middle East, and Africa
Companies covered DIC Corporation (Japan), Heubach GmbH (Germany), and Dainichiseika Color & Chemicals Mfg. Co., Ltd. (Japan), Lily Group Co. Ltd. (China), Sunlour Pigment Co., Ltd. (China), Anshan Hifichem Co., Ltd. (China), Longkou Union Chemical Co., Ltd. (China), Meghmani Organics Ltd. (India), Asahi Songwon Colors Ltd. (India), and Sudarshan Chemical Industries Limited (India).


Key Questions Addressed by the Report

Which are the major companies in the Organic Pigments market? What are their major strategies to strengthen their market presence?
Some of the key players in the Organic Pigments market are DIC Corporation (Japan), Heubach GmbH (Germany), Dainichiseika Color & Chemicals Mfg. Co., Ltd. (Japan), Lily Group Co. Ltd. (China), Sunlour Pigment Co., Ltd. (China), Anshan Hifichem Co., Ltd. (China), Longkou Union Chemical Co., Ltd. (China), Meghmani Organics Ltd. (India), Asahi Songwon Colors Ltd. (India), and Sudarshan Chemical Industries Limited (India).
What are the drivers and opportunities for the Organic Pigments market?
Growing demand from printing inks applications is one of the major drivers of the organic pigments market and one of the major opportunities lies in rising demand for HPPs (High Performance Pigments).
Which region is expected to hold the highest market share?
Asia Pacific, and Europe’s organic pigments market have been experiencing growth and significant industry demand.
What is the total CAGR expected to be recorded for the Organic Pigments market during 2024-2029?
The CAGR is expected to be 6.5% from 2024-2029.
How is the Organic Pigments market aligned?
The market is growing at a significant pace. It is a potential market, and many manufacturers are planning business strategies to expand their existing business.


Personalize This Research

  • Triangulate with your Own Data
  • Get Data as per your Format and Definition
  • Gain a Deeper Dive on a Specific Application, Geography, Customer or Competitor
  • Any level of Personalization
Request A Free Customisation

Let Us Help You

  • What are the Known and Unknown Adjacencies Impacting the Organic Pigments Market
  • What will your New Revenue Sources be?
  • Who will be your Top Customer; what will make them switch?
  • Defend your Market Share or Win Competitors
  • Get a Scorecard for Target Partners
Customized Workshop Request

Table of Contents

Exclusive indicates content/data unique to MarketsandMarkets and not available with any competitors.

TITLE
PAGE NO
INTRODUCTION
24
RESEARCH METHODOLOGY
29
EXECUTIVE SUMMARY
39
PREMIUM INSIGHTS
42
MARKET OVERVIEW
45
  • 5.1 INTRODUCTIONS
  • 5.2 MARKET DYNAMICS
    DRIVERS
    - Superior properties than inorganic pigments
    - High demand for enhanced aesthetics
    - Increasing restraints on food packaging applications
    RESTRAINTS
    - Increasing restrictions on raw materials
    - Higher cost of organic pigments
    OPPORTUNITIES
    - Growing demand from color filters
    - Rising demand for HPPs
    CHALLENGES
    - Low supply
  • 5.3 PORTER'S FIVE FORCES ANALYSIS
    THREAT OF NEW ENTRANTS
    THREAT OF SUBSTITUTES
    BARGAINING POWER OF BUYERS
    BARGAINING POWER OF SUPPLIERS
    INTENSITY OF COMPETITIVE RIVALRY
  • 5.4 ECOSYSTEM MAP
  • 5.5 PRICING ANALYSIS
    AVERAGE SELLING PRICE, BY APPLICATION (KEY PLAYERS)
    AVERAGE SELLING PRICE, BY TYPE
    AVERAGE SELLING PRICE, BY SOURCE
    AVERAGE SELLING PRICE, BY REGION
  • 5.6 VALUE CHAIN ANALYSIS
  • 5.7 TRADE ANALYSIS
    EXPORT SCENARIO FOR HS CODE 320417
    IMPORT SCENARIO FOR HS CODE 320417
  • 5.8 TECHNOLOGY ANALYSIS
  • 5.9 KEY STAKEHOLDERS AND BUYING CRITERIA
    KEY STAKEHOLDERS IN BUYING PROCESS
    BUYING CRITERIA
  • 5.10 PATENT ANALYSIS
    INTRODUCTION
    METHODOLOGY
    DOCUMENT TYPE
    INSIGHTS
    LEGAL STATUS OF PATENTS
    JURISDICTION ANALYSIS
    TOP APPLICANTS' ANALYSIS
    PATENTS BY DAINIPPON INK & CHEMICALS
    PATENTS BY MITSUBISHI CHEM CORP
    - Patents by DIC Corporation
    - top 10 patent owners in last 10 years
  • 5.11 REGULATORY LANDSCAPE
    REGULATORY BODIES, GOVERNMENT AGENCIES, AND OTHER ORGANIZATIONS
    STANDARDS IN ORGANIC PIGMENTS MARKET
  • 5.12 KEY CONFERENCES AND EVENTS, 2024–2025
  • 5.13 CASE STUDY ANALYSIS
    CASE STUDY 1: AGREEMENT STRATEGIES BY DIC CORPORATION TO CATER TO GROWING DEMAND FOR ORGANIC PIGMENTS
    CASE STUDY 2: BUSINESS EXPANSION BY LILY GROUP CO LTD.
  • 5.14 TRENDS AND DISRUPTIONS IMPACTING CUSTOMER BUSINESS
  • 5.15 ORGANIC PIGMENTS INVESTMENT LANDSCAPE
  • 5.16 COMPANY VALUATION
ORGANIC PIGMENTS MARKET, BY APPLICATION
72
  • 6.1 INTRODUCTION
  • 6.2 PRINTING INKS
    WIDE USAGE IN FOOD PACKAGING TO DRIVE DEMAND
  • 6.3 PAINTS & COATINGS
    WIDE USAGE IN DECORATIVE COATINGS TO DRIVE DEMAND
  • 6.4 PLASTICS
    EASE OF PROCESSING TO DRIVE MARKET
  • 6.5 OTHER APPLICATIONS
ORGANIC PIGMENTS MARKET, BY SOURCE
83
  • 7.1 INTRODUCTION
  • 7.2 SYNTHETIC
    DOMINATED MARKET WITH SIGNIFICANT MARKET SHARE
  • 7.3 NATURAL
    EXPECTED TO GROW AT HIGHER CAGR
ORGANIC PIGMENTS MARKET, BY TYPE
90
  • 8.1 INTRODUCTION
  • 8.2 AZO PIGMENTS
    MOST DIVERSE GROUP OF SYNTHETIC ORGANIC PIGMENTS
  • 8.3 PHTHALOCYANINE PIGMENTS
    WIDE USAGE IN PRINTING INKS AND PAINTS & COATINGS APPLICATIONS TO DRIVE MARKET
  • 8.4 HIGH-PERFORMANCE PIGMENTS (HPPS)
    PROJECTED TO GROW AT HIGHEST CAGR
  • 8.5 OTHER TYPES
ORGANIC PIGMENTS MARKET, BY REGION
100
  • 9.1 INTRODUCTION
  • 9.2 NORTH AMERICA
    RECESSION IMPACT
    NORTH AMERICA: ORGANIC PIGMENTS MARKET, BY TYPE
    NORTH AMERICA: ORGANIC PIGMENTS MARKET, BY SOURCE
    NORTH AMERICA: ORGANIC PIGMENTS MARKET, BY APPLICATION
    NORTH AMERICA: ORGANIC PIGMENTS MARKET, BY COUNTRY
    - US
    - Mexico
    - Canada
  • 9.3 EUROPE
    RECESSION IMPACT
    EUROPE: ORGANIC PIGMENTS MARKET, BY TYPE
    EUROPE: ORGANIC PIGMENTS MARKET, BY SOURCE
    EUROPE: ORGANIC PIGMENTS MARKET, BY APPLICATION
    EUROPE: ORGANIC PIGMENTS MARKET, BY COUNTRY
    - Germany
    - France
    - UK
    - Italy
    - Spain
    - Rest of Europe
  • 9.4 ASIA PACIFIC
    RECESSION IMPACT
    ASIA PACIFIC: ORGANIC PIGMENTS MARKET, BY TYPE
    ASIA PACIFIC: ORGANIC PIGMENTS MARKET, BY SOURCE
    ASIA PACIFIC: ORGANIC PIGMENTS MARKET, BY APPLICATION
    ASIA PACIFIC: ORGANIC PIGMENTS MARKET, BY COUNTRY
    - China
    - Japan
    - India
    - South Korea
    - Rest of Asia Pacific
  • 9.5 SOUTH AMERICA
    RECESSION IMPACT
    SOUTH AMERICA: ORGANIC PIGMENTS MARKET, BY TYPE
    SOUTH AMERICA: ORGANIC PIGMENTS MARKET, BY SOURCE
    SOUTH AMERICA: ORGANIC PIGMENTS MARKET, BY APPLICATION
    SOUTH AMERICA: ORGANIC PIGMENTS MARKET, BY COUNTRY
    - Brazil
    - Argentina
    - Rest of South America
  • 9.6 MIDDLE EAST & AFRICA
    RECESSION IMPACT
    MIDDLE EAST & AFRICA: ORGANIC PIGMENTS MARKET, BY TYPE
    MIDDLE EAST & AFRICA: ORGANIC PIGMENTS MARKET, BY SOURCE
    MIDDLE EAST & AFRICA: ORGANIC PIGMENTS MARKET, BY APPLICATION
    MIDDLE EAST & AFRICA: ORGANIC PIGMENTS MARKET, BY COUNTRY
    - Saudi Arabia
    - UAE
    - Rest of Middle East & Africa
COMPETITIVE LANDSCAPE
161
  • 10.1 INTRODUCTION
  • 10.2 KEY PLAYERS’ STRATEGIES/RIGHT TO WIN
    STRATEGIES ADOPTED BY ORGANIC PIGMENT MANUFACTURERS
  • 10.3 REVENUE ANALYSIS
  • 10.4 MARKET SHARE ANALYSIS
  • 10.5 BRAND/PRODUCT COMPARATIVE ANALYSIS
  • 10.6 COMPANY EVALUATION MATRIX
    STARS
    EMERGING LEADERS
    PERVASIVE PLAYERS
    PARTICIPANTS
    COMPANY FOOTPRINT
    - Company region footprint
  • 10.7 START-UPS/SMES EVALUATION MATRIX
    PROGRESSIVE COMPANIES
    RESPONSIVE COMPANIES
    DYNAMIC COMPANIES
    STARTING BLOCKS
    COMPETITIVE BENCHMARKING
  • 10.8 VALUATION AND FINANCIAL METRICS OF ORGANIC PIGMENT MANUFACTURERS
  • 10.9 COMPETITIVE SCENARIO AND TRENDS
    PRODUCT LAUNCHES
    DEALS
    EXPANSIONS
COMPANY PROFILES
175
  • 11.1 KEY COMPANIES
    DIC CORPORATION
    - Business overview
    - Products/Solutions/Services offered
    - Recent developments
    - MnM view
    HEUBACH GMBH
    - Business overview
    - Products/Solutions/Services offered
    - Recent developments
    - MnM view
    DAINICHISEIKA COLOR & CHEMICALS MFG. CO., LTD.
    - Business overview
    - Products/Solutions/Services offered
    - MnM view
    LILY GROUP CO., LTD.
    - Business overview
    - Products/Solutions/Services offered
    - Recent developments
    - MnM view
    SUNLOUR PIGMENT CO., LTD.
    - Business overview
    - Products/Solutions/Services offered
    - MnM view
    MEGHMANI ORGANICS LTD.
    - Business overview
    - Products/Solutions/Services offered
    - MnM view
    ASAHI SONGWON COLORS LTD.
    - Business overview
    - Products/Solutions/Services offered
    - MnM view
    SUDARSHAN CHEMICAL INDUSTRIES LIMITED
    - Business overview
    - Products/Solutions/Services offered
    - Recent developments
    - MnM view
    ATUL LTD.
    - Business overview
    - Products/Solutions/Services offered
    - MnM view
    PIDILITE INDUSTRIES LTD.
    - Business overview
    - Products/Solutions/Services offered
    - MnM view
    ANSHAN HIFICHEM CO., LTD.
    - Business overview
    - Products/Solutions/Services offered
    - MnM view
    LONGKOU UNION CHEMICAL CO., LTD.
    - Business overview
    - Products/Solutions/Services offered
    - MnM view
  • 11.2 OTHER COMPANIES
    VIBRANTZ (FERRO CORPORATION)
    TRUST CHEM CO., LTD.
    TOYOCOLOR CO., LTD.
    CHANGZHOU NORTH AMERICAN CHEMICAL GROUP
    VOXCO PIGMENTS
    SYNTHESIA
    GHARDA CHEMICALS LTD.
    CATHAY INDUSTRIES
    APOLLO COLORS LTD.
    LANXESS
    INDIAN CHEMICAL INDUSTRIES
    HANGZHOU EMPEROR CHEMICAL CO., LTD.
    KOEL COLORS PRIVATE LIMITED
    OGILVY CHEMICAL
APPENDIX
212
  • 12.1 DISCUSSION GUIDE
  • 12.2 KNOWLEDGESTORE: MARKETSANDMARKETS’ SUBSCRIPTION PORTAL
  • 12.3 CUSTOMIZATION OPTIONS
  • 12.4 RELATED REPORTS
  • 12.5 AUTHOR DETAILS
LIST OF TABLES
 
  • TABLE 1 AUTOMOBILE PRODUCTION STATISTICS, BY COUNTRY (2023)
  • TABLE 2 AUTOMOBILE PRODUCTION STATISTICS, BY REGION (2020)
  • TABLE 3 GENERAL PROPERTIES OF ORGANIC AND INORGANIC PIGMENTS
  • TABLE 4 RISK FACTORS RELATED TO INTERMEDIARIES OF ORGANIC PIGMENTS
  • TABLE 5 INCREASE IN GLOBAL DEMAND FOR ELECTRONICS THAT UTILIZE LCD/LED DISPLAYS
  • TABLE 6 ORGANIC PIGMENTS MARKET: PORTER’S FIVE FORCES ANALYSIS
  • TABLE 7 AVERAGE SELLING PRICE OF ORGANIC PIGMENTS, BY REGION
  • TABLE 8 INFLUENCE OF STAKEHOLDERS ON BUYING PROCESS FOR TOP THREE APPLICATIONS
  • TABLE 9 KEY BUYING CRITERIA FOR TOP THREE APPLICATIONS
  • TABLE 10 GLOBAL PATENTS
  • TABLE 11 NORTH AMERICA: REGULATORY BODIES, GOVERNMENT AGENCIES, AND OTHER ORGANIZATIONS
  • TABLE 12 EUROPE: REGULATORY BODIES, GOVERNMENT AGENCIES, AND OTHER ORGANIZATIONS
  • TABLE 13 ASIA PACIFIC: REGULATORY BODIES, GOVERNMENT AGENCIES, AND OTHER ORGANIZATIONS
  • TABLE 14 REST OF THE WORLD: LIST OF REGULATORY BODIES, GOVERNMENT AGENCIES, AND OTHER ORGANIZATIONS
  • TABLE 15 CURRENT STANDARD CODES FOR ORGANIC PIGMENTS
  • TABLE 16 KEY CONFERENCES AND EVENTS, 2024–2025
  • TABLE 17 ORGANIC PIGMENTS MARKET, BY APPLICATION, 2020–2023 (KILOTON)
  • TABLE 18 ORGANIC PIGMENTS MARKET, BY APPLICATION, 2020–2023 (USD MILLION)
  • TABLE 19 ORGANIC PIGMENTS MARKET, BY APPLICATION, 2024–2029 (KILOTON)
  • TABLE 20 ORGANIC PIGMENTS MARKET, BY APPLICATION, 2024–2029 (USD MILLION)
  • TABLE 21 ORGANIC PIGMENTS MARKET IN PRINTING INKS APPLICATION, BY REGION, 2020–2023 (KILOTON)
  • TABLE 22 ORGANIC PIGMENTS MARKET IN PRINTING INKS APPLICATION, BY REGION, 2020–2023 (USD MILLION)
  • TABLE 23 ORGANIC PIGMENTS MARKET IN PRINTING INKS APPLICATION, BY REGION, 2024–2029 (KILOTON)
  • TABLE 24 ORGANIC PIGMENTS MARKET IN PRINTING INKS APPLICATION, BY REGION, 2024–2029 (USD MILLION)
  • TABLE 25 ORGANIC PIGMENTS MARKET IN PAINTS & COATINGS APPLICATION, BY REGION, 2020–2023 (KILOTON)
  • TABLE 26 ORGANIC PIGMENTS MARKET IN PAINTS & COATINGS APPLICATION, BY REGION, 2020–2023 (USD MILLION)
  • TABLE 27 ORGANIC PIGMENTS MARKET IN PAINTS & COATINGS APPLICATION, BY REGION, 2024–2029 (KILOTON)
  • TABLE 28 ORGANIC PIGMENTS MARKET IN PAINTS & COATINGS APPLICATION, BY REGION, 2024–2029 (USD MILLION)
  • TABLE 29 ORGANIC PIGMENTS MARKET IN PLASTICS APPLICATION, BY REGION, 2020–2023 (KILOTON)
  • TABLE 30 ORGANIC PIGMENTS MARKET IN PLASTICS APPLICATION, BY REGION, 2020–2023 (USD MILLION)
  • TABLE 31 ORGANIC PIGMENTS MARKET IN PLASTICS APPLICATION, BY REGION, 2024–2029 (KILOTON)
  • TABLE 32 ORGANIC PIGMENTS MARKET IN PLASTICS APPLICATION, BY REGION, 2024–2029 (USD MILLION)
  • TABLE 33 ORGANIC PIGMENTS MARKET IN OTHER APPLICATIONS, BY REGION, 2020–2023 (KILOTON)
  • TABLE 34 ORGANIC PIGMENTS MARKET IN OTHER APPLICATIONS, BY REGION, 2020–2023 (USD MILLION)
  • TABLE 35 ORGANIC PIGMENTS MARKET IN OTHER APPLICATIONS, BY REGION, 2024–2029 (KILOTON)
  • TABLE 36 ORGANIC PIGMENTS MARKET IN OTHER APPLICATIONS, BY REGION, 2024–2029 (USD MILLION)
  • TABLE 37 ORGANIC PIGMENTS MARKET, BY SOURCE, 2020–2023 (KILOTON)
  • TABLE 38 ORGANIC PIGMENTS MARKET, BY SOURCE, 2020–2023 (USD MILLION)
  • TABLE 39 ORGANIC PIGMENTS MARKET, BY SOURCE, 2024–2029 (KILOTON)
  • TABLE 40 ORGANIC PIGMENTS MARKET, BY SOURCE, 2024–2029 (USD MILLION)
  • TABLE 41 SYNTHETIC: ORGANIC PIGMENTS MARKET, BY REGION, 2020–2023 (KILOTON)
  • TABLE 42 SYNTHETIC: ORGANIC PIGMENTS MARKET, BY REGION, 2020–2023 (USD MILLION)
  • TABLE 43 SYNTHETIC: ORGANIC PIGMENTS MARKET, BY REGION, 2024–2029 (KILOTON)
  • TABLE 44 SYNTHETIC: ORGANIC PIGMENTS MARKET, BY REGION, 2024–2029 (USD MILLION)
  • TABLE 45 NATURAL: ORGANIC PIGMENTS MARKET, BY REGION, 2020–2023 (KILOTON)
  • TABLE 46 NATURAL: ORGANIC PIGMENTS MARKET, BY REGION, 2020–2023 (USD MILLION)
  • TABLE 47 NATURAL: ORGANIC PIGMENTS MARKET, BY REGION, 2024–2029 (KILOTON)
  • TABLE 48 NATURAL: ORGANIC PIGMENTS MARKET, BY REGION, 2024–2029 (USD MILLION)
  • TABLE 49 ORGANIC PIGMENTS MARKET, BY TYPE, 2020–2023 (KILOTON)
  • TABLE 50 ORGANIC PIGMENTS MARKET, BY TYPE, 2020–2023 (USD MILLION)
  • TABLE 51 ORGANIC PIGMENTS MARKET, BY TYPE, 2024–2029 (KILOTON)
  • TABLE 52 ORGANIC PIGMENTS MARKET, BY TYPE, 2024–2029 (USD MILLION)
  • TABLE 53 AZO ORGANIC PIGMENTS MARKET, BY REGION, 2020–2023 (KILOTON)
  • TABLE 54 AZO ORGANIC PIGMENTS MARKET, BY REGION, 2020–2023 (USD MILLION)
  • TABLE 55 AZO ORGANIC PIGMENTS MARKET, BY REGION, 2024–2029 (KILOTON)
  • TABLE 56 AZO ORGANIC PIGMENTS MARKET, BY REGION, 2024–2029 (USD MILLION)
  • TABLE 57 PHTHALOCYANINE ORGANIC PIGMENTS MARKET, BY REGION, 2020–2023 (KILOTON)
  • TABLE 58 PHTHALOCYANINE ORGANIC PIGMENTS MARKET, BY REGION, 2020–2023 (USD MILLION)
  • TABLE 59 PHTHALOCYANINE ORGANIC PIGMENTS MARKET, BY REGION, 2024–2029 (KILOTON)
  • TABLE 60 PHTHALOCYANINE ORGANIC PIGMENTS MARKET, BY REGION, 2024–2029 (USD MILLION)
  • TABLE 61 HPPS: ORGANIC PIGMENTS MARKET, BY REGION, 2020–2023 (KILOTON)
  • TABLE 62 HPPS: ORGANIC PIGMENTS MARKET, BY REGION, 2020–2023 (USD MILLION)
  • TABLE 63 HPPS: ORGANIC PIGMENTS MARKET, BY REGION, 2024–2029 (KILOTON)
  • TABLE 64 HPPS: ORGANIC PIGMENTS MARKET, BY REGION, 2024–2029 (USD MILLION)
  • TABLE 65 OTHER ORGANIC PIGMENTS MARKET, BY REGION, 2020–2023 (KILOTON)
  • TABLE 66 OTHER ORGANIC PIGMENTS MARKET, BY REGION, 2020–2023 (USD MILLION)
  • TABLE 67 OTHER ORGANIC PIGMENTS MARKET, BY REGION, 2024–2029 (KILOTON)
  • TABLE 68 OTHER ORGANIC PIGMENTS MARKET, BY REGION, 2024–2029 (USD MILLION)
  • TABLE 69 ORGANIC PIGMENTS MARKET, BY REGION, 2020–2023 (KILOTON)
  • TABLE 70 ORGANIC PIGMENTS MARKET, BY REGION, 2020–2023 (USD MILLION)
  • TABLE 71 ORGANIC PIGMENTS MARKET, BY REGION, 2024–2029 (KILOTON)
  • TABLE 72 ORGANIC PIGMENTS MARKET, BY REGION, 2024–2029 (USD MILLION)
  • TABLE 73 NORTH AMERICA: ORGANIC PIGMENTS MARKET, BY TYPE, 2020–2023 (KILOTON)
  • TABLE 74 NORTH AMERICA: ORGANIC PIGMENTS MARKET, BY TYPE, 2020–2023 (USD MILLION)
  • TABLE 75 NORTH AMERICA: ORGANIC PIGMENTS MARKET, BY TYPE, 2024–2029 (KILOTON)
  • TABLE 76 NORTH AMERICA: ORGANIC PIGMENTS MARKET, BY TYPE, 2024–2029 (USD MILLION)
  • TABLE 77 NORTH AMERICA: ORGANIC PIGMENTS MARKET, BY SOURCE, 2020–2023 (KILOTON)
  • TABLE 78 NORTH AMERICA: ORGANIC PIGMENTS MARKET, BY SOURCE, 2020–2023 (USD MILLION)
  • TABLE 79 NORTH AMERICA: ORGANIC PIGMENTS MARKET, BY SOURCE, 2024–2029 (KILOTON)
  • TABLE 80 NORTH AMERICA: ORGANIC PIGMENTS MARKET, BY SOURCE, 2024–2029 (USD MILLION)
  • TABLE 81 NORTH AMERICA: ORGANIC PIGMENTS MARKET, BY APPLICATION, 2020–2023 (KILOTON)
  • TABLE 82 NORTH AMERICA: ORGANIC PIGMENTS MARKET, BY APPLICATION, 2020–2023 (USD MILLION)
  • TABLE 83 NORTH AMERICA: ORGANIC PIGMENTS MARKET, BY APPLICATION, 2024–2029 (KILOTON)
  • TABLE 84 NORTH AMERICA: ORGANIC PIGMENTS MARKET, BY APPLICATION, 2024–2029 (USD MILLION)
  • TABLE 85 NORTH AMERICA: ORGANIC PIGMENTS MARKET, BY COUNTRY, 2020–2023 (KILOTON)
  • TABLE 86 NORTH AMERICA: ORGANIC PIGMENTS MARKET, BY COUNTRY, 2020–2023 (USD MILLION)
  • TABLE 87 NORTH AMERICA: ORGANIC PIGMENTS MARKET, BY COUNTRY, 2024–2029 (KILOTON)
  • TABLE 88 NORTH AMERICA: ORGANIC PIGMENTS MARKET, BY COUNTRY, 2024–2029 (USD MILLION)
  • TABLE 89 US: ORGANIC PIGMENTS MARKET, BY APPLICATION, 2020–2023 (KILOTON)
  • TABLE 90 US: ORGANIC PIGMENTS MARKET, BY APPLICATION, 2020–2023 (USD MILLION)
  • TABLE 91 US: ORGANIC PIGMENTS MARKET, BY APPLICATION, 2024–2029 (KILOTON)
  • TABLE 92 US: ORGANIC PIGMENTS MARKET, BY APPLICATION, 2024–2029 (USD MILLION)
  • TABLE 93 MEXICO: ORGANIC PIGMENTS MARKET, BY APPLICATION, 2020–2023 (KILOTON)
  • TABLE 94 MEXICO: ORGANIC PIGMENTS MARKET, BY APPLICATION, 2020–2023 (USD MILLION)
  • TABLE 95 MEXICO: ORGANIC PIGMENTS MARKET, BY APPLICATION, 2024–2029 (KILOTON)
  • TABLE 96 MEXICO: ORGANIC PIGMENTS MARKET, BY APPLICATION, 2024–2029 (USD MILLION)
  • TABLE 97 CANADA: ORGANIC PIGMENTS MARKET, BY APPLICATION, 2020–2023 (KILOTON)
  • TABLE 98 CANADA: ORGANIC PIGMENTS MARKET, BY APPLICATION, 2020–2023 (USD MILLION)
  • TABLE 99 CANADA: ORGANIC PIGMENTS MARKET, BY APPLICATION, 2024–2029 (KILOTON)
  • TABLE 100 CANADA: ORGANIC PIGMENTS MARKET, BY APPLICATION, 2024–2029 (USD MILLION)
  • TABLE 101 EUROPE: ORGANIC PIGMENTS MARKET, BY TYPE, 2020–2023 (KILOTON)
  • TABLE 102 EUROPE: ORGANIC PIGMENTS MARKET, BY TYPE, 2020–2023 (USD MILLION)
  • TABLE 103 EUROPE: ORGANIC PIGMENTS MARKET, BY TYPE, 2024–2029 (KILOTON)
  • TABLE 104 EUROPE: ORGANIC PIGMENTS MARKET, BY TYPE, 2024–2029 (USD MILLION)
  • TABLE 105 EUROPE: ORGANIC PIGMENTS MARKET, BY SOURCE, 2020–2023 (KILOTON)
  • TABLE 106 EUROPE: ORGANIC PIGMENTS MARKET, BY SOURCE, 2020–2023 (USD MILLION)
  • TABLE 107 EUROPE: ORGANIC PIGMENTS MARKET, BY SOURCE, 2024–2029 (KILOTON)
  • TABLE 108 EUROPE: ORGANIC PIGMENTS MARKET, BY SOURCE, 2024–2029 (USD MILLION)
  • TABLE 109 EUROPE: ORGANIC PIGMENTS MARKET, BY APPLICATION, 2020–2023 (KILOTON)
  • TABLE 110 EUROPE: ORGANIC PIGMENTS MARKET, BY APPLICATION, 2020–2023 (USD MILLION)
  • TABLE 111 EUROPE: ORGANIC PIGMENTS MARKET, BY APPLICATION, 2024–2029 (KILOTON)
  • TABLE 112 EUROPE: ORGANIC PIGMENTS MARKET, BY APPLICATION, 2024–2029 (USD MILLION)
  • TABLE 113 EUROPE: ORGANIC PIGMENTS MARKET, BY COUNTRY, 2020–2023 (KILOTON)
  • TABLE 114 EUROPE: ORGANIC PIGMENTS MARKET, BY COUNTRY, 2020–2023 (USD MILLION)
  • TABLE 115 EUROPE: ORGANIC PIGMENTS MARKET, BY COUNTRY, 2024–2029 (KILOTON)
  • TABLE 116 EUROPE: ORGANIC PIGMENTS MARKET, BY COUNTRY, 2024–2029 (USD MILLION)
  • TABLE 117 GERMANY: ORGANIC PIGMENTS MARKET, BY APPLICATION, 2020–2023 (KILOTON)
  • TABLE 118 GERMANY: ORGANIC PIGMENTS MARKET, BY APPLICATION, 2020–2023 (USD MILLION)
  • TABLE 119 GERMANY: ORGANIC PIGMENTS MARKET, BY APPLICATION, 2024–2029 (KILOTON)
  • TABLE 120 GERMANY: ORGANIC PIGMENTS MARKET, BY APPLICATION, 2024–2029 (USD MILLION)
  • TABLE 121 FRANCE: ORGANIC PIGMENTS MARKET, BY APPLICATION, 2020–2023 (KILOTON)
  • TABLE 122 FRANCE: ORGANIC PIGMENTS MARKET, BY APPLICATION, 2020–2023 (USD MILLION)
  • TABLE 123 FRANCE: ORGANIC PIGMENTS MARKET, BY APPLICATION, 2024–2029 (KILOTON)
  • TABLE 124 FRANCE: ORGANIC PIGMENTS MARKET, BY APPLICATION, 2024–2029 (USD MILLION)
  • TABLE 125 UK: ORGANIC PIGMENTS MARKET, BY APPLICATION, 2020–2023 (KILOTON)
  • TABLE 126 UK: ORGANIC PIGMENTS MARKET, BY APPLICATION, 2020–2023 (USD MILLION)
  • TABLE 127 UK: ORGANIC PIGMENTS MARKET, BY APPLICATION, 2024–2029 (KILOTON)
  • TABLE 128 UK: ORGANIC PIGMENTS MARKET, BY APPLICATION, 2024–2029 (USD MILLION)
  • TABLE 129 ITALY: ORGANIC PIGMENTS MARKET, BY APPLICATION, 2020–2023 (KILOTON)
  • TABLE 130 ITALY: ORGANIC PIGMENTS MARKET, BY APPLICATION, 2020–2023 (USD MILLION)
  • TABLE 131 ITALY: ORGANIC PIGMENTS MARKET, BY APPLICATION, 2024–2029 (KILOTON)
  • TABLE 132 ITALY: ORGANIC PIGMENTS MARKET, BY APPLICATION, 2024–2029 (USD MILLION)
  • TABLE 133 SPAIN: ORGANIC PIGMENTS MARKET, BY APPLICATION, 2020–2023 (KILOTON)
  • TABLE 134 SPAIN: ORGANIC PIGMENTS MARKET, BY APPLICATION, 2020–2023 (USD MILLION)
  • TABLE 135 SPAIN: ORGANIC PIGMENTS MARKET, BY APPLICATION, 2024–2029 (KILOTON)
  • TABLE 136 SPAIN: ORGANIC PIGMENTS MARKET, BY APPLICATION, 2024–2029 (USD MILLION)
  • TABLE 137 REST OF EUROPE: ORGANIC PIGMENTS MARKET, BY APPLICATION, 2020–2023 (KILOTON)
  • TABLE 138 REST OF EUROPE: ORGANIC PIGMENTS MARKET, BY APPLICATION, 2020–2023 (USD MILLION)
  • TABLE 139 REST OF EUROPE: ORGANIC PIGMENTS MARKET, BY APPLICATION, 2024–2029 (KILOTON)
  • TABLE 140 REST OF EUROPE: ORGANIC PIGMENTS MARKET, BY APPLICATION, 2024–2029 (USD MILLION)
  • TABLE 141 ASIA PACIFIC: ORGANIC PIGMENTS MARKET, BY TYPE, 2020–2023 (KILOTON)
  • TABLE 142 ASIA PACIFIC: ORGANIC PIGMENTS MARKET, BY TYPE, 2020–2023 (USD MILLION)
  • TABLE 143 ASIA PACIFIC: ORGANIC PIGMENTS MARKET, BY TYPE, 2024–2029 (KILOTON)
  • TABLE 144 ASIA PACIFIC: ORGANIC PIGMENTS MARKET, BY TYPE, 2024–2029 (USD MILLION)
  • TABLE 145 ASIA PACIFIC: ORGANIC PIGMENTS MARKET, BY SOURCE, 2020–2023 (KILOTON)
  • TABLE 146 ASIA PACIFIC: ORGANIC PIGMENTS MARKET, BY SOURCE, 2020–2023 (USD MILLION)
  • TABLE 147 ASIA PACIFIC: ORGANIC PIGMENTS MARKET, BY SOURCE, 2024–2029 (KILOTON)
  • TABLE 148 ASIA PACIFIC: ORGANIC PIGMENTS MARKET, BY SOURCE, 2024–2029 (USD MILLION)
  • TABLE 149 ASIA PACIFIC: ORGANIC PIGMENTS MARKET, BY APPLICATION, 2020–2023 (KILOTON)
  • TABLE 150 ASIA PACIFIC: ORGANIC PIGMENTS MARKET, BY APPLICATION, 2020–2023 (USD MILLION)
  • TABLE 151 ASIA PACIFIC: ORGANIC PIGMENTS MARKET, BY APPLICATION, 2024–2029 (KILOTON)
  • TABLE 152 ASIA PACIFIC: ORGANIC PIGMENTS MARKET, BY APPLICATION, 2024–2029 (USD MILLION)
  • TABLE 153 ASIA PACIFIC: ORGANIC PIGMENTS MARKET, BY COUNTRY, 2020–2023 (KILOTON)
  • TABLE 154 ASIA PACIFIC: ORGANIC PIGMENTS MARKET, BY COUNTRY, 2020–2023 (USD MILLION)
  • TABLE 155 ASIA PACIFIC: ORGANIC PIGMENTS MARKET, BY COUNTRY, 2024–2029 (KILOTON)
  • TABLE 156 ASIA PACIFIC: ORGANIC PIGMENTS MARKET, BY COUNTRY, 2024–2029 (USD MILLION)
  • TABLE 157 CHINA: ORGANIC PIGMENTS MARKET, BY APPLICATION, 2020–2023 (KILOTON)
  • TABLE 158 CHINA: ORGANIC PIGMENTS MARKET, BY APPLICATION, 2020–2023 (USD MILLION)
  • TABLE 159 CHINA: ORGANIC PIGMENTS MARKET, BY APPLICATION, 2024–2029 (KILOTON)
  • TABLE 160 CHINA: ORGANIC PIGMENTS MARKET, BY APPLICATION, 2024–2029 (USD MILLION)
  • TABLE 161 JAPAN: ORGANIC PIGMENTS MARKET, BY APPLICATION, 2020–2023 (KILOTON)
  • TABLE 162 JAPAN: ORGANIC PIGMENTS MARKET, BY APPLICATION, 2020–2023 (USD MILLION)
  • TABLE 163 JAPAN: ORGANIC PIGMENTS MARKET, BY APPLICATION, 2024–2029 (KILOTON)
  • TABLE 164 JAPAN: ORGANIC PIGMENTS MARKET, BY APPLICATION, 2024–2029, (USD MILLION)
  • TABLE 165 INDIA: ORGANIC PIGMENTS MARKET, BY APPLICATION, 2020–2023 (KILOTON)
  • TABLE 166 INDIA: ORGANIC PIGMENTS MARKET, BY APPLICATION, 2020–2023 (USD MILLION)
  • TABLE 167 INDIA: ORGANIC PIGMENTS MARKET, BY APPLICATION, 2024–2029 (KILOTON)
  • TABLE 168 INDIA: ORGANIC PIGMENTS MARKET, BY APPLICATION, 2024–2029 (USD MILLION)
  • TABLE 169 SOUTH KOREA: ORGANIC PIGMENTS MARKET, BY APPLICATION, 2020–2023 (KILOTON)
  • TABLE 170 SOUTH KOREA: ORGANIC PIGMENTS MARKET, BY APPLICATION, 2020–2023 (USD MILLION)
  • TABLE 171 SOUTH KOREA: ORGANIC PIGMENTS MARKET, BY APPLICATION, 2024–2029 (KILOTON)
  • TABLE 172 SOUTH KOREA: ORGANIC PIGMENTS MARKET, BY APPLICATION, 2024–2029 (USD MILLION)
  • TABLE 173 REST OF ASIA PACIFIC: ORGANIC PIGMENTS MARKET, BY APPLICATION, 2020–2023 (KILOTON)
  • TABLE 174 REST OF ASIA PACIFIC: ORGANIC PIGMENTS MARKET, BY APPLICATION, 2020–2023 (USD MILLION)
  • TABLE 175 REST OF ASIA PACIFIC: ORGANIC PIGMENTS MARKET, BY APPLICATION, 2024–2029 (KILOTON)
  • TABLE 176 REST OF ASIA PACIFIC: ORGANIC PIGMENTS MARKET, BY APPLICATION, 2024–2029 (USD MILLION)
  • TABLE 177 SOUTH AMERICA: ORGANIC PIGMENTS MARKET, BY TYPE, 2020–2023 (KILOTON)
  • TABLE 178 SOUTH AMERICA: ORGANIC PIGMENTS MARKET, BY TYPE, 2020–2023 (USD MILLION)
  • TABLE 179 SOUTH AMERICA: ORGANIC PIGMENTS MARKET, BY TYPE, 2024–2029 (KILOTON)
  • TABLE 180 SOUTH AMERICA: ORGANIC PIGMENTS MARKET, BY TYPE, 2024–2029 (USD MILLION)
  • TABLE 181 SOUTH AMERICA: ORGANIC PIGMENTS MARKET, BY SOURCE, 2020–2023 (KILOTON)
  • TABLE 182 SOUTH AMERICA: ORGANIC PIGMENTS MARKET, BY SOURCE, 2020–2023 (USD MILLION)
  • TABLE 183 SOUTH AMERICA: ORGANIC PIGMENTS MARKET, BY SOURCE, 2024–2029 (KILOTON)
  • TABLE 184 SOUTH AMERICA: ORGANIC PIGMENTS MARKET, BY SOURCE, 2024–2029 (USD MILLION)
  • TABLE 185 SOUTH AMERICA: ORGANIC PIGMENTS MARKET, BY APPLICATION, 2020–2023 (KILOTON)
  • TABLE 186 SOUTH AMERICA: ORGANIC PIGMENTS MARKET, BY APPLICATION, 2020–2023 (USD MILLION)
  • TABLE 187 SOUTH AMERICA: ORGANIC PIGMENTS MARKET, BY APPLICATION, 2024–2029 (KILOTON)
  • TABLE 188 SOUTH AMERICA: ORGANIC PIGMENTS MARKET, BY APPLICATION, 2024–2029 (USD MILLION)
  • TABLE 189 SOUTH AMERICA: ORGANIC PIGMENTS MARKET, BY COUNTRY, 2020–2023 (KILOTON)
  • TABLE 190 SOUTH AMERICA: ORGANIC PIGMENTS MARKET, BY COUNTRY, 2020–2023 (USD MILLION)
  • TABLE 191 SOUTH AMERICA: ORGANIC PIGMENTS MARKET, BY COUNTRY, 2024–2029 (KILOTON)
  • TABLE 192 SOUTH AMERICA: ORGANIC PIGMENTS MARKET, BY COUNTRY, 2024–2029 (USD MILLION)
  • TABLE 193 BRAZIL: ORGANIC PIGMENTS MARKET, BY APPLICATION, 2020–2023 (KILOTON)
  • TABLE 194 BRAZIL: ORGANIC PIGMENTS MARKET, BY APPLICATION, 2020–2023 (USD MILLION)
  • TABLE 195 BRAZIL: ORGANIC PIGMENTS MARKET, BY APPLICATION, 2024–2029 (KILOTON)
  • TABLE 196 BRAZIL: ORGANIC PIGMENTS MARKET, BY APPLICATION, 2024–2029 (USD MILLION)
  • TABLE 197 ARGENTINA: ORGANIC PIGMENTS MARKET, BY APPLICATION, 2020–2023 (KILOTON)
  • TABLE 198 ARGENTINA: ORGANIC PIGMENTS MARKET, BY APPLICATION, 2020–2023 (USD MILLION)
  • TABLE 199 ARGENTINA: ORGANIC PIGMENTS MARKET, BY APPLICATION, 2024–2029 (KILOTON)
  • TABLE 200 ARGENTINA: ORGANIC PIGMENTS MARKET, BY APPLICATION, 2024–2029 (USD MILLION)
  • TABLE 201 REST OF SOUTH AMERICA: ORGANIC PIGMENTS MARKET, BY APPLICATION, 2020–2023 (KILOTON)
  • TABLE 202 REST OF SOUTH AMERICA: ORGANIC PIGMENTS MARKET, BY APPLICATION, 2020–2023 (USD MILLION)
  • TABLE 203 REST OF SOUTH AMERICA: ORGANIC PIGMENTS MARKET, BY APPLICATION, 2024–2029 (KILOTON)
  • TABLE 204 REST OF SOUTH AMERICA: ORGANIC PIGMENTS MARKET, BY APPLICATION, 2024–2029 (USD MILLION)
  • TABLE 205 MIDDLE EAST & AFRICA: ORGANIC PIGMENTS MARKET, BY TYPE, 2020–2023 (KILOTON)
  • TABLE 206 MIDDLE EAST & AFRICA: ORGANIC PIGMENTS MARKET, BY TYPE, 2020–2023 (USD MILLION)
  • TABLE 207 MIDDLE EAST & AFRICA: ORGANIC PIGMENTS MARKET, BY TYPE, 2024–2029 (KILOTON)
  • TABLE 208 MIDDLE EAST & AFRICA: ORGANIC PIGMENTS MARKET, BY TYPE, 2024–2029 (USD MILLION)
  • TABLE 209 MIDDLE EAST & AFRICA: ORGANIC PIGMENTS MARKET, BY SOURCE, 2020–2023 (KILOTON)
  • TABLE 210 MIDDLE EAST & AFRICA: ORGANIC PIGMENTS MARKET, BY SOURCE, 2020–2023 (USD MILLION)
  • TABLE 211 MIDDLE EAST & AFRICA: ORGANIC PIGMENTS MARKET, BY SOURCE, 2024–2029 (KILOTON)
  • TABLE 212 MIDDLE EAST & AFRICA: ORGANIC PIGMENTS MARKET, BY SOURCE, 2024–2029 (USD MILLION)
  • TABLE 213 MIDDLE EAST & AFRICA: ORGANIC PIGMENTS MARKET, BY APPLICATION, 2020–2023 (KILOTON)
  • TABLE 214 MIDDLE EAST & AFRICA: ORGANIC PIGMENTS MARKET, BY APPLICATION, 2020–2023 (USD MILLION)
  • TABLE 215 MIDDLE EAST & AFRICA: ORGANIC PIGMENTS MARKET, BY APPLICATION, 2024–2029 (KILOTON)
  • TABLE 216 MIDDLE EAST & AFRICA: ORGANIC PIGMENTS MARKET, BY APPLICATION, 2024–2029 (USD MILLION)
  • TABLE 217 MIDDLE EAST & AFRICA: ORGANIC PIGMENTS MARKET, BY COUNTRY, 2020–2023 (KILOTON)
  • TABLE 218 MIDDLE EAST & AFRICA: ORGANIC PIGMENTS MARKET, BY COUNTRY, 2020–2023 (USD MILLION)
  • TABLE 219 MIDDLE EAST & AFRICA: ORGANIC PIGMENTS MARKET, BY COUNTRY, 2024–2029 (KILOTON)
  • TABLE 220 MIDDLE EAST & AFRICA: ORGANIC PIGMENTS MARKET, BY COUNTRY, 2024–2029 (USD MILLION)
  • TABLE 221 SAUDI ARABIA: ORGANIC PIGMENTS MARKET, BY APPLICATION, 2020–2023 (KILOTON)
  • TABLE 222 SAUDI ARABIA: ORGANIC PIGMENTS MARKET, BY APPLICATION, 2020–2023 (USD MILLION)
  • TABLE 223 SAUDI ARABIA: ORGANIC PIGMENTS MARKET, BY APPLICATION, 2024–2029 (KILOTON)
  • TABLE 224 SAUDI ARABIA: ORGANIC PIGMENTS MARKET, BY APPLICATION, 2024–2029 (USD MILLION)
  • TABLE 225 UAE: ORGANIC PIGMENTS MARKET, BY APPLICATION, 2020–2023 (KILOTON)
  • TABLE 226 UAE: ORGANIC PIGMENTS MARKET, BY APPLICATION, 2020–2023 (USD MILLION)
  • TABLE 227 UAE: ORGANIC PIGMENTS MARKET, BY APPLICATION, 2024–2029 (KILOTON)
  • TABLE 228 UAE: ORGANIC PIGMENTS MARKET, BY APPLICATION, 2024–2029 (USD MILLION)
  • TABLE 229 REST OF MIDDLE EAST & AFRICA: ORGANIC PIGMENTS MARKET, BY APPLICATION, 2020–2023 (KILOTON)
  • TABLE 230 REST OF MIDDLE EAST & AFRICA: ORGANIC PIGMENTS MARKET, BY APPLICATION, 2020–2023 (USD MILLION)
  • TABLE 231 REST OF MIDDLE EAST & AFRICA: ORGANIC PIGMENTS MARKET, BY APPLICATION, 2024–2029 (KILOTON)
  • TABLE 232 REST OF MIDDLE EAST & AFRICA: ORGANIC PIGMENTS MARKET, BY APPLICATION, 2024–2029 (USD MILLION)
  • TABLE 233 DEGREE OF COMPETITION: ORGANIC PIGMENTS MARKET
  • TABLE 234 COMPANY TYPE FOOTPRINT
  • TABLE 235 COMPANY APPLICATION FOOTPRINT
  • TABLE 236 COMPANY REGION FOOTPRINT
  • TABLE 237 ORGANIC PIGMENTS MARKET: KEY START-UPS/SMES
  • TABLE 238 ORGANIC PIGMENTS MARKET: COMPETITIVE BENCHMARKING OF KEY START-UPS/SMES
  • TABLE 239 ORGANIC PIGMENTS MARKET: PRODUCT LAUNCHES, JANUARY 2020–FEBRUARY 2024
  • TABLE 240 ORGANIC PIGMENTS MARKET: DEALS, JANUARY 2020–FEBRUARY 2024
  • TABLE 241 ORGANIC PIGMENTS MARKET: EXPANSIONS, JANUARY 2020–FEBRUARY 2024
  • TABLE 242 DIC CORPORATION: COMPANY OVERVIEW
  • TABLE 243 DIC CORPORATION: PRODUCTS/SOLUTIONS/SERVICES OFFERED
  • TABLE 244 DIC CORPORATION: DEALS, JANUARY 2020- FEBRUARY 2024
  • TABLE 245 HEUBACH GMBH: COMPANY OVERVIEW
  • TABLE 246 HEUBACH GMBH: PRODUCTS/SOLUTIONS/SERVICES OFFERED
  • TABLE 247 HEUBACH GMBH: DEALS, JANUARY 2020- FEBRUARY 2024
  • TABLE 248 DAINICHISEIKA COLOR & CHEMICALS MFG. CO., LTD.: COMPANY OVERVIEW
  • TABLE 249 DAINICHISEIKA COLOR & CHEMICALS MFG. CO., LTD.: PRODUCTS/SOLUTIONS/SERVICES OFFERED
  • TABLE 250 LILY GROUP CO., LTD: COMPANY OVERVIEW
  • TABLE 251 LILY GROUP CO., LTD.: PRODUCTS/SOLUTIONS/SERVICES OFFERED
  • TABLE 252 LILY GROUP CO., LTD.: EXPANSIONS, JANUARY 2020–FEBRUARY 2024
  • TABLE 253 SUNLOUR PIGMENT CO., LTD.: COMPANY OVERVIEW
  • TABLE 254 SUNLOUR PIGMENT CO., LTD.: PRODUCTS/SOLUTIONS/SERVICES OFFERED
  • TABLE 255 MEGHMANI ORGANICS LTD.: COMPANY OVERVIEW
  • TABLE 256 MEGHMANI ORGANIC S LTD.: PRODUCTS/SOLUTIONS/SERVICES OFFERED
  • TABLE 257 ASAHI SONGWON COLORS LTD.: COMPANY OVERVIEW
  • TABLE 258 ASAHI SONGWONG COLORS LTD.: PRODUCTS/SOLUTIONS/SERVICES OFFERED
  • TABLE 259 SUDARSHAN CHEMICAL INDUSTRIES LIMITED: COMPANY OVERVIEW
  • TABLE 260 SUDARSHAN CHEMICAL INDUSTRIES LIMITED: PRODUCTS/SOLUTIONS/ SERVICES OFFERED
  • TABLE 261 SUDARSHAN CHEMICAL INDUSTRIES LIMITED: PRODUCT LAUNCHES, JANUARY 2020–MARCH 2024
  • TABLE 262 ATUL LTD.: COMPANY OVERVIEW
  • TABLE 263 ATUL LTD.: PRODUCTS/SOLUTIONS/SERVICES OFFERED
  • TABLE 264 PIDILITE INDUSTRIES LTD.: COMPANY OVERVIEW
  • TABLE 265 PIDILITE INDUSTRIES LTD.: PRODUCTS/SOLUTIONS/SERVICES OFFERED
  • TABLE 266 ANSHAN HIFICHEM CO., LTD.: COMPANY OVERVIEW
  • TABLE 267 ANSHAN HIFICHEM CO., LTD.: PRODUCTS/SOLUTIONS/SERVICES OFFERED
  • TABLE 268 LONGKOU UNION CHEMICAL CO., LTD.: COMPANY OVERVIEW
  • TABLE 269 LONGKOU UNION CHEMICAL CO., LTD.: PRODUCTS/SOLUTIONS/ SERVICES OFFERED
  • TABLE 270 VIBRANTZ (FERRO CORPORATION): COMPANY OVERVIEW
  • TABLE 271 TRUST CHEM CO., LTD.: COMPANY OVERVIEW
  • TABLE 272 TOYOCOLOR CO., LTD.: COMPANY OVERVIEW
  • TABLE 273 CHANGZHOU NORTH AMERICAN CHEMICAL GROUP: COMPANY OVERVIEW
  • TABLE 274 VOXCO PIGMENTS: COMPANY OVERVIEW
  • TABLE 275 SYNTHESIA: COMPANY OVERVIEW
  • TABLE 276 GHARDA CHEMICALS LTD.: COMPANY OVERVIEW
  • TABLE 277 CATHAY INDUSTRIES: COMPANY OVERVIEW
  • TABLE 278 APOLLO COLORS INC.: COMPANY OVERVIEW
  • TABLE 279 LANXESS: COMPANY OVERVIEW
  • TABLE 280 INDIAN CHEMICAL INDUSTRIES: COMPANY OVERVIEW
  • TABLE 281 HANGZHOU EMPEROR CHEMICAL CO., LTD.: COMPANY OVERVIEW
  • TABLE 282 KOEL COLORS PRIVATE LIMITED: COMPANY OVERVIEW
  • TABLE 283 OGILVY CHEMICAL: COMPANY OVERVIEW
LIST OF FIGURES
 
  • FIGURE 1 ORGANIC PIGMENTS: MARKET SEGMENTATION
  • FIGURE 2 ORGANIC PIGMENTS MARKET: RESEARCH DESIGN
  • FIGURE 3 MARKET SIZE ESTIMATION METHODOLOGY: BOTTOM-UP APPROACH
  • FIGURE 4 MARKET SIZE ESTIMATION METHODOLOGY: TOP-DOWN APPROACH
  • FIGURE 5 METHODOLOGY FOR “SUPPLY-SIDE” SIZING OF ORGANIC PIGMENTS MARKET
  • FIGURE 6 METHODOLOGY FOR “DEMAND-SIDE” SIZING OF ORGANIC PIGMENTS MARKET
  • FIGURE 7 ORGANIC PIGMENTS MARKET: DATA TRIANGULATION
  • FIGURE 8 HPPS TO REGISTER FASTEST GROWTH IN ORGANIC PIGMENTS MARKET DURING FORECAST PERIOD
  • FIGURE 9 SYNTHETIC ORGANIC PIGMENTS DOMINATED MARKET IN 2023
  • FIGURE 10 PAINTS & COATINGS APPLICATION TO LEAD ORGANIC PIGMENTS MARKET DURING 2024–2029
  • FIGURE 11 ASIA PACIFIC LED ORGANIC PIGMENTS MARKET IN 2023
  • FIGURE 12 MODERATE GROWTH EXPECTED IN ORGANIC PIGMENTS MARKET DURING FORECAST PERIOD
  • FIGURE 13 ASIA PACIFIC AND AZO PIGMENTS SEGMENT ACCOUNTED FOR LARGEST SHARES IN 2023
  • FIGURE 14 SYNTHETIC ORGANIC PIGMENTS ACCOUNTED FOR LARGER SHARE IN 2023
  • FIGURE 15 PRINTING INKS TO DOMINATE ORGANIC PIGMENTS MARKET DURING FORECAST PERIOD
  • FIGURE 16 CHINA TO BE FASTEST-GROWING ORGANIC PIGMENTS MARKET DURING FORECAST PERIOD
  • FIGURE 17 DRIVERS, RESTRAINTS, OPPORTUNITIES, AND CHALLENGES IN ORGANIC PIGMENTS MARKET
  • FIGURE 18 ORGANIC PIGMENTS MARKET: PORTER'S FIVE FORCES ANALYSIS
  • FIGURE 19 ECOSYSTEM MAP
  • FIGURE 20 ORGANIC PIGMENTS MARKET: KEY STAKEHOLDERS IN ECOSYSTEM
  • FIGURE 21 AVERAGE SELLING PRICE FOR TOP 3 APPLICATIONS (USD/KG)
  • FIGURE 22 AVERAGE SELLING PRICE BASED ON TYPE (USD/KG)
  • FIGURE 23 AVERAGE SELLING PRICE BASED ON SOURCE (USD/KG)
  • FIGURE 24 VALUE CHAIN ANALYSIS
  • FIGURE 25 EXPORT OF SYNTHETIC ORGANIC PIGMENTS, BY KEY COUNTRY, 2019–2023 (USD THOUSAND)
  • FIGURE 26 IMPORT OF SYNTHETIC ORGANIC PIGMENTS, BY KEY COUNTRY, 2019–2023 (USD THOUSAND)
  • FIGURE 27 INFLUENCE OF STAKEHOLDERS ON BUYING PROCESS FOR TOP THREE APPLICATIONS
  • FIGURE 28 KEY BUYING CRITERIA FOR TOP THREE APPLICATIONS
  • FIGURE 29 GLOBAL PATENT ANALYSIS, BY DOCUMENT TYPE
  • FIGURE 30 GLOBAL PATENT PUBLICATION TREND ANALYSIS: LAST 6 YEARS
  • FIGURE 31 LEGAL STATUS OF PATENTS
  • FIGURE 32 GLOBAL JURISDICTION ANALYSIS
  • FIGURE 33 DAINIPPON INK & CHEMICALS HAS HIGHEST NUMBER OF PATENTS
  • FIGURE 34 REVENUE SHIFT OF ORGANIC PIGMENTS MARKET
  • FIGURE 35 INVESTOR DEALS AND FUNDING IN GLOBAL ORGANIC PIGMENTS MARKET SOARED IN 2023
  • FIGURE 36 MOST VALUED ORGANIC PIGMENTS FIRMS IN 2023 (USD BILLION)
  • FIGURE 37 PAINTS & COATINGS SEGMENT TO LEAD MARKET DURING FORECAST PERIOD
  • FIGURE 38 ASIA PACIFIC TO LEAD ORGANIC PIGMENTS MARKET FOR PAINTS & COATINGS APPLICATION
  • FIGURE 39 SYNTHETIC SEGMENT TO DOMINATE MARKET DURING FORECAST PERIOD
  • FIGURE 40 ASIA PACIFIC TO LEAD ORGANIC PIGMENTS MARKET IN SYNTHETIC SEGMENT
  • FIGURE 41 ASIA PACIFIC TO LEAD ORGANIC PIGMENTS MARKET IN NATURAL SEGMENT
  • FIGURE 42 HPPS TO WITNESS FASTEST GROWTH DURING FORECAST PERIOD
  • FIGURE 43 ASIA PACIFIC TO LEAD AZO ORGANIC PIGMENTS MARKET
  • FIGURE 44 CHINA TO BE FASTEST-GROWING COUNTRY IN ORGANIC PIGMENTS MARKET
  • FIGURE 45 NORTH AMERICA: ORGANIC PIGMENTS MARKET SNAPSHOT
  • FIGURE 46 EUROPE: ORGANIC PIGMENTS MARKET SNAPSHOT
  • FIGURE 47 ASIA PACIFIC: ORGANIC PIGMENTS MARKET SNAPSHOT
  • FIGURE 48 REVENUE ANALYSIS OF MARKET PLAYERS
  • FIGURE 49 SHARES OF TOP COMPANIES IN ORGANIC PIGMENTS MARKET
  • FIGURE 50 ORGANIC PIGMENTS MARKET: TRENDING BRANDS/PRODUCTS
  • FIGURE 51 ORGANIC PIGMENTS MARKET: COMPANY EVALUATION MATRIX, 2023
  • FIGURE 52 COMPANY PRODUCT FOOTPRINT
  • FIGURE 53 ORGANIC PIGMENTS MARKET: START-UPS/SMES EVALUATION MATRIX, 2023
  • FIGURE 54 EV/EBITDA OF KEY MANUFACTURERS
  • FIGURE 55 YEAR-TO-DATE (YTD) PRICE TOTAL RETURN AND 5-YEAR STOCK BETA OF KEY MANUFACTURERS
  • FIGURE 56 DIC CORPORATION: COMPANY SNAPSHOT
  • FIGURE 57 DAINCHISEIKA COLOR & CHEMICALS MFG. CO., LTD.: COMPANY SNAPSHOT
  • FIGURE 58 MEGHMANI ORGANICS LTD.: COMPANY SNAPSHOT
  • FIGURE 59 ASAHI SONGWON COLORS LTD.: COMPANY SNAPSHOT
  • FIGURE 60 SUDARSHAN CHEMICAL INDUSTRIES LTD.: COMPANY SNAPSHOT
  • FIGURE 61 ATUL LTD.: COMPANY SNAPSHOT
  • FIGURE 62 PIDILITE INDUSTRIES LTD.: COMPANY SNAPSHOT

The study involves two major activities in estimating the current market size for the organic pigments market. Exhaustive secondary research was done to collect information on the market, peer market, and parent market. The next step was to validate these findings, assumptions, and sizing with industry experts across the value chain through primary research. Both top-down and bottom-up approaches were employed to estimate the complete market size. After that, market breakdown and data triangulation were used to estimate the market size of segments and subsegments.

Secondary Research

Secondary sources referred to for this research study include financial statements of companies offering organic pigments products and information from various trade, business, and professional associations. Secondary research has been used to obtain critical information about the industry’s value chain, the total pool of key players, market classification, and segmentation according to industry trends to the bottom-most level and regional markets. The secondary data was collected and analyzed to arrive at the overall size of the organic pigments market, which was validated by primary respondents.

Primary Research

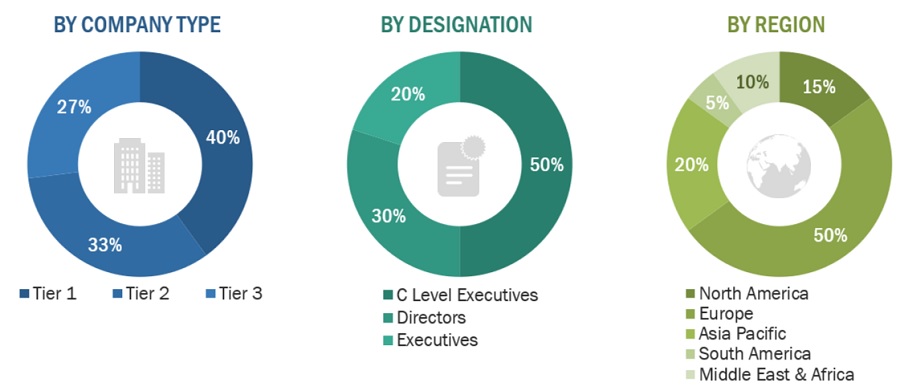
Extensive primary research was conducted after obtaining information regarding the organic pigments market scenario through secondary research. Several primary interviews were conducted with market experts from both the demand and supply sides across major countries of North America, Europe, Asia Pacific, the Middle East & Africa, and South America. Primary data was collected through questionnaires, emails, and telephonic interviews. The primary sources from the supply side included various industry experts, such as Chief X Officers (CXOs), Vice Presidents (VPs), Directors from business development, marketing, product development/innovation teams, and related key executives from organic pigments industry vendors; system integrators; component providers; distributors; and key opinion leaders. Primary interviews were conducted to gather insights such as market statistics, data on revenue collected from the products and services, market breakdowns, market size estimations, market forecasting, and data triangulation. Primary research also helped in understanding the various trends related to type, application, and region. Stakeholders from the demand side, such as CIOs, CTOs, CSOs, and installation teams of the customer/end users who are using organic pigments products were interviewed to understand the buyer’s perspective on the suppliers, products, component providers, and their current usage of organic pigments and outlook of their business which will affect the overall market.

The Breakup of Primary Research:
Organic Pigments Market Trends Size, and Share

To know about the assumptions considered for the study, download the pdf brochure

Market Size Estimation

The research methodology used to estimate the size of the organic pigments market includes the following details. The market sizing of the market was undertaken from the demand side. The market was upsized based on procurements and modernizations in organic pigments products in different applications at a regional level. Such procurements provide information on the demand aspects of the organic pigments industry for each application. For each application, all possible segments of the organic pigments market were integrated and mapped.

Organic Pigments Market Size: Botton Up Approach

Organic Pigments Market Trends Size, and Share

To know about the assumptions considered for the study, Request for Free Sample Report

Organic Pigemnts Market Size: Top-Down Approach

Organic Pigments Market Trends Size, and Share

Data Triangulation

After arriving at the overall size from the market size estimation process explained above, the total market was split into several segments and subsegments. The data triangulation and market breakdown procedures explained below were implemented, wherever applicable, to complete the overall market engineering process and arrive at the exact statistics for various market segments and subsegments. The data was triangulated by studying various factors and trends from the demand and supply sides. Along with this, the market size was validated using both the top-down and bottom-up approaches.

Market Definition

Organic pigments belong to the class of insoluble organic compounds of high coloring strength and are composed of carbon compounds. These pigments are insoluble in water, organic solvents, and various kinds of media like agar. The organic compounds used to make pigments have characteristics such as resistance to sunshine, flooding, acid, alkali, organic solvents, heat, and excellent dispersion properties in the application medium. Organic pigments provide outstanding durability, mobility, viscosity to inks, and color to plastics and synthetic fibers. They are used as reinforcing agents and fillers in rubber.

Key Stakeholders

  • Organic pigments manufacturers
  • Organic pigments suppliers
  • Raw material suppliers
  • End-use industries
  • Government bodies
  • Universities, governments, and research organizations
  • Research and consulting firms
  • R&D institutions
  • Investment banks and private equity firms

Report Objectives

  • To define, describe, and forecast the organic pigments market size in terms of volume and value.
  • To provide detailed information regarding the key factors, such as drivers, restraints, opportunities, and challenges influencing market growth
  • To analyze and project the global organic pigments market by type, source, application, and region.
  • To forecast the market size concerning five main regions (along with country-level data), namely, North America, Europe, Asia Pacific, South America, and the Middle East & Africa, and analyze the significant region-specific trends.
  • To strategically analyze micro markets with respect to individual growth trends, prospects, and contributions of the submarkets to the overall market
  • To analyze the market opportunities and the competitive landscape for stakeholders and market leaders
  • To assess recent market developments and competitive strategies, such as agreements, contracts, acquisitions, and new product developments/new product launches, to draw the competitive landscape.
  • To strategically profile the key market players and comprehensively analyze their core competencies.

Available Customizations

MarketsandMarkets offers following customizations for this market report:

  • Additional country-level analysis of the organic pigments market

Product Analysis

  • Product matrix, which provides a detailed comparison of the product portfolio of each company's market.

Previous Versions of this Report

Organic Pigments Market by Source (Synthetic and Natural), Type (Azo, Phthalocyanine, HPPs), Application (Printing inks, Paints & Coatings, Plastics), and Region (North America,Europe,APAC,MEA,and South America) - Global Forecast to 2026

Report Code CH 1530
Published in Aug, 2021, By MarketsandMarkets™

Organic Pigments Market by Source (Synthetic and Natural), Type (Azo, Phthalocyanine, HPPs), Application (Printing inks, Paints & Coatings, Plastics), and Region (North America,Europe,APAC,MEA,and South America) - Global Forecast to 2026

Report Code CH 1530
Published in Jul, 2018, By MarketsandMarkets™

Custom Market Research Services

We Will Customise The Research For You, In Case The Report Listed Above Does Not Meet With Your Requirements

Get 10% Free Customisation

Growth opportunities and latent adjacency in Organic Pigments Market

DMCA.com Protection Status