This study involved the extensive use of both primary and secondary sources. The research process involved the study of various factors affecting the industry to identify the segmentation types, industry trends, key players, competitive landscape, fundamental market dynamics, and key player strategies.
Secondary Research
The secondary research process involves the widespread use of secondary sources, directories, databases (such as Bloomberg Businessweek, Factiva, and D&B Hoovers), white papers, annual reports, company house documents, investor presentations, SEC filings of companies and publications from government sources [such as National Institutes of Health (NIH), US FDA, US Census Bureau, World Health Organization (WHO), Centers for Disease Control and Prevention (CDC), Global Burden of Disease Study , International Diabetes Federation (IDF), and Centers for Medicare and Medicaid Services (CMS) were referred to identify and collect information for the global pain management devices market study. It was also used to obtain important information about the key players and market classification & segmentation according to industry trends to the bottom-most level and key developments related to market and technology perspectives. A database of the key industry leaders was also prepared using secondary research.
Primary Research
In the primary research process, various sources from both the supply and demand sides were interviewed to obtain qualitative and quantitative information for this report. The primary sources from the supply side include industry experts such as CEOs, vice presidents, marketing and sales directors, technology & innovation directors, and related key executives from various key companies and organizations in the pain management devices market. The primary sources from the demand side include hospitals & clinics, physiotherapy clinics and home care settings. Primary research was conducted to validate the market segmentation, identify key players in the market, and gather insights on key industry trends & key market dynamics.
A breakdown of the primary respondents is provided below:
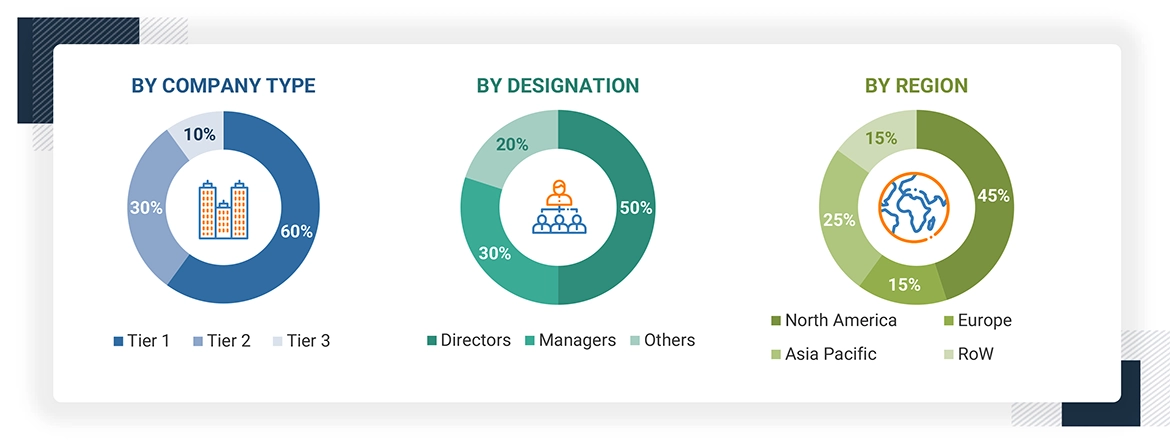
*C-level primaries include CEOs, CFOs, COOs, and VPs.
*Others include sales managers, marketing managers, business development managers, product managers, distributors, and suppliers.
Note: Companies are classified into tiers based on their total revenue. As of 2023, Tier 1 = >USD 10.00 billion, Tier 2 = USD 1.00 billion to USD 10.00 billion, and Tier 3 = < USD 1.00 billion.
Source: MarketsandMarkets Analysis
To know about the assumptions considered for the study, download the pdf brochure
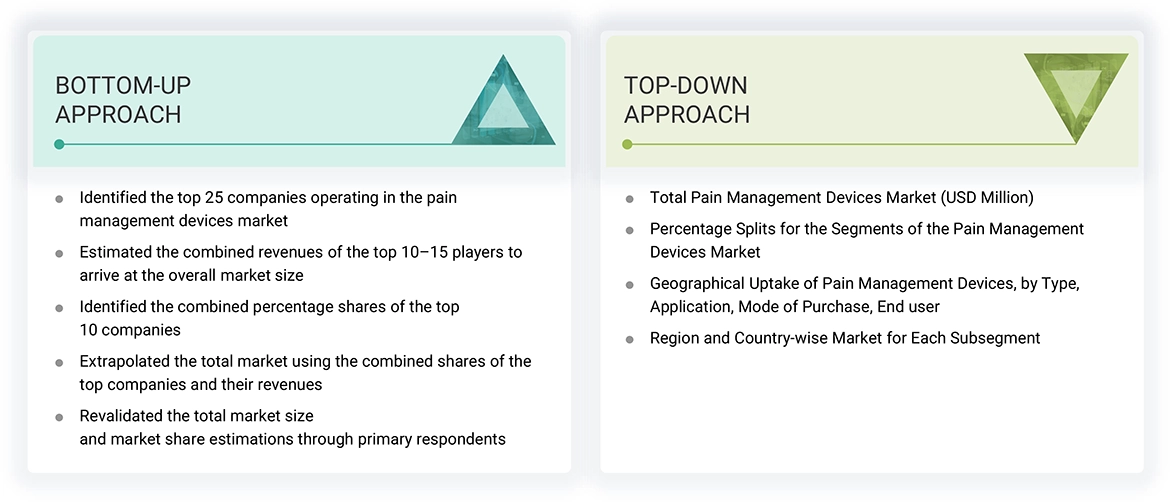
Market Size Estimation
For the global market value, annual revenues were calculated based on the revenue mapping of major product manufacturers and OEMs active in the global pain management devices market. All the major product manufacturers were identified at the global and/or country/regional level. Revenue mapping for the respective business segments/sub-segments was done for the major players (who contribute at least 70-75% of the market share at the global level). Also, the global pain management devices market was split into various segments and sub-segments based on:
-
List of major players operating in the pain management devices products market at the regional and/or country level
-
Product mapping of various pain management devices manufacturers at the regional and/or country level
-
Mapping of annual revenue generated by listed major players from pain management devices(or the nearest reported business unit/product category)
-
Revenue mapping of major players to cover at least 70-75% of the global market share as of 2023
-
Extrapolation of the revenue mapping of the listed major players to derive the global market value of the respective segments/subsegments
-
Summation of the market value of all segments/subsegments to arrive at the global point-of-care diagnostics market
The above-mentioned data was consolidated and added with detailed inputs and analysis from MarketsandMarkets and presented in this report.
Data Triangulation
After arriving at the overall size of the global pain management devices market through the above-mentioned methodology, this market was split into several segments and subsegments. The data triangulation and market breakdown procedures were employed, wherever applicable, to complete the overall market engineering process and arrive at the exact market value data for the key segments and subsegments. The extrapolated market data was triangulated by studying various macro indicators and regional trends from both demand- and supply-side participants.
Market Definition
Pain management devices are used to manage chronic and acute pain in patients suffering from various types of disease conditions, such as cancer, neurological disorders, and musculoskeletal disorders. These devices restore the ability to do everyday activities, decrease the need for oral pain medications, and improve the quality of life of patients suffering from these conditions
Stakeholders
-
Medical device manufacturers and distributors
-
Pain management devices manufacturers
-
Infusion pump and related instrument manufacturing companies
-
Suppliers and distributors of pain management devices
-
Hospitals and ambulatory surgery centers
-
Clinics
-
Home healthcare agencies
-
Research and consulting firms
-
Contract manufacturing organizations
-
Venture capitalists
Report Objectives
-
To define, measure, and describe the global pain management devices market by type, application, mode of purchase ,end user, and region
-
To provide detailed information about the major factors influencing the market growth (drivers, restraints, challenges, and opportunities)
-
To strategically analyze the regulatory scenario, pricing, value chain analysis, supply chain analysis, ecosystem analysis, technology analysis, Porter’s Five Forces analysis, and patent analysis
-
To analyze micromarkets with respect to individual growth trends, prospects, and contributions to the overall market
-
To analyze market opportunities for stakeholders and provide details of the competitive landscape for key players
-
To forecast the size of market segments in North America, Europe, Asia Pacific, Latin America, and the Middle East & Africa
-
To strategically analyze the market structure, profile the key players in the global pain management devices market, and comprehensively analyze their core competencies
-
To track and analyze company developments such as acquisitions, partnerships, expansions, and product launches and approvals in the pain management devices market


 HIGHEST CAGR MARKET IN 2023
 US FASTEST GROWING MARKET IN THE REGION


Martha
Jun, 2022
I need more details on how global key players are dominating the Pain Management Devices Market. Much Appreciated.
Jonathan
Jun, 2022
What are the recent developments in the Global Pain Management Devices Market?.