Performance Elastomers Market by Type (Nitrile-Based Elastomers, Silicone Elastomers, and Fluoroelastomers), End-Use Industry (Automotive and Transportation, Healthcare, Industrial Machinery, Building and Construction, and Electrical and Electronics), and Region - Global Forecast to 2022


[141 Pages Report] Performance Elastomers Market size was valued at USD 11.00 Billion in 2016 and is estimated to grow at a CAGR of 7.5% between 2017 and 2022. The main objective of the study is to define, describe, and forecast the performance elastomers market on the basis of type, end-use industry, and region. The report includes a detailed information about the major factors (drivers, opportunities, and industry-specific challenges) influencing the growth of the market. The report strategically analyzes the market segments with respect to individual growth trends, growth prospects, and contribution to the total market. The report includes analysis of the performance elastomers market on the basis of type (nitrile-based elastomers, silicone elastomers, and fluoroelastomers,), end-use industry (automotive and transportation, healthcare, industrial machinery, building and construction, and electrical and electronics), and region (Asia-Pacific, Europe, North America, Middle East & Africa, and South America). The market size of performance elastomers has been estimated, in terms of volume and value. The base year considered for the study is 2016, while the forecast period is between 2017 and 2022. The performance elastomers market is driven by the superior properties of this type of elastomers than standard elastomers and by the increasing demand in the automotive and transportation industry.
Both top-down and bottom-up approaches have been used to estimate and validate the size of the global performance elastomers market and to estimate the size of various other dependent sub-markets. Extensive secondary sources, directories, and databases such as Hoover�s, Bloomberg, Chemical Weekly, Factiva, Composite Panel Association (CPA), World Bank, Securities and Exchange Commission (SEC), and other government and private websites were referred to identify and collect information useful for this technical, market-oriented, and commercial study of the performance elastomers market.
To know about the assumptions considered for the study, download the pdf brochure
Some of the major market players active in the global performance elastomers market include E. I. du Pont de Nemours and Company (U.S.), Arlanxeo (Netherlands), Zeon Chemicals L.P. (U.S.), Solvay S.A. (Belgium), Dow Corning Corporation (U.S.), Wacker Chemie AG (Germany), Momentive Performance Materials Inc. (U.S.), 3M Company (U.S.), Shin-Etsu Chemical Co., Ltd. (Japan), Daikin Industries Ltd. (Japan), and The Dow Chemical Company (U.S.).
Key Target Audience:
Manufacturers of Performance Elastomers Material
- Original Equipment Manufacturers
- Automotive and Transportation Manufacturers
- Building Contractors
- Traders, Distributors, and Suppliers of Performance Elastomers
- Regional Manufacturers Associations and General Performance Elastomers Associations
- Government and Regional Agencies and Research Organizations
- Investment Research Firms
�The study answers several questions for the stakeholders, primarily which market segments to focus on in the next two to five years, for prioritizing efforts and investments.�
Scope of the Report:
This research report categorizes the global performance elastomers market on the basis of type, end-use industry, and region.
On the basis of Type:
- Nitrile-based Elastomers
- Silicone Elastomers
- Fluoroelastomers
On the basis of End-use Industry:
- Automotive and Transportation
- Industrial Machinery
- Building and Construction
- Healthcare
- Electrical and Electronics
On the basis of Region:
- Asia-Pacific
- Europe
- North America
- Middle East & Africa
- South America
The market is further analyzed for the key countries in each of these regions.
Available Customizations:
With the given market data, MarketsandMarkets offers customizations according to the company�s specific needs. The following customization options are available for the report:
End-use Sector Analysis
- Product matrix that gives a detailed analysis of various types of performance elastomers in each end-use industry
Regional Analysis
- Further breakdown of a region with respect to a particular country.
Company Information
- Detailed analysis and profiling of additional market players (up to 5)
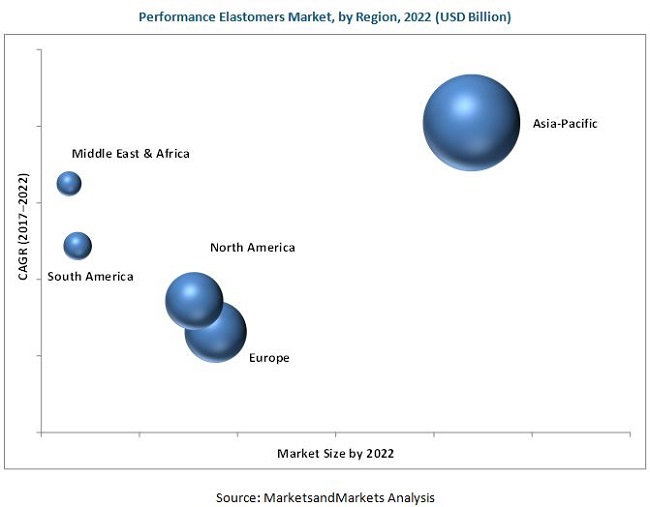
The global performance elastomers market is estimated to reach USD 16.75 Billion by 2022, at a CAGR of 7.5% from 2017 to 2022. The performance elastomers market has witnessed significant growth in the recent years, due to the excellent properties of performance elastomers, such as heat resistance, weathering and ozone resistance, flexibility, durability, aging resistance, huge variety, chemical resistance, and oil & gas resistance. The superior properties of performance elastomers over standard elastomers drive the global performance elastomers market.
The main types of performance elastomers are nitrile-based elastomers, fluoroelastomers, and silicone elastomers. Based on type, the silicone elastomers segment led the performance elastomers market in 2016 because of the use of silicone elastomers in several applications. This segment is estimated to grow at the highest CAGR, during the forecast period, because of the increasing adoption of silicone elastomers in variety of end-use industries such as automotive and transportation, building and construction, and medical, owing to their excellent properties and distinct varieties. The demand for general purpose silicone elastomers is high in all regions because of its superior performance and high disposable income of consumers.
Performance elastomers are used in various end-use industries such as automotive and transportation, healthcare, industrial machinery, building and construction, and electrical and electronics. Among the end-use industries, the automotive and transportation industry is projected to lead the performance elastomers market during the forecast period. Because of the implementation of stringent environmental regulations regarding emission levels, the design of vehicles has changed drastically over the past few decades. The manufacturers are designing vehicles to be compact, lightweight, and more efficient. For this the vehicle manufacturers require a performance elastomer. This demand ultimately drives the performance elastomers market.
North America, Europe, Asia-Pacific, Middle East & Africa, and South America have been considered as key markets for performance elastomers in the report. Asia-Pacific is estimated to lead the performance elastomers market because of the rising demand for performance elastomers from the automotive and transportation industry. The population in Europe is the second-largest consumers of performance elastomers globally. In addition, increasing disposable income and increasing demand from the automotive and transportation industry are fueling the demand for performance elastomers in various applications.
The performance elastomers market is expected to witness significant growth in the coming years. However, factors such as high production cost may hinder the growth of the market.
E. I. du Pont de Nemours and Company (U.S.), Arlanxeo (Netherlands), Shin-Etsu Chemical Co., Ltd. (Japan), Momentive Performance Materials Inc. (U.S.), and Daikin Industries Ltd. (Japan) are the key companies operational in the performance elastomers market. Targeting new markets will enable performance elastomer manufacturers to overcome the effects of volatile economy, leading to a diversified business portfolio and increase in revenue. Other major manufacturers of performance elastomers are Wacker Chemie AG (Germany), 3M Company (U.S.), The Dow Chemical Company (U.S.), Zeon Chemicals L.P. (U.S.), Solvay S.A. (Belgium), and Dow Corning Corporation (U.S.).
To speak to our analyst for a discussion on the above findings, click Speak to Analyst
 Exclusive indicates content/data unique to MarketsandMarkets and not available with any competitors.
Table of Contents
1 Introduction (Page No. - 15)
1.1 Objectives of the Study
1.2 Market Definition
1.3 Market Scope
1.3.1 Years Considered for the Study
1.4 Currency
1.5 Research Limitations
1.6 Stakeholders
2 Research Methodology (Page No. - 18)
2.1 Research Data
2.1.1 Secondary Data
2.1.1.1 Key Data From Secondary Sources
2.1.2 Primary Data
2.1.2.1 Key Data From Primary Sources
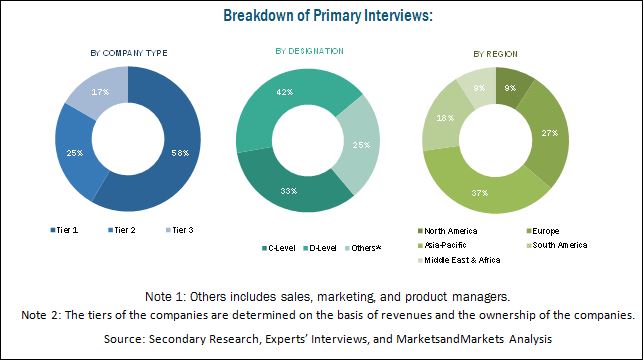
2.1.2.2 Breakdown of Primary Interviews
2.1.2.3 Key Insights From Primary Interviews
2.2 Market Size Estimation
2.2.1 Bottom-Up Approach
2.2.2 Top-Down Approach
2.3 Data Triangulation
2.4 Research Assumptions
3 Executive Summary (Page No. - 27)
4 Premium Insight (Page No. - 31)
4.1 Attractive Opportunities in Performance Elastomers Market
4.2 Performance Elastomers Market, By End-Use Industry
4.3 Performance Elastomers Market Share in Asia-Pacific, By Type and Country
4.4 Performance Elastomers Market, By End-Use Industry and Region
4.5 Performance Elastomers Market Attractiveness
5 Market Overview (Page No. - 35)
5.1 Introduction
5.2 Market Dynamics
5.2.1 Drivers
5.2.1.1 Increasing Demand in Automotive & Transportation Industry
5.2.1.2 Superior Properties Than Standard Elastomers
5.2.1.3 Increasing Purchasing Power of Consumers
5.2.2 Opportunities
5.2.2.1 Development of Eco-Friendly High Performance Elastomers
5.2.2.2 Development of New Grades of High Performance Elastomers
5.2.3 Challenges
5.2.3.1 High Production and Switching Costs
5.3 Porter�s Five Force Analysis
5.3.1 Bargaining Power of Suppliers
5.3.2 Bargaining Power of Buyers
5.3.3 Threat of New Entrants
5.3.4 Threat of Substitutes
5.3.5 Intensity of Competitive Rivalry
6 Performance Elastomers Market, By Type (Page No. - 41)
6.1 Introduction
6.2 Nitrile-Based Elastomers
6.2.1 Nitrile Butadiene Rubber (NBR)
6.2.2 Hydrogenated Nitrile Rubber (HNBR)
6.3 Fluoroelastomers
6.3.1 Fluorocarbon Elastomers (FKM)
6.3.2 Perfluoroelastomers (FFKM)
6.3.3 Fluorosilicone Elastomers (FVMQ)
6.4 Silicone Elastomers
6.4.1 High Temperature Vulcanized (HTV)
6.4.2 Liquid Silicone Rubber (LSR)
6.4.3 Room Temperature Vulcanized (RTV)
6.5 Others
6.5.1 Chlorinated Polyethylene (CPE)
6.5.2 Polyacrylate Rubber (ACM)
6.5.3 Ethylene Acrylic Elastomers (AEM)
6.5.4 Ethylene Vinyl Acetate Elastomers (EVM)
7 High Performance Elastomers, By End-Use Industry (Page No. - 47)
7.1 Introduction
7.2 Automotive & Transportation
7.3 Healthcare
7.4 Industrial Machinery
7.5 Building & Construction
7.6 Electrical & Electronics
7.6.1 Wires & Cables
7.7 Others
7.7.1 Consumer Goods
7.7.2 Oil & Gas
8 Performance Elastomers Market, By Region (Page No. - 53)
8.1 Introduction
8.2 North America
8.2.1 U.S.
8.2.2 Canada
8.2.3 Mexico
8.3 Asia-Pacific
8.3.1 China
8.3.2 Japan
8.3.3 India
8.3.4 Thailand
8.3.5 South Korea
8.3.6 Rest of Asia-Pacific
8.4 Europe
8.4.1 Germany
8.4.2 France
8.4.3 U.K.
8.4.4 Spain
8.4.5 Italy
8.4.6 Rest of Europe
8.5 South America
8.5.1 Brazil
8.5.2 Argentina
8.5.3 Rest of South America
8.6 Middle East & Africa
8.6.1 Saudi Arabia
8.6.2 South Africa
8.6.3 Rest of Middle East & Africa
9 Competitive Landscape (Page No. - 93)
9.1 Competitive Leadership Mapping
9.1.1 Visionary Leaders
9.1.2 Innovators
9.1.3 Dynamic Differentiators
9.1.4 Emerging Companies
9.2 Competitive Benchmarking
9.2.1 Strength of Product Portfolio (For All 25 Players)
9.2.2 Business Strategy Excellence (For All 25 Players)
Top 25 Companies Analyzed for This Study are - 3M Company, Arlanxeo, Asahi Glass Co., Ltd., Daikin Industries, Ltd., DOW Corning Corporation, E. I. Du Pont De Nemours and Company, Exxon Mobil Corporation, Flexan, LLC, James Walker, JSR Corporation, Kaco GmbH + Co. Kg, Kraiburg Tpe GmbH & Co. Kg, Mitsui Chemicals, Inc., Momentive Performance Materials Inc., Polycomp, Precision Polymer Engineering Ltd., Reiss Manufacturing Inc., Shin-Etsu Chemical Co., Ltd., Showa Denko K.K., Solvay S.A., the Chemours Company, the DOW Chemical Company, Tosoh Corporation, Wacker Chemie Ag, Zeon Chemicals L.P.,
9.3 Market Ranking Analysis
10 Company Profiles (Page No. - 99)
(Business Overview, Products Offered, Strength of Product Portfolio, Business Strategy Excellence, Recent Developments)*
10.1 E. I. Du Pont De Nemours and Company
10.2 Arlanxeo
10.3 Momentive Performance Materials Inc.
10.4 Shin-Etsu Chemical Co., Ltd.
10.5 Daikin Industries, Ltd.
10.6 3M Company
10.7 DOW Corning Corporation
10.8 Solvay S.A.
10.9 The DOW Chemical Company
10.10 Wacker Chemie AG
10.11 Zeon Chemicals L.P.
10.12 Other Market Players
10.12.1 Asahi Glass Co., Ltd.
10.12.2 Exxon Mobil Corporation
10.12.3 Flexan, LLC
10.12.4 James Walker & Co.
10.12.5 JSR Corporation
10.12.6 Kaco GmbH + Co. Kg
10.12.7 Kraiburg Tpe GmbH & Co. Kg
10.12.8 Mitsui Chemicals, Inc.
10.12.9 Polycomp
10.12.10 Precision Polymer Engineering Ltd.
10.12.11 Reiss Manufacturing Inc.
10.12.12 Showa Denko K.K.
10.12.13 The Chemours Company
10.12.14 Tosoh Corporation
*Details on Business Overview, Products Offered, Strength of Product Portfolio, Business Strategy Excellence, Recent Developments Might Not Be Captured in Case of Unlisted Companies.
11 Appendix (Page No. - 134)
11.1 Insights From Industry Experts
11.2 Discussion Guide
11.3 Knowledge Store: Marketsandmarkets� Subscription Portal
11.4 Introducing RT: Real-Time Market Intelligence
11.5 Available Customizations
11.6 Related Reports
11.7 Author Details
List of Tables (73 Tables)
Table 1 Performance Elastomers Market, By Type, 2015�2022 (Kiloton)
Table 2 Performance Elastomers Market, By Type, 2015-2022 (USD Million)
Table 3 Performance Elastomers Market, By End-Use Industry, 2015�2022 (Kiloton)
Table 4 Performance Elastomers Market, By End-Use Industry, 2015�2022 (USD Million)
Table 5 Performance Elastomers Market Size, By Region, 2015�2022 (Kiloton)
Table 6 Performance Elastomers Market Size, By Region, 2015�2022 (USD Million)
Table 7 North America: Economic Outlook (2016)
Table 8 North America: Performance Elastomers Market Size, By Country, 2015�2022 (Kiloton)
Table 9 North America: Performance Elastomers Market Size, By Country, 2015�2022 (USD Million)
Table 10 North America: Performance Elastomers Market Size, By End-Use Industry, 2015�2022 (Kiloton)
Table 11 North America: Performance Elastomers Market Size, By End-Use Industry, 2015�2022 (USD Million)
Table 12 U.S.: Performance Elastomers Market Size, By End-Use Industry, 2015�2022 (Kiloton)
Table 13 U.S.: Performance Elastomers Market Size, By End-Use Industry, 2015�2022 (USD Million)
Table 14 Canada: Performance Elastomers Market Size, By End-Use Industry, 2015�2022 (Kiloton)
Table 15 Canada: Performance Elastomers Market Size, By End-Use Industry, 2015�2022 (USD Million)
Table 16 Mexico: Performance Elastomers Market Size, By End-Use Industry, 2015�2022 (Kiloton)
Table 17 Mexico: Performance Elastomers Market Size, By End-Use Industry, 2015�2022 (USD Million)
Table 18 Asia-Pacific: Economic Outlook (2016)
Table 19 Asia-Pacific: Performance Elastomers Market Size, By Country, 2015�2022 (Kiloton)
Table 20 Asia-Pacific: Performance Elastomers Market Size, By Country, 2015�2022 (USD Million)
Table 21 Asia-Pacific: Performance Elastomers Market Size, By End-Use Industry, 2015�2022 (Kiloton)
Table 22 Asia-Pacific: Performance Elastomers Market Size, By End-Use Industry, 2015�2022 (USD Million)
Table 23 China: Performance Elastomers Market Size, By End-Use Industry, 2015�2022 (Kiloton)
Table 24 China: Performance Elastomers Market, By End-Use Industry, 2015�2022 (USD Million)
Table 25 Japan: Performance Elastomers Market Size, By End-Use Industry, 2015�2022 (Kiloton)
Table 26 Japan: Performance Elastomers Market Size, By End-Use Industry, 2015�2022 (USD Million)
Table 27 India: Performance Elastomers Market Size, By End-Use Industry, 2015�2022 (Kiloton)
Table 28 India: Performance Elastomers Market Size, By End-Use Industry, 2015�2022 (USD Million)
Table 29 Thailand: Performance Elastomers Market Size, By End-Use Industry, 2015�2022 (Kiloton)
Table 30 Thailand: Performance Elastomers Market Size, By End-Use Industry, 2015�2022 (USD Million)
Table 31 South Korea: Performance Elastomers Market Size, By End-Use Industry, 2015�2022 (Kiloton)
Table 32 South Korea: Performance Elastomers Market Size, By End-Use Industry, 2015�2022 (USD Million)
Table 33 Rest of Asia-Pacific: Performance Elastomers Market Size, By End-Use Industry, 2015�2022 (Kiloton)
Table 34 Rest of Asia-Pacific: Performance Elastomers Market Size, By End-Use Industry, 2015�2022 (USD Million)
Table 35 Europe: Economic Outlook (2016)
Table 36 Europe: Performance Elastomers Market Size, By End-Use Industry, 2015�2022 (Kiloton)
Table 37 Europe: Performance Elastomers Market Size, By End-Use Industry, 2015�2022 (USD Million)
Table 38 Europe: Performance Elastomers Market Size, By Country, 2015�2022 (Kiloton)
Table 39 Europe: Performance Elastomers Market Size, By Country, 2015�2022 (USD Million)
Table 40 Germany: Performance Elastomers Market Size, By End-Use Industry, 2015�2022 (Kiloton)
Table 41 Germany: Performance Elastomers Market Size, By End-Use Industry, 2015�2022 (USD Million)
Table 42 France: Performance Elastomers Market Size, By End-Use Industry, 2015�2022 (Kiloton)
Table 43 France: Performance Elastomers Market Size, By End-Use Industry, 2015�2022 (USD Million)
Table 44 U.K.: Performance Elastomers Market Size, By End-Use Industry, 2015�2022 (Kiloton)
Table 45 U.K.: Performance Elastomers Market Size, By End-Use Industry, 2015�2022 (USD Million)
Table 46 Spain: Performance Elastomers Market Size, By End-Use Industry, 2015�2022 (Kiloton)
Table 47 Spain: Performance Elastomers Market Size, By End-Use Industry, 2015�2022 (USD Million)
Table 48 Italy: Performance Elastomers Market Size, By End-Use Industry, 2015�2022 (Kiloton)
Table 49 Italy: Performance Elastomers Market Size, By End-Use Industry, 2015�2022 (USD Million)
Table 50 Rest of Europe: Performance Elastomers Market Size, By End-Use Industry, 2015�2022 (Kiloton)
Table 51 Rest of Europe: Performance Elastomers Market Size, By End-Use Industry, 2015�2022 (USD Million)
Table 52 South America: Economic Outlook (2016)
Table 53 South America: Performance Elastomers Market Size, By Country, 2015�2022 (Kiloton)
Table 54 South America: Performance Elastomers Market Size, By Country, 2015�2022 (USD Million)
Table 55 South America: Performance Elastomers Market Size, By End-Use Industry, 2015�2022 (Kiloton)
Table 56 South America: Performance Elastomers Market Size, By End-Use Industry, 2015�2022 (USD Million)
Table 57 Brazil: Performance Elastomers Market Size, By End-Use Industry, 2015�2022 (Kiloton)
Table 58 Brazil: Performance Elastomers Market Size, By End-Use Industry, 2015�2022 (USD Million)
Table 59 Argentina: Performance Elastomers Market Size, By End-Use Industry, 2015�2022 (Kiloton)
Table 60 Argentina: Performance Elastomers Market Size, By End-Use Industry, 2015�2022 (USD Million)
Table 61 Rest of South America: Performance Elastomers Market Size, By End-Use Industry, 2015�2022 (Kiloton)
Table 62 Rest of South America: Performance Elastomers Market Size, By End-Use Industry, 2015�2022 (USD Million)
Table 63 Middle East & Africa: Economic Outlook (2016)
Table 64 Middle East & Africa: Performance Elastomers Market Size, By Country, 2015�2022 (Kiloton)
Table 65 Middle East & Africa: Performance Elastomers Market Size, By Country, 2015�2022 (USD Million)
Table 66 Middle East & Africa: Performance Elastomers Market Size, By End-Use Industry, 2015�2022 (Kiloton)
Table 67 Middle East & Africa: Performance Elastomers Market Size, By End-Use Industry, 2015�2022 (USD Million)
Table 68 Saudi Arabia: Performance Elastomers Market Size, By End-Use Industry, 2015�2022 (Kiloton)
Table 69 Saudi Arabia: Performance Elastomers Market Size, By End-Use Industry, 2015�2022 (USD Million)
Table 70 South Africa: Performance Elastomers Market Size, By End-Use Industry, 2015�2022 (Kiloton)
Table 71 South Africa: Performance Elastomers Market Size, By End-Use Industry, 2015�2022 (USD Million)
Table 72 Rest of Middle East & Africa: Performance Elastomers Market Size, By End-Use Industry, 2015�2022 (Kiloton)
Table 73 Rest of Middle East & Africa: Performance Elastomers Market Size, By End-Use Industry, 2015�2022 (USD Million)
List of Figures (33 Figures)
Figure 1 High Performance Elastomers: Market Segmentation
Figure 2 Performance Elastomers Market: Research Design
Figure 3 Market Size Estimation: Bottom-Up Approach
Figure 4 Market Size Estimation: Top-Down Approach
Figure 5 Data Triangulation
Figure 6 Nitrile-Based Elastomers to Account for the Largest Share in Performance Elastomers Market During Forecast Period
Figure 7 Automotive & Transportation Industry to Register the Highest CAGR During Forecast Period
Figure 8 Asia-Pacific to Register the Fastest Growth During Forecast Period
Figure 9 Asia-Pacific Led the Performance Elastomers Market, in Terms of Volume, in 2016
Figure 10 Performance Elastomers Market to Register High CAGR Between 2017 and 2022
Figure 11 Automotive & Transportation to Register the Highest CAGR During Forecast Period
Figure 12 China Accounted for the Largest Market Share in 2016
Figure 13 Automotive & Transportation Accounted for the Largest Market Share in 2016
Figure 14 Asia-Pacific to Be the Fastest-Growing Market Between 2017 and 2022
Figure 15 Drivers, Opportunities, and Challenges of High Performance Elastomers
Figure 16 Porter�s Five Force Analysis
Figure 17 Performance Elastomers Market, By Type
Figure 18 Performance Elastomers Market in Automotive & Transportation Segment to Grow Rapidly Between 2017 and 2022
Figure 19 India, China, and Japan are Emerging as the Strategic Locations for Performance Elastomers Market, 2017�2022
Figure 20 Automotive & Transportation Industry to Drive Performance Elastomers Market in Asia-Pacific Between 2016 and 2022
Figure 21 China to Lead Performance Elastomers Market in Asia-Pacific, 2017�2022
Figure 22 Automotive & Transportation Industry to Drive Performance Elastomers Market in Europe Between 2016 and 2022
Figure 23 Performance Elastomers Market (Global) Competitive Leadership Mapping, 2016
Figure 24 Market Ranking of Key Players, 2016
Figure 25 E. I. Du Pont De Nemours and Company: Company Snapshot
Figure 26 Momentive Performance Materials Inc.: Company Snapshot
Figure 27 Shin-Etsu Chemical Co., Ltd.: Company Snapshot
Figure 28 Daikin Industries, Ltd.: Company Snapshot
Figure 29 3M Company: Company Snapshot
Figure 30 DOW Corning Corporation: Company Snapshot
Figure 31 Solvay S.A.: Company Snapshot
Figure 32 The DOW Chemical Company: Company Snapshot
Figure 33 Wacker Chemie AG: Company Snapshot


Growth opportunities and latent adjacency in Performance Elastomers Market