Pesticide Inert Ingredients Market by Type (Emulsifiers, Solvents, and Carriers), Source (Synthetic and Bio-based), Form (Dry and Liquid), Pesticide Type (Herbicides, Insecticides, Fungicides, and Rodenticides), and Region - Global Forecast to 2023


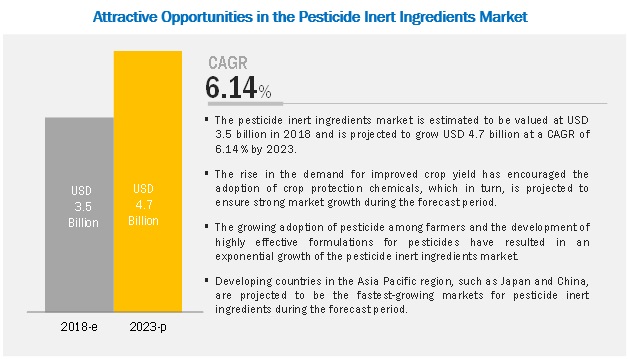
[153 Pages Report] The pesticide inert ingredients market is estimated to account for USD 3.5 billion in 2018 and is projected to reach USD 4.7 billion by 2023, at a CAGR of 6.14% during the forecast period. The need to ensure food security and cater to the requirements for pesticides in the agricultural industry drives the market for pesticides inert ingredients.
On the basis of type, the emulsifiers segment is projected to witness the fastest growth during the forecast period.
Emulsifiers help in stabilizing the mixture of two liquids and avoid the formation of immiscible liquid phases. Major emulsifiers that are used as inert ingredients are polymers, nonylphenol and alcohol ethoxylates, and alcohol alkoxylates. The demand for emulsifier-based products remains high in the North American region due to the increasing industrialization and decreasing land area for agriculture, which in turn, creates demand for the use of pesticides for ensuring food security and production.
With the increasing demand for organic fruits and vegetables, the bio-based segment is projected to witness the fastest growth, on the basis of source.
It has been witnessed that some of the inert ingredients used in pesticide formulation are more toxic than the active ingredients. Increasing health hazards associated with the usage of synthetic-based inert ingredients in pesticides creates an opportunity for the market players to develop bio-based inert ingredients from sources such as microbes for the formulation of bio-based pesticides. Governmental bodies and regulatory authorities have introduced regulations for the use of toxic pesticides, which affects the growth of bio-based inert ingredients in the market.
On the basis of form, the liquid segment is projected to account for a higher share in the pesticide inert ingredients market during the forecast period.
Liquid inert ingredients reduce waste and have a larger target coverage area. In addition, the uniformity and ease in mixing the liquid inert ingredients in pesticide formulations are key factors driving the demand for these forms among local manufacturers in developing countries. Thus, the liquid segment is estimated to dominate the pesticide inert ingredients market. Most of the pesticide formulations are also available in liquid form and thus the share for the liquid segment is projected to remain high.
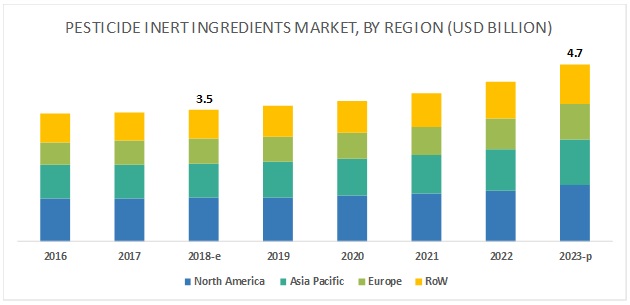
Asia Pacific is projected to witness the highest growth in the pesticide inert ingredients market during the forecast period.
The Asia Pacific region is one of the leading consumers of pesticides across regions, even though the region mainly depends on imports for pesticide supply. Inert ingredients are increasingly consumed by pesticide manufacturers at the production facility during the formulation stage, and countries such as India, Thailand, and Vietnam depend on imports for pesticides. Hence, the market for pesticide inert ingredients remains smaller when compared to the Americas and Europe. However, the pesticide inert ingredients market is well-established in developed countries with the increasing establishment of production plants in the Asian countries. Due to these factors, the use of inert ingredients along with pesticide application is projected to increase in the future.
Key Market Players
Major market players in the pesticide inert ingredients market are BASF (Germany), Clariant (Switzerland), DowDuPont (US), Stepan Company (US), and Croda International (UK). BASF SE (Germany), one of the world�s largest chemical companies, operates through seven major segments. With a broad product range, diverse customer base, and operations in more than 80 countries through its joint ventures and subsidiaries, the company has marked its presence on the growth trajectory. DowDuPont is another leading player wherein, Dow Crop Defense focuses on providing inert and additive ingredients, which enhances the effectiveness of pesticides and adjuvant formulations. This, in turn, helps farmers to produce and offer healthier crops. There are some other players in the industry, which are focusing on serving the market with various inert ingredient products and capturing a larger market share such as Eastman Chemicals (US), Solvay (Belgium), Evonik (Germany), Huntsman Corporation (US), Akzonobel (The Netherlands), Royal Dutch Shell (The Netherlands), and LyondellBasell Industries (Netherlands).
Scope of Report
|
Report Metric |
Details |
|
Market sizes available for years |
2016-2023 |
|
Base year considered |
2017 |
|
Forecast period |
2018-2023 |
|
Forecast units |
Value (USD) |
|
Segments covered |
Type, Form, Source, and Pesticide Type |
|
Geographies covered |
North America, Asia Pacific, Europe, and RoW |
|
Companies covered |
BASF SE (Germany), Dow Chemical Company (US), Stepan (US), Clariant (Switzerland), Stepan Company (US), Eastman Chemicals (US), Croda International (UK), and Solvay (Belgium). |
This research report categorizes the pesticide inert ingredients market based on type, source, form, pesticide type, and region.
On the basis of type, the pesticide inert ingredients market has been segmented as follows:
- Emulsifiers
- Solvents
- Carriers
- Others (Fragrances, dyes, and aerosol propellants)
On the basis of form, the pesticide inert ingredients market has been segmented as follows:
- Dry
- Liquid
- Others (Gels, pellets, and microencapsulations)
On the basis of source, the pesticide inert ingredients market has been segmented as follows:
- Synthetic
- Bio-based
On the basis of pesticide type, the pesticide inert ingredients market has been segmented as follows:
- Insecticides
- Herbicides
- Fungicides
- Rodenticides
- Others (Bactericides, larvicides, and nematicides)
On the basis of region, the pesticide inert ingredients market has been segmented as follows:
- North America
- Europe
- Asia Pacific
- RoW (South America, Africa, and the Middle East)
Recent Developments
- In November 2018, Clariant expanded the production capacity of its ethylene oxide (EO) unit in Gendorf, Germany. The expansion resulted in serving customers of various industries such as personal and home care, crop solutions, and industrial application, with EO-based products.
Key questions addressed by the report:
- Which market segments to focus on in the next two to five years for prioritizing efforts and investments?
- Which region will have the highest share in the pesticide inert ingredients market?
- Which type of pesticide inert ingredients witnesses high demand in each key country market?
- What are the trends and factors responsible for influencing the adoption rate of bio-based inert ingredients in key emerging countries?
- Which are the key players in the market and how intense is the competition?
To speak to our analyst for a discussion on the above findings, click Speak to Analyst
 Exclusive indicates content/data unique to MarketsandMarkets and not available with any competitors.
Table of Contents
1 Introduction (Page No. - 16)
1.1 Objectives of the Study
1.2 Market Definition
1.3 Study Scope
1.4 Regional Segmentation
1.5 Periodization Considered
1.6 Currency Considered
1.7 Stakeholders
2 Research Methodology (Page No. - 20)
2.1 Research Data
2.1.1 Secondary Data
2.1.2 Primary Data
2.1.2.1 Key Industry Insights
2.1.2.2 Breakdown of Primary Interviews
2.2 Market Size Estimation
2.3 Data Triangulation
2.4 Research Assumptions
2.5 Limitations
3 Executive Summary (Page No. - 28)
4 Premium Insights (Page No. - 32)
4.1 Opportunities in the Pesticide Inert Ingredients Market
4.2 Pesticide Inert Ingredients Market, By Type, 2017
4.3 Pesticide Inert Ingredients Market, By Source
4.4 Pesticide Inert Ingredients Market, By Pesticide Type and Region, 2017
4.5 Pesticide Inert Ingredients Market, By Form, 2017
4.6 Pesticide Inert Ingredients Market, By Key Country
5 Market Overview (Page No. - 36)
5.1 Introduction
5.2 Macroeconomic Indicators
5.2.1 Crop Loss Due to Pest Attacks
5.2.2 Increase in Use of Crop Protection Products in Developing Countries
5.3 Market Dynamics
5.3.1 Drivers
5.3.1.1 Increase in Demand for Specific Inert Ingredients in Different Pesticide Formulations
5.3.1.2 Supports the Distributional Coverage of Pesticide Application
5.3.2 Restraints
5.3.2.1 Emergence of Organic Farming Initiatives as an Alternative to High Pesticide Usage
5.3.2.1.1 Regulatory Bans of Inert Ingredients for High Toxicity
5.3.3 Opportunities
5.3.3.1 Sustainable and Bio-Based Inert Ingredients
5.3.3.2 Use of Inert Ingredients for Biological Formulations
5.3.4 Challenges
5.3.4.1 Limited Awareness Among Farmers Due to Confidentiality of Inert Ingredient Composition
5.4 Regulatory Framework
5.4.1 North America
5.4.1.1 Us
5.4.1.2 Canada
5.4.2 South America
5.4.2.1 Brazil
5.4.3 Europe
5.4.4 Asia Pacific
5.4.4.1 Australia
6 Pesticide Inert Ingredients Market, By Type (Page No. - 48)
6.1 Introduction
6.2 Emulsifiers
6.2.1 Stabilization of Pesticide Formulation are the Major Functions Responsible for High Demand of Emulsifiers
6.3 Solvents
6.3.1 Petrochemical-Based Solvents Have Been Increasingly Consumed By Pesticide Manufacturers in Recent Years
6.4 Carriers
6.4.1 Increasing Demand for Controlled-Release Pesticides Drives the Carrier Inert Ingredients Market
6.5 Others
7 Pesticide Inert Ingredients Market, By Source (Page No. - 55)
7.1 Introduction
7.2 Synthetic
7.2.1 Increasing Regulations on Toxic Levels of Inert Ingredient Composition has Been Restraining the Growth of This Segment
7.3 Bio-Based
7.3.1 Bio-Based Inert Ingredients Have Been Increasingly Preferred Owing to Its Low Toxic Nature and Easy Availability
8 Pesticide Inert Ingredients Market, By Form (Page No. - 59)
8.1 Introduction
8.2 Dry
8.2.1 Dry Inert Ingredients are Majorly Used in the Formulation of Rodenticides and Herbicides
8.3 Liquid
8.3.1 Emulsifiers and Solvents are the Majorly Used Inert Ingredients, Hence Liquid Form Occupies A Higher Share in the Market
8.4 Others
9 Pesticide Inert Ingredients Market, By Pesticide Type (Page No. - 63)
9.1 Introduction
9.2 Herbicides
9.2.1 According to FAO, in 2016, Herbicides Were the Majorly Consumed Pesticide Across the World
9.3 Insecticides
9.3.1 Stringent Regulations in Europe Towards Multiple Insecticides has Slackened the Growth Potential for Inert Ingredients
9.4 Fungicides
9.4.1 Focus of Key Players on Expanding Fungicide Production Drives the Inert Ingredients Market in Asia Pacific
9.5 Rodenticides
9.5.1 Naturally Sourced Inert Ingredients for Rodenticides has Expanded the Growth Potential for Rodenticide Manufacturers
9.6 Others
9.6.1 Nematicides
9.6.2 Bactericides & Larvicides
10 Pesticide Inert Ingredients Market, By Region (Page No. - 74)
10.1 Introduction
10.2 North America
10.2.1 US
10.2.1.1 US is One of the Major Producers of Pesticides, Especially Herbicides, Across the Globe
10.2.2 Canada
10.2.2.1 High Pesticide Production and Exports From the Country Lead to High Demand for Pesticide Inert Ingredients
10.2.3 Mexico
10.2.3.1 Increasing Application of Crop Protection Chemicals has Encouraged the Expansion of Manufacturing Plants By Key Players in Mexico
10.3 Europe
10.3.1 Spain
10.3.1.1 High Fungicide Production in Spain Drives the Market for Pesticide Inert Ingredients in the Region
10.3.2 UK
10.3.2.1 Fungicides has Been Gaining Increasing Importance Among Pesticide Manufacturers in the Country
10.3.3 Italy
10.3.3.1 Pesticide Manufacturers Have Been Developing Bio-Based Products at A High Scale in the Country
10.3.4 France
10.3.4.1 France is One of the Major Production Site for Pesticide in Europe, and Hence the Major Consumer of Inert Ingredients
10.3.5 Germany
10.3.5.1 Introduction of Pesticide Use Reduction Program in Germany is Projected to Inhibit the Growth of Pesticide Inert Ingredients Market
10.3.6 Rest of Europe
10.4 Asia Pacific
10.4.1 China
10.4.1.1 According to FAO, China is the Leading Producer of Pesticides Across the Globe and Hence A Major Consumer of Inert Ingredients
10.4.2 Japan
10.4.2.1 The Growing Demand for Pesticides and Favorable Government Regulations has Been Encouraging the Growth of Inert Ingredients
10.4.3 India
10.4.3.1 Key Players Have Been Focusing on Expansion of Pesticide Production in India, Thereby Increasing the Growth Potential for Inert Ingredients
10.4.4 Rest of Asia Pacific
10.5 Rest of the World (RoW)
10.5.1 South America
10.5.1.1 Key Pesticide Manufacturers Have Been Tapping Opportunities in the Brazil and Argentina Market
10.5.2 Africa
10.5.2.1 Decreasing Arable Land in Egypt has Been Attracting Investment From Private and Public Organizations in the African Region
10.5.3 Middle East
10.5.3.1 Resource Scarcity in the Region Leads to High Dependency on Import for Pesticides and Thereby A Sluggish Growth Opportunity for Inert Ingredients
11 Competitive Landscape (Page No. - 108)
11.1 Overview
11.2 Company Rankings
11.3 Competitive Scenario
11.3.1 Mergers & Acquisitions
11.3.2 Expansions & Investments
11.3.3 Agreements, Partnerships, and Joint Ventures
11.3.4 New Product Launches
12 Company Profiles (Page No. - 114)
(Business Overview, Products Offered, Recent Developments, SWOT Analysis, MnM View)*
12.1 BASF SE
12.2 Dowdupont
12.3 Clariant
12.4 Stepan
12.5 Royal Dutch Shell
12.6 Eastman Chemical Company
12.7 Croda International
12.8 Solvay S.A.
12.9 Evonik Industries
12.10 Huntsman Corporation
12.11 Lyondellbasell Industries Holdings B.V.
12.12 Akzonobel
*Details on Business Overview, Products Offered, Recent Developments, SWOT Analysis, MnM View Might Not Be Captured in Case of Unlisted Companies
13 Appendix (Page No. - 146)
13.1 Discussion Guide
13.2 Knowledge Store: Marketsandmarkets� Subscription Portal
13.3 Available Customizations
13.4 Related Reports
13.5 Author Details
List of Tables (69 Tables)
Table 1 Market Definition of Pesticide Inert Ingredients
Table 2 USD Exchange Rate, 2014�2017
Table 3 Actual Losses vs Potential Losses of Different Crops, 2001-2003 (%)
Table 4 Pesticide Inert Ingredients Market Size, By Type, 2016�2023 (USD Million)
Table 5 Emulsifiers: Pesticide Inert Ingredients Market Size, By Region, 2016�2023 (USD Million)
Table 6 Solvents: Pesticide Inert Ingredients Market Size, By Region, 2016�2023 (USD Million)
Table 7 Carriers: Pesticide Inert Ingredients Market Size, By Region, 2016�2023 (USD Million)
Table 8 Others: Pesticide Inert Ingredients Market Size, By Region, 2016�2023 (USD Million)
Table 9 Pesticide Inert Ingredients Market Size, By Source, 2016�2023 (USD Million)
Table 10 Synthetic Inert Ingredients Market Size, By Region, 2016-2023 (USD Million)
Table 11 Bio-Based Inert Ingredients Market Size, By Region, 2016-2023 (USD Million)
Table 12 Pesticide Inert Ingredients Market Size, By Form, 2016�2023 (USD Million)
Table 13 Dry Inert Ingredients Market Size, By Region, 2016�2023 (USD Million)
Table 14 Liquid Inert Ingredients Market Size, By Region, 2016�2023 (USD Million))
Table 15 Other Inert Ingredients Market Size, By Region, 2016�2023 (USD Million))
Table 16 Pesticide Inert Ingredients Market Size, By Pesticide Type, 2016�2023 (USD Million)
Table 17 Pesticide Inert Ingredients Market Size, By Pesticide Type, 2016�2023 (KT)
Table 18 Herbicide: Pesticide Inert Ingredients Market Size, By Region, 2016�2023 (USD Million)
Table 19 Herbicide: Pesticide Inert Ingredients Market Size, By Region, 2016�2023 (KT)
Table 20 Insecticide: Pesticide Insert Ingredients Market Size, By Region, 2016�2023 (USD Million)
Table 21 Insecticides: Pesticide Inert Ingredients Market Volume, By Region, 2016�2023 (KT)
Table 22 Fungicides: Pesticide Inert Ingredients Market Size, By Region, 2016�2023 (USD Million)
Table 23 Fungicide: Pesticide Inert Ingredients Market Volume, By Region, 2016�2023 (KT)
Table 24 Rodenticides: Pesticide Inert Ingredients Market Size, By Region, 2016�2023 (USD Million)
Table 25 Rodenticides: Pesticide Inert Ingredients Market Size, By Region, 2016�2023 (KT)
Table 26 Others: Pesticide Inert Ingredients Market Size, By Region, 2016�2023 (USD Million)
Table 27 Others: Pesticide Inert Ingredients Market Size, By Region, 2016�2023 (KT)
Table 28 Pesticide Inert Ingredients Market Size, By Region, 2016�2023 (USD Million)
Table 29 Pesticide Inert Ingredients Market Size, By Region, 2016�2023 (KT)
Table 30 North America: Pesticide Inert Ingredients Market Size, By Country, 2016�2023 (USD Million)
Table 31 North America: Pesticide Inert Ingredients Market Size, By Type, 2016�2023 (USD Million)
Table 32 North America: Pesticide Inert Ingredients Market Size, By Form, 2016�2023 (USD Million)
Table 33 North America: Pesticide Inert Ingredients Market Size, By Source, 2016�2023 (USD Million)
Table 34 North America: Pesticide Inert Ingredients Market Size, By Pesticide Type, 2016�2023 (USD Million)
Table 35 US: Pesticide Inert Ingredients Market Size, By Pesticide Type, 2016�2023 (USD Million)
Table 36 Canada: Pesticide Inert Ingredients Market Size, By Pesticide Type, 2016�2023 (USD Million)
Table 37 Mexico: Pesticide Inert Ingredients Market Size, By Pesticide Type, 2016�2023 (USD Million)
Table 38 Europe: Pesticide Inert Ingredients Market Size, By Country, 2016�2023 (USD Million)
Table 39 Europe: Pesticide Inert Ingredients Market Size, By Type, 2016�2023 (USD Million)
Table 40 Europe: Pesticide Inert Ingredients Market Size, By Form, 2016�2023 (USD Million)
Table 41 Europe: Pesticide Inert Ingredients Market Size, By Source, 2016�2023 (USD Million)
Table 42 Europe: Pesticide Inert Ingredients Market Size, By Pesticide Type, 2016�2023 (USD Million)
Table 43 Spain: Pesticide Inert Ingredients Market Size, By Pesticide Type, 2016�2023 (USD Million)
Table 44 UK: Pesticide Inert Ingredients Market Size, By Pesticide Type, 2016�2023 (USD Million)
Table 45 Italy: Pesticide Inert Ingredients Market Size, By Pesticide Type, 2016�2023 (USD Million)
Table 46 France: Pesticide Inert Ingredients Market Size, By Pesticide Type, 2016�2023 (USD Million)
Table 47 Germany: Pesticide Inert Ingredients Market Size, By Pesticide Type, 2016�2023 (USD Million)
Table 48 Rest of Europe: Pesticide Inert Ingredients Market Size, By Pesticide Type, 2016�2023 (USD Million)
Table 49 Asia Pacific: Pesticide Inert Ingredients Market Size, By Country, 2016�2023 (USD Million)
Table 50 Asia Pacific: Pesticide Inert Ingredients Market Size, By Type, 2016�2023 (USD Million)
Table 51 Asia Pacific: Inert Ingredients Market Size, By Form, 2016�2023 (USD Million)
Table 52 Asia Pacific: Pesticide Inert Ingredients Market Size, By Source, 2016�2023 (USD Million)
Table 53 Asia Pacific: Pesticides Inert Ingredients Market Size, By Pesticide Type, 2016�2023 (USD Million)
Table 54 China: Pesticide Inert Ingredients Market Size, By Pesticide Type, 2016�2023 (USD Million)
Table 55 Japan: Pesticide Inert Ingredients Market Size, By Pesticide Type, 2016�2023 (USD Million)
Table 56 India: Pesticide Inert Ingredients Market Size, By Pesticide Type, 2016�2023 (USD Million)
Table 57 Rest of Asia Pacific: Pesticide Inert Ingredients Market Size, By Pesticide Type, 2016�2023 (USD Million)
Table 58 RoW: Pesticide Inert Ingredients Market Size, By Region, 2016�2023 (USD Million)
Table 59 RoW: Pesticide Inert Ingredients Market Size, By Pesticide Type, 2016�2023 (USD Million)
Table 60 RoW: Pesticide Inert Ingredients Market Size, By Form, 2016�2023 (USD Million)
Table 61 RoW: Pesticide Inert Ingredients Market Size, By Source, 2016�2023 (USD Million)
Table 62 RoW: Pesticide Inert Ingredients Market Size, By Pesticide Type, 2016�2023 (USD Million)
Table 63 South America: Pesticide Inert Ingredients Market Size, By Pesticide Type, 2016�2023 (USD Million)
Table 64 Africa: Pesticide Inert Ingredients Market Size, By Pesticide Type, 2016�2023 (USD Million)
Table 65 Middle East: Pesticide Inert Ingredients Market Size, By Pesticide Type, 2016�2023 (USD Million)
Table 66 Mergers & Acquisitions, 2014�2018
Table 67 Expansions & Investments, 2014�2018
Table 68 Collaborations, Agreements, Partnerships, and Joint Ventures, 2014�2018
Table 69 New Product Launches, 2014�2018
List of Figures (45 Figures)
Figure 1 Pesticide Inert Ingredients Market Segmentation
Figure 2 Pesticide Inert Ingredients Market: Research Design
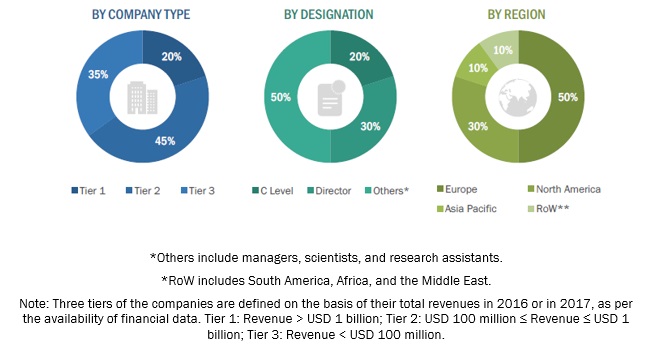
Figure 3 Breakdown of Primary Interviews: By Company Type, Designation, and Region
Figure 4 Market Size Estimation Methodology: Bottom-Up Approach
Figure 5 Market Size Estimation Methodology: Top-Down Approach
Figure 6 Data Triangulation Methodology
Figure 7 Pesticide Inert Ingredients Market, By Type, 2017 (USD Million)
Figure 8 Pesticide Inert Ingredients Market, By Form, 2017 (USD Million)
Figure 9 Pesticide Inert Ingredients Market Share, By Pesticide Type, 2017
Figure 10 Pesticide Inert Ingredients Market: Regional Snapshot
Figure 11 High Demand for Crop Protection Chemicals Leading to Steady Growth of the Pesticide Inert Ingredients Market
Figure 12 Emulsifiers Accounted for the Largest Share of the Inert Ingredients Market in 2017
Figure 13 Synthetic Segment Projected to Dominate Throughout the Forecast Period
Figure 14 Europe Held A Significant Share for Fungicides in 2017
Figure 15 Liquid Inert Ingredients Accounted for the Largest Market Share in 2017
Figure 16 China and India are the Major Hot Spots in the Asia Pacific Region
Figure 17 Trends of Global Pesticide Usage, 2006�2016 (Million Tons)
Figure 18 Global Crop Protection and Non-Crop Chemicals Market, 2000�2014 (USD Million)
Figure 19 Pesticide Inert Ingredients Market: Drivers, Restraints, Opportunities, and Challenges
Figure 20 Trends in Organic Food Demand in Asia Pacific, 2004�2010 (USD Billion)
Figure 21 Pesticide Inert Ingredients Market, By Type, 2018 vs 2023 (USD Million)
Figure 22 Pesticide Inert Ingredients Market, By Source, 2018 vs 2023 (USD Million)
Figure 23 Pesticide Inert Ingredients Market, By Form, 2018 vs 2023 (USD Million)
Figure 24 Pesticide Inert Ingredients Market Size, By Pesticide Type, 2018�2023 (USD Million)
Figure 25 Pesticide Inert Ingredients Market Size, By Pesticide Type, 2018�2023 (KT)
Figure 26 Japan Dominated the Pesticide Inert Ingredients Market, With the Highest CAGR During the Forecast Period
Figure 27 North America: Market Snapshot
Figure 28 Asia Pacific: Market Snapshot
Figure 29 Key Developments By Leading Players in Pesticide Inert Ingredients Market, 2014�2018
Figure 30 Pesticide Inert Ingredients, Company Rankings, 2017
Figure 31 BASF SE: Company Snapshot
Figure 32 BASF: SWOT Analysis
Figure 33 DOW Chemical Company: SWOT Analysis
Figure 34 Clariant: Company Snapshot
Figure 35 Clariant: SWOT Analysis
Figure 36 Stepan: Company Snapshot
Figure 37 Stepan: SWOT Analysis
Figure 38 Royal Dutch Shell: Company Snapshot
Figure 39 Eastman Chemical Company: Company Snapshot
Figure 40 Croda International: Company Snapshot
Figure 41 Solvay: Company Snapshot
Figure 42 Evonik: Company Snapshot
Figure 43 Huntsman Corporation: Company Snapshot
Figure 44 Lyondellbasell: Company Snapshot
Figure 45 Akzonobel: Company Snapshot
The study includes four major activities to estimate the current market size for pesticide inert ingredients. Exhaustive secondary research was done to collect information on the overall market and the peer market. The next step was to validate these findings, assumptions, and sizing with industry experts across value chain through primary research. Both top-down and bottom-up approaches were used to estimate the complete market size. Thereafter, data triangulation was used, and the market breakdown was done to estimate the market size of segments and subsegments.
Secondary Research
In the secondary research process, various secondary sources were referred to, so as to identify and collect information for this study. The secondary sources included annual reports, journals, associations such as The Federal Insecticide, Fungicide, and Rodenticide Act (FIFRA) and Environmental Protection Agency (EPA), press releases and investor presentations of companies, white papers, certified publications, articles from recognized authors, gold & silver standard websites, regulatory bodies, trade directories, and databases. Secondary research was mainly used to obtain important information about the industry�s supply chain, the market�s value chain, key players, and the market classification and segmentation, according to industry trends to the bottom-most level and geographical markets. It was also used to obtain information on key developments from a market-oriented perspective.
Primary Research
The market comprises several stakeholders in the supply chain, which includes raw material suppliers, service providers, genetic research institutions, seed companies, and end-use farmers. Various primary sources from both, the supply and demand sides of the market were interviewed to obtain qualitative and quantitative information. The primary interviewees from the demand side include key opinion leaders, executives, vice presidents, and CEOs of companies producing commercial seeds. The primary sources from the supply side include plant breeding service providers, genetic solution providers, R&D institutions and organizations, and key opinion leaders.
To know about the assumptions considered for the study, download the pdf brochure
Market Size Estimation
Both top-down and bottom-up approaches were used to estimate and validate the total size of the market. These approaches were also used extensively to estimate the size of various dependent submarkets. The research methodology was used to estimate the market size includes the following:
- The key players in the industry and markets were identified through extensive secondary research.
- All percentage share splits and breakdowns were determined using secondary sources and verified through primary sources.
- All the possible parameters that affect the markets covered in this research study was conducted in extensive detail, verified through primary research, and analyzed to obtain the final quantitative and qualitative data.
- Research included the study of reports, reviews, and newsletters of top market players along with extensive interviews for opinions from leaders such as CEOs, directors, and marketing executives.
Data Triangulation
After arriving at the overall market size from the estimation process explained above, the total market was split into several segments and subsegments. In order to arrive at the exact statistics for all segments and subsegments, the data triangulation and market breakdown procedures were employed wherever applicable. The data was triangulated by studying various factors and trends from both, the demand and supply sides. Along with this, the market was validated using both top-down and bottom-up approaches.Report Objectives
- Determining and projecting the size of the pesticide inert ingredients market with respect to type, form, source, pesticide type, and region over a five-year period from 2018 to 2023
- Identifying attractive opportunities in the market by determining the largest and fastest-growing segments across regions
- Analyzing the demand-side factors on the basis of the following:
- Impact of macro- and microeconomic factors on the market
- Shifts in demand patterns across different subsegments and regions
- Recognizing the key drivers and restraints impacting the global market
- Analyzing regulatory frameworks across regions and their impact on prominent market players
- Providing insights on key investments in technology innovations and technology
- Profiling key players of the pesticide inert ingredients market and comprehensively analyzing their market position and core competencies
- Providing a comparative analysis of market leaders on the basis of the following:
- Product offerings
- Business strategies
- Strengths, weaknesses, opportunities, and threats
- Key financials
- Understanding the competitive landscape and identifying major growth strategies adopted by players across key regions
- Analyzing the regulatory frameworks across regions and their impact on prominent market players
- Providing insights on key investments in product innovations and technology development
Available Customizations
With the given market data, MarketsandMarkets offers customizations according to the company�s specific scientific needs.
The following customization options are available for the report:
Product Analysis:
- Product Matrix, which gives a detailed comparison of the product portfolio of each company
Regional Analysis
- Further breakdown of the Rest of European market for pesticide inert ingredients market into Netherlands, Belgium, and Switzerland.
- Further breakdown of the Rest of Asia Pacific market for plant breeding into Thailand, Australia, Malaysia, and Indonesia.
Company Information
- Detailed analyses and profiling of additional market players (up to five)


Growth opportunities and latent adjacency in Pesticide Inert Ingredients Market