Surfactants Market

Surfactants Market by Type (Anionic, Non-Ionic, Cationic, and Amphoteric), Application (Home Care, Personal Care, Industrial & Institutional Cleaning, Textile, Elastomers & Plastics, Agrochemicals, and Food & Beverage), Region - Global Forecast to 2025

Report Code: CH 3464 Jun, 2020, by marketsandmarkets.com

Updated on : January 11, 2023

The global surfactants market size was valued at USD 42.1 billion in 2020 and is projected to reach USD 52.4 billion by 2025, growing at a cagr 4.5% from 2020 to 2025. The growth of the market is driven by the growing population and increasing urbanization in Asia Pacific. In addition, growing awareness about the products such as hand sanitizer due to COVID-19 is another factor driving its demand.

Surfactants Market

“Anionic surfactants led the surfactants market in 2019.”

Anionic surfactants led the surfactants market in 2019. This is owed to its low cost and ease of availability. In addition, it is used in a wide variety of applications. The growing awareness regarding cleaning and hygiene are other factors driving its demand.

“Home care application led the surfactants market in 2019.”

Home care application led the surfactants market in 2019. Surfactants are used various products such as dishwashing detergents, laundry detergents, laundry and dishwashing soaps, carpet cleaners, and floor cleaners, among others.  They are also used in home care products to remove oil, dirt, and unwanted particles from fabrics, dishes, and other surfaces.

Surfactants Market by Region

North America to account for the largest share of the global surfactant market during the forecast period, in terms of value.

North America is expected to account for the largest share in the global surfactants market during the forecast period, in terms of and value. However, APAC is expected to lead the market in terms of volume. The use of bio-based surfactants in North America and the need to import the raw materials from countries such as Thailand and Malaysia leads to higher prices of surfactants when compared to APAC. This leads to the greater market share of North America in terms of value when compared to APAC.  

Surfactants Market Players

The key market players profiled in the report include as BASF SE (Germany), Nouryon (North Holland), Evonik Industries AG (Germany), Stepan Company (US), Solvay (Belgium), The Dow Chemical Company (US), Indorama Ventures Public Company Limited (Thailand), Clariant (Switzerland), Ashland Global Holdings Inc. (US), Kao Corporation (Japan), Lonza (Switzerland), and Croda International Plc (UK), among others.

BASF SE is one of the leading producers of surfactants. The company has undertaken expansion and new product launch as its growth strategy in the surfactants market. For instance, in October 2019, the company launched Texapon SFA and Dehyton SFA surfactants. The company also increased its production capacity for Alkyl Polyglucosides (APG) in Jinshan, China by an additional 10,000 metric tons in October 2019. APGs are non-ionic surfactants and are manufactured from 100% natural and renewable feedstocks.

Nouryon is another leading player in the surfactant market. The company focuses on expansion, new product launch, and agreement to remain competitive in the surfactants market. For instance, in March 2019, the company launched a next-generation surfactant used as additive, Ethylan EF-60, which enables formulators to ensure low temperature storage stability of VOC-free water-borne latex paint products.

Surfactants Market Report Scope

Report Metric

Details

Market Size Value in 2020

USD 42.1 billion

Revenue Forecast in 2025

USD 52.4 billion

CAGR

4.5%

Years considered for the study

2018-205

Base year considered

2019

Forecast period

2020-2025

Units considered

Value (USD Million), Volume (Kiloton)

Segments covered

Type, Application, and Region

Regions covered

APAC, North America, Europe, Middle East & Africa, and South America

Companies profiled

Stepan Company (US), Evonik Industries AG (Germany), Solvay (Belgium), Clariant (Switzerland), Ashland Global Holdings Inc.(US), The Dow Chemical Company (US), BASF SE (Germany), Nouryon (North Holland), Indorama Ventures Public Company Limited (Thailand), Kao Corporation (Japan), Lonza (Switzerland), Croda International Plc (UK), and others.

This report categorizes the global surfactants market based on type, application, and region.

Based on Type:

  • Anionic surfactants
  • Non-ionic surfactants
  • Cationic surfactants
  • Amphoteric surfactants

Based on Application:

  • Home Care
  • Personal Care
  • Industrial & Institutional Cleaning
  • Oilfield Chemicals
  • Food & Beverage
  • Agrochemicals
  • Textiles
  • Elastomers & Plastics
  • Others

Based on Region:

  • APAC
  • North America
  • Europe
  • Middle East & Africa
  • South America

Recent Developments

  • In March 2020, Stepan Company acquired Logos Technologies LLCs NatSurFact business, a rhamnolipid-based line of bio-surfactants derived from renewable sources. Rhamnolipids, a class of bio-surfactants, are attractive due to their favorable biodegradability, low toxicity and, in some cases, unique antimicrobial properties.
  • In December 2019, Unilever in partnership with Evonik, launched a biosurfactant, Rhamnolipid. Rhamnolipid is 100% renewable and biodegradable in nature. It is also ultra-mild on the skin, which sets it apart from other surfactants. This surfactant was, for the first time, used by Unilever in its Quix dishwashing brand in Chile.
  • In October 2019, Solvay launched two new products from its Rhodapex BR APE Free surfactant line (nonylphenol ethoxylate free). The new product launch helped the company to meet the growing demand in the water-based polymerization and emulsion paint, adhesives, and textile applications in Brazil and other South American countries.

Key Questions Addressed by the Report

  • What are the major developments impacting the market?
  • Where will all the developments take the industry in the mid to long term?
  • What are the emerging applications of surfactants?
  • What are the major factors impacting the market growth during the forecast period?

To speak to our analyst for a discussion on the above findings, click Speak to Analyst


TABLE OF CONTENTS

1 INTRODUCTION (Page No. - 21)
    1.1 OBJECTIVES OF THE STUDY
    1.2 MARKET DEFINITION
           1.2.1 SURFACTANTS: MARKET DEFINITION
    1.3 MARKET SCOPE
           1.3.1 REGIONS COVERED
           1.3.2 YEARS CONSIDERED FOR THE STUDY
    1.4 CURRENCY
    1.5 UNIT CONSIDERED
    1.6 LIMITATION
    1.7 STAKEHOLDERS

2 RESEARCH METHODOLOGY (Page No. - 25)
    2.1 RESEARCH DATA
           2.1.1 SECONDARY DATA
           2.1.2 PRIMARY DATA
                    2.1.2.1 Key data from primary sources
                    2.1.2.2 Key industry insights
                    2.1.2.3 Breakdown of primary interviews
    2.2 MARKET SIZE ESTIMATION
           2.2.1 BOTTOM-UP APPROACH
           2.2.2 TOP-DOWN APPROACH
    2.3 MARKET SIZE CALCULATION AND DATA TRIANGULATION
    2.4 ASSUMPTIONS

3 EXECUTIVE SUMMARY (Page No. - 32)
    3.1 SURFACTANTS MARKET: REALISTIC PESSIMISTIC OPTIMISTIC AND PRE-COVID-19 SCENARIO
           3.1.1 NON-COVID-19 SCENARIO
           3.1.2 OPTIMISTIC SCENARIO
           3.1.3 PESSIMISTIC SCENARIO
           3.1.4 REALISTIC SCENARIO

4 PREMIUM INSIGHTS (Page No. - 36)
    4.1 ATTRACTIVE OPPORTUNITIES IN THE SURFACTANTS MARKET
    4.2 SURFACTANT MARKET BY REGION
    4.3 SURFACTANTS MARKET BY TYPE
    4.4 APAC SURFACTANT MARKET BY COUNTRY AND TYPE (2019)
    4.5 SURFACTANTS MARKET: MAJOR COUNTRIES

5 MARKET OVERVIEW (Page No. - 39)
    5.1 INTRODUCTION
    5.2 MARKET DYNAMICS
           5.2.1 DRIVERS
                    5.2.1.1 Rising demand from various applications
           5.2.2 RESTRAINTS
                    5.2.2.1 Implementation of stringent regulations by government agencies
           5.2.3 OPPORTUNITIES
                    5.2.3.1 Growing demand for bio-based surfactants and sustainable green surfactant products
           5.2.4 CHALLENGES
                    5.2.4.1 Toxicity of some surfactants
                    5.2.4.2 Volatility in raw material prices

6 INDUSTRY TRENDS (Page No. - 42)
    6.1 INTRODUCTION
    6.2 SUPPLY CHAIN ANALYSIS
           6.2.1 RAW MATERIALS
           6.2.2 SYNTHESIS
           6.2.3 DOWNSTREAM PROCESS
           6.2.4 MARKET & DISTRIBUTION
           6.2.5 END-USE INDUSTRIES
    6.3 ECOSYSTEM OF SURFACTANTS MARKET
    6.4 AVERAGE SELLING PRICE RANGE
    6.5 TECHNOLOGY ANALYSIS
    6.6 PATENT ANALYSIS
    6.7 CASE STUDY ANALYSIS
           6.7.1 CASE STUDY OF EMULSIONS BREAKER AT SEMANGGI FIELD PRODUCTION
    6.8 PORTER’S FIVE FORCES ANALYSIS
           6.8.1 THREAT OF NEW ENTRANTS
           6.8.2 THREAT OF SUBSTITUTES
           6.8.3 BARGAINING POWER OF SUPPLIERS
           6.8.4 BARGAINING POWER OF BUYERS
           6.8.5 INTENSITY OF COMPETITIVE RIVALRY
    6.9 MACROECONOMIC INDICATORS
           6.9.1 GDP TRENDS AND FORECAST OF MAJOR ECONOMIES

7 IMPORT AND EXPORT OF SURFACTANTS (Page No. - 52)
    7.1 INTRODUCTION
    7.2 ANIONIC SURFACTANTS
    7.3 NON-IONIC SURFACTANTS
    7.4 CATIONIC SURFACTANTS

8 IMPACT OF COVID-19 ON SURFACTANTS MARKET (Page No. - 69)
    8.1 INTRODUCTION
    8.2 IMPACT OF COVID-19 ON SUPPLY CHAIN OR LOGISTICS
    8.3 IMPACT OF COVID-19 ON DIFFERENT SURFACTANTS
    8.4 IMPACT OF COVID-19 ON PALM OIL
    8.5 IMPACT OF COVID-19 ON HOME CARE MARKET
    8.6 IMPACT OF COVID-19 ON OIL INDUSTRY

9 SURFACTANTS MARKET BY SUBSTRATE (Page No. - 71)
    9.1 INTRODUCTION
    9.2 SYNTHETIC SURFACTANTS
    9.3 BIO-BASED SURFACTANTS
           9.3.1 CHEMICALLY SYNTHESIZED BIO-BASED SURFACTANTS
                    9.3.1.1 Sucrose esters
                    9.3.1.2 Alkyl polyglycosides
                    9.3.1.3 Fatty acid glucamides
                    9.3.1.4 Sorbitan esters
           9.3.2 BIOSURFACTANTS
                    9.3.2.1 Low molecular weight biosurfactants
                    9.3.2.2 High molecular weight biosurfactants

10 SURFACTANTS MARKET BY TYPE (Page No. - 74)
     10.1 INTRODUCTION
     10.2 ANIONIC SURFACTANTS
             10.2.1 LOW COST AND EASY AVAILABILITY DRIVE THE DEMAND FOR ANIONIC SURFACTANTS
             10.2.2 LINEAR ALKYLBENZENE SULFONATE
             10.2.3 ALCOHOL ETHOXY SULFATES
             10.2.4 SECONDARY ALKANE SULFONATES
             10.2.5 ALPHA OLEFIN SULFONATES
             10.2.6 METHYL ESTER SULFONATES
             10.2.7 SULFOSUCCINATES
             10.2.8 OTHERS
     10.3 NON-IONIC SURFACTANTS
             10.3.1 LOW FOAMING AND BETTER EMULSIFYING PROPERTY TO DRIVE THE GROWTH OF NON-IONIC SURFACTANTS
             10.3.2 ALCOHOL ETHOXYLATES
             10.3.3 ALKYL PHENOL ETHOXYLATES
             10.3.4 AMINE OXIDES
             10.3.5 FATTY ACID ESTERS
             10.3.6 OTHERS
     10.4 CATIONIC SURFACTANTS
             10.4.1 NON-MIXABILITY WITH ANIONIC SURFACTANTS TO AFFECT THE CATIONIC SURFACTANTS SEGMENT
             10.4.2 QUATERNARY AMMONIUM COMPOUNDS
             10.4.3 OTHERS
     10.5 AMPHOTERIC SURFACTANTS
             10.5.1 THE GROWING DEMAND FOR PERSONAL CARE PRODUCTS TO DRIVE THE AMPHOTERIC SURFACTANTS SEGMENT
             10.5.2 BETAINES
             10.5.3 OTHERS

11 SURFACTANTS MARKET BY APPLICATION (Page No. - 84)
     11.1 INTRODUCTION
     11.2 HOME CARE
             11.2.1 GROWING DEMAND FOR DETERGENTS FABRIC SOFTENERS AND DISHWASHING AGENTS TO DRIVE THE MARKET IN THE HOME CARE SEGMENT
     11.3 PERSONAL CARE
             11.3.1 GROWING POPULATION RISING CONSUMER SPENDING INCREASING DISPOSABLE INCOME TO DRIVE THE DEMAND FOR SURFACTANTS IN PERSONAL CARE APPLICATION
     11.4 TEXTILE
             11.4.1 GROWING PRODUCTION OF TEXTILES TO DRIVE THE SURFACTANTS MARKET
     11.5 INDUSTRIAL & INSTITUTIONAL (I&I) CLEANING
             11.5.1 REQUIREMENT OF PROPERTIES SUCH AS DETERGENCY FOAM CONTROL AND BACTERIAL ACTION TO DRIVE THE MARKET
     11.6 ELASTOMERS & PLASTICS
             11.6.1 NEED TO MODIFY THE CHARACTERISTICS OF ELASTOMERS & PLASTICS DRIVES THE SURFACTANT MARKET
     11.7 OILFIELD CHEMICALS
             11.7.1 USE OF SURFACTANTS DURING THE OIL PRODUCTION PROCESS TO DRIVE THEIR DEMAND
     11.8 AGROCHEMICALS
             11.8.1 NEED FOR ADJUVANTS IN AGROCHEMICALS TO DRIVE THE DEMAND FOR SURFACTANTS IN THIS SEGMENT
     11.9 FOOD & BEVERAGE
             11.9.1 GROWING DEMAND FOR FOOD & BEVERAGES TO DRIVE THE SURFACTANTS MARKET GLOBALLY
     11.10 OTHERS
             11.10.1 PHARMACEUTICALS
             11.10.2 PAINTS & COATINGS
             11.10.3 CONSTRUCTION
             11.10.4 LUBRICANT & FUEL ADDITIVES
             11.10.5 MINING
             11.10.6 PULP & PAPER
             11.10.7 LEATHER MANUFACTURING
             11.10.8 SKI WAXES
             11.10.9 ELECTROPLATING
                        11.10.10 INKS
                        11.10.11 ADHESIVES

12 SURFACTANTS MARKET BY REGION (Page No. - 93)
     12.1 INTRODUCTION
     12.2 APAC
             12.2.1 CHINA
                        12.2.1.1 Growing demand for high-end products to drive the market
             12.2.2 INDIA
                        12.2.2.1 Rapid urbanization and growth in manufacturing sectors
             12.2.3 JAPAN
                        12.2.3.1 Growing consumption of anionic and non-ionic surfactants
             12.2.4 REST OF APAC
     12.3 NORTH AMERICA
             12.3.1 US
                        12.3.1.1 Stringent regulatory environment to drive the market
             12.3.2 CANADA
                        12.3.2.1 Increasing population and growing demand for bio-based surfactants
             12.3.3 MEXICO
                        12.3.3.1 Growing population and increasing disposable income to drive the surfactants market in the country
     12.4 EUROPE
             12.4.1 GERMANY
                        12.4.1.1 Increasing awareness about low VOC and natural products
             12.4.2 ITALY
                        12.4.2.1 Established food processing personal care and home care sectors
             12.4.3 FRANCE
                        12.4.3.1 Growth in industrial activities
             12.4.4 SPAIN
                        12.4.4.1 Growth in the automotive and food processing sectors
             12.4.5 UK
                        12.4.5.1 Growing personal care and home care applications
             12.4.6 NETHERLANDS
                        12.4.6.1 Lower unemployment rate and higher disposable income to drive market
             12.4.7 POLAND
                        12.4.7.1 Increasing purchasing power of consumers to drive the market
             12.4.8 REST OF EUROPE
     12.5 MIDDLE EAST & AFRICA
             12.5.1 EGYPT
                        12.5.1.1 Growth in agriculture oil textile and personal care sectors
             12.5.2 UAE
                        12.5.2.1 Growth in the population and personal care sector
             12.5.3 SOUTH AFRICA
                        12.5.3.1 Cheap labor and raw material cost drive the market
             12.5.4 SAUDI ARABIA
                        12.5.4.1 Growing demand from oilfield chemicals
             12.5.5 REST OF MIDDLE EAST & AFRICA
     12.6 SOUTH AMERICA
             12.6.1 BRAZIL
                        12.6.1.1 Growing personal care mining and agriculture sectors
             12.6.2 ARGENTINA
                        12.6.2.1 Growing population to drive the surfactants market
             12.6.3 REST OF SOUTH AMERICA

13 COMPETITIVE LANDSCAPE (Page No. - 127)
     13.1 OVERVIEW
     13.2 COMPETITIVE LEADERSHIP MAPPING 2019 (LEADING PLAYERS)
             13.2.1 VISIONARY LEADERS
             13.2.2 INNOVATORS
     13.3 STRENGTH OF PRODUCT PORTFOLIO
     13.4 BUSINESS STRATEGY EXCELLENCE
     13.5 COMPETITIVE LEADERSHIP MAPPING 2019 (OTHER PLAYERS)
             13.5.1 PROGRESSIVE COMPANIES
             13.5.2 RESPONSIVE COMPANIES
             13.5.3 STARTING BLOCKS
     13.6 STRENGTH OF PRODUCT PORTFOLIO
     13.7 BUSINESS STRATEGY EXCELLENCE
     13.8 MARKET SHARE OF SURFACTANT MANUFACTURERS
     13.9 COMPETITIVE SITUATION AND TRENDS
             13.9.1 NEW PRODUCT LAUNCH
             13.9.2 INNOVATION
             13.9.3 EXPANSION
             13.9.4 PARTNERSHIP & AGREEMENT
             13.9.5 ACQUISITION
             13.9.6 OTHER DEVELOPMENTS

14 COMPANY PROFILES (Page No. - 141)
(Business Overview Products Offered Recent Developments Winning Imperatives Current Focus and Strategies Threat from Competition Right to Win)*
     14.1 BASF SE
     14.2 NOURYON
     14.3 EVONIK INDUSTRIES AG
     14.4 STEPAN COMPANY
     14.5 SOLVAY
     14.6 THE DOW CHEMICAL COMPANY
     14.7 INDORAMA VENTURES PUBLIC COMPANY LIMITED
     14.8 CLARIANT
     14.9 ASHLAND GLOBAL HOLDINGS INC.
     14.10 KAO CORPORATION
     14.11 LONZA
     14.12 CRODA INTERNATIONAL PLC
     14.13 ADDITIONAL PLAYERS
             14.13.1 AARTI INDUSTRIES LIMITED
             14.13.2 ADEKA CORPORATION
             14.13.3 AK CHEMTECH CO. LTD.
             14.13.4 ALZO INTERNATIONAL INC.
             14.13.5 ARKEMA GROUP
             14.13.6 BAYER AG
             14.13.7 CARGILL INCORPORATED
             14.13.8 CEPSA
             14.13.9 COLONIAL CHEMICAL INC.
             14.13.10 EOC GROUP
             14.13.11 ENASPOL A.S.
             14.13.12 GALAXY SURFACTANTS LTD.
             14.13.13 INNOSPEC
             14.13.14 KLK OLEO
             14.13.15 LANKEM
             14.13.16 OXITENO
             14.13.17 PCC GROUP
             14.13.18 PILOT CHEMICAL CORP.
             14.13.19 RELIANCE INDUSTRIES LIMITED
             14.13.20 SANYO CHEMICAL LTD.
             14.13.21 SASOL
             14.13.22 SIALCO MATERIALS LTD.
             14.13.23 SUMITOMO CHEMICAL CO. LTD.
             14.13.24 TAIWAN NJC CORPORATION. LTD.
             14.13.25 THE LUBRIZOL CORPORATION
             14.13.26 TOKYO CHEMICAL INDUSTRY CO. LTD.
             14.13.27 3M
             14.13.28 UNGER FABRIKKER AS

*Details on Business Overview Products Offered Recent Developments Winning Imperatives Current Focus and Strategies Threat from Competition Right to Win might not be captured in case of unlisted companies.

15 APPENDIX (Page No. - 177)
     15.1 DISCUSSION GUIDE
     15.2 KNOWLEDGE STORE: MARKETSANDMARKETS SUBSCRIPTION PORTAL
     15.3 AVAILABLE CUSTOMIZATIONS
     15.4 RELATED REPORTS
     15.5 AUTHOR DETAILS


LIST OF TABLES (128 FIGURES)

TABLE 1 AVERAGE SELLING PRICE RANGE BY REGION 2018 (USD PER TON)
TABLE 2 SOME OF THE TECHNOLOGICAL DEVELOPMENTS IN THE SURFACTANTS MARKET
TABLE 3 SOME OF THE PATENTS IN THE SURFACTANT MARKET
TABLE 4 TRENDS AND FORECAST OF REAL GDP BY MAJOR ECONOMY ANNUAL PERCENTAGE CHANGE 2019–2021
TABLE 5 IMPORT OF ANIONIC SURFACTANTS BY REGION 2015–2018 (KILOTON)
TABLE 6 APAC: IMPORT OF ANIONIC SURFACTANTS BY COUNTRY 2015–2018 (KILOTON)
TABLE 7 NORTH AMERICA: IMPORT OF ANIONIC SURFACTANTS BY COUNTRY 2015–2018 (KILOTON)
TABLE 8 EUROPE: IMPORT OF ANIONIC SURFACTANTS BY COUNTRY 2015–2018 (KILOTON)
TABLE 9 MIDDLE EAST & AFRICA: IMPORT OF ANIONIC SURFACTANTS BY COUNTRY 2015–2018 (KILOTON)
TABLE 10 SOUTH AMERICA: IMPORT OF ANIONIC SURFACTANTS BY COUNTRY 2015–2018 (KILOTON)
TABLE 11 EXPORT OF ANIONIC SURFACTANTS BY REGION 2015–2018 (KILOTON)
TABLE 12 APAC: EXPORT OF ANIONIC SURFACTANTS BY COUNTRY 2015–2018 (KILOTON)
TABLE 13 NORTH AMERICA: EXPORT OF ANIONIC SURFACTANTS BY COUNTRY 2015–2018 (KILOTON)
TABLE 14 EUROPE: EXPORT OF ANIONIC SURFACTANTS BY COUNTRY 2015–2018 (KILOTON)
TABLE 15 MIDDLE EAST & AFRICA: EXPORT OF ANIONIC SURFACTANTS BY COUNTRY 2015–2018 (KILOTON)
TABLE 16 SOUTH AMERICA: EXPORT OF ANIONIC SURFACTANTS BY COUNTRY 2015–2018 (KILOTON)
TABLE 17 IMPORT OF NON-IONIC SURFACTANTS BY REGION 2015–2018 (KILOTON)
TABLE 18 APAC: IMPORT OF NON-IONIC SURFACTANTS BY COUNTRY 2015–2018 (KILOTON)
TABLE 19 NORTH AMERICA: IMPORT OF NON-IONIC SURFACTANTS BY COUNTRY 2015–2018 (KILOTON)
TABLE 20 EUROPE: IMPORT OF NON-IONIC SURFACTANTS BY COUNTRY 2015–2018 (KILOTON)
TABLE 21 MIDDLE EAST & AFRICA: IMPORT OF NON-IONIC SURFACTANTS BY COUNTRY 2015–2018 (KILOTON)
TABLE 22 SOUTH AMERICA: IMPORT OF NON-IONIC SURFACTANTS BY COUNTRY 2015–2018 (KILOTON)
TABLE 23 EXPORT OF NON-IONIC SURFACTANTS BY REGION 2015–2018 (KILOTON)
TABLE 24 APAC: EXPORT OF NON-IONIC SURFACTANTS BY COUNTRY 2015–2018 (KILOTON)
TABLE 25 NORTH AMERICA: EXPORT OF NON-IONIC SURFACTANTS BY COUNTRY 2015–2018 (KILOTON)
TABLE 26 EUROPE: EXPORT OF NON-IONIC SURFACTANTS BY COUNTRY 2015–2018 (KILOTON)
TABLE 27 MIDDLE EAST & AFRICA: EXPORT OF NON-IONIC SURFACTANTS BY COUNTRY 2015–2018 (KILOTON)
TABLE 28 SOUTH AMERICA: EXPORT OF NON-IONIC SURFACTANTS BY COUNTRY 2015–2018 (KILOTON)
TABLE 29 IMPORT OF CATIONIC SURFACTANTS BY REGION 2015–2018 (KILOTON)
TABLE 30 APAC: IMPORT OF CATIONIC SURFACTANTS BY COUNTRY 2015–2018 (KILOTON)
TABLE 31 NORTH AMERICA: IMPORT OF CATIONIC SURFACTANTS BY COUNTRY 2015–2018 (KILOTON)
TABLE 32 EUROPE: IMPORT OF CATIONIC SURFACTANTS BY COUNTRY 2015–2018 (KILOTON)
TABLE 33 MIDDLE EAST & AFRICA: IMPORT OF CATIONIC SURFACTANTS BY COUNTRY 2015–2018 (KILOTON)
TABLE 34 SOUTH AMERICA: IMPORT OF CATIONIC SURFACTANTS BY COUNTRY 2015–2018 (KILOTON)
TABLE 35 EXPORT OF CATIONIC SURFACTANTS BY REGION 2015–2018 (KILOTON)
TABLE 36 APAC: EXPORT OF CATIONIC SURFACTANTS BY COUNTRY 2015–2018 (KILOTON)
TABLE 37 NORTH AMERICA: EXPORT OF CATIONIC SURFACTANTS BY COUNTRY 2015–2018 (KILOTON)
TABLE 38 EUROPE: EXPORT OF CATIONIC SURFACTANTS BY COUNTRY 2015–2018 (KILOTON)
TABLE 39 MIDDLE EAST & AFRICA: EXPORT OF CATIONIC SURFACTANTS BY COUNTRY 2015–2018 (KILOTON)
TABLE 40 SOUTH AMERICA: EXPORT OF CATIONIC SURFACTANTS BY COUNTRY 2015–2018 (KILOTON)
TABLE 41 SURFACTANTS: PRODUCT TYPES
TABLE 42 SURFACTANTS MARKET SIZE BY TYPE 2018–2025 (KILOTON)
TABLE 43 SURFACTANT MARKET SIZE BY TYPE 2018–2025 (USD MILLION)
TABLE 44 ANIONIC SURFACTANTS MARKET SIZE BY REGION 2018–2025 (KILOTON)
TABLE 45 ANIONIC SURFACTANT MARKET SIZE BY REGION 2018–2025 (USD MILLION)
TABLE 46 NON-IONIC SURFACTANTS MARKET SIZE BY REGION 2018–2025 (KILOTON)
TABLE 47 NON-IONIC SURFACTANT MARKET SIZE BY REGION 2018–2025 (USD MILLION)
TABLE 48 CATIONIC SURFACTANTS MARKET SIZE BY REGION 2018–2025 (KILOTON)
TABLE 49 CATIONIC SURFACTANT MARKET SIZE BY REGION 2018–2025 (USD MILLION)
TABLE 50 AMPHOTERIC SURFACTANTS MARKET SIZE BY REGION 2018–2025 (KILOTON)
TABLE 51 AMPHOTERIC SURFACTANT MARKET SIZE BY REGION 2018–2025 (USD MILLION)
TABLE 52 SURFACTANTS: BREAKDOWN BY APPLICATION
TABLE 53 SURFACTANTS MARKET SIZE BY APPLICATION 2018–2025 (KILOTON)
TABLE 54 SURFACTANT MARKET SIZE BY APPLICATION 2018–2025 (USD MILLION)
TABLE 55 SURFACTANTS MARKET SIZE BY REGION 2018–2025 (KILOTON)
TABLE 56 SURFACTANT MARKET SIZE BY REGION 2018–2025 (USD MILLION)
TABLE 57 APAC: SURFACTANTS MARKET SIZE BY COUNTRY 2018–2025 (KILOTON)
TABLE 58 APAC: MARKET SIZE BY COUNTRY 2018–2025 (USD MILLION)
TABLE 59 APAC: MARKET SIZE BY TYPE 2018–2025 (KILOTON)
TABLE 60 APAC: MARKET SIZE BY TYPE 2018–2025 (USD MILLION)
TABLE 61 CHINA: SURFACTANT MARKET SIZE BY TYPE 2018–2025 (KILOTON)
TABLE 62 CHINA: MARKET SIZE BY TYPE 2018–2025 (USD MILLION)
TABLE 63 INDIA: SURFACTANTS MARKET SIZE BY TYPE 2018-2025 (KILOTON)
TABLE 64 INDIA: MARKET SIZE BY TYPE 2018–2025 (USD MILLION)
TABLE 65 JAPAN: SURFACTANT MARKET SIZE BY TYPE 2018–2025 (KILOTON)
TABLE 66 JAPAN: MARKET SIZE BY TYPE 2018–2025 (USD MILLION)
TABLE 67 REST OF APAC: SURFACTANT MARKET SIZE BY TYPE 2018–2025 (KILOTON)
TABLE 68 REST OF APAC: MARKET SIZE BY TYPE 2018–2025 (USD MILLION)
TABLE 69 NORTH AMERICA: SURFACTANTS MARKET SIZE BY COUNTRY 2018–2025 (KILOTON)
TABLE 70 NORTH AMERICA: MARKET SIZE BY COUNTRY 2018–2025 (USD MILLION)
TABLE 71 NORTH AMERICA: MARKET SIZE BY TYPE 2018–2025 (KILOTON)
TABLE 72 NORTH AMERICA: MARKET SIZE BY TYPE 2018–2025 (USD MILLION)
TABLE 73 US: SURFACTANTS MARKET SIZE BY TYPE 2018–2025 (KILOTON)
TABLE 74 US: MARKET SIZE BY TYPE 2018–2025 (USD MILLION)
TABLE 75 CANADA: SURFACTANT MARKET SIZE BY TYPE 2018–2025 (KILOTON)
TABLE 76 CANADA: MARKET SIZE BY TYPE 2018–2025 (USD MILLION)
TABLE 77 MEXICO: SURFACTANTS MARKET SIZE BY TYPE 2018–2025 (KILOTON)
TABLE 78 MEXICO: MARKET SIZE BY TYPE 2018–2025 (USD MILLION)
TABLE 79 EUROPE: SURFACTANT MARKET SIZE BY COUNTRY 2018–2025 (KILOTON)
TABLE 80 EUROPE: MARKET SIZE BY COUNTRY 2018–2025 (USD MILLION)
TABLE 81 EUROPE: MARKET SIZE BY TYPE 2018–2025 (KILOTON)
TABLE 82 EUROPE: MARKET SIZE BY TYPE 2018–2025 (USD MILLION)
TABLE 83 GERMANY: SURFACTANTS MARKET SIZE BY TYPE 2018–2025 (KILOTON)
TABLE 84 GERMANY: MARKET SIZE BY TYPE 2018–2025 (USD MILLION)
TABLE 85 ITALY: SURFACTANT MARKET SIZE BY TYPE 2018–2025 (KILOTON)
TABLE 86 ITALY: MARKET SIZE BY TYPE 2018–2025 (USD MILLION)
TABLE 87 FRANCE: SURFACTANTS MARKET SIZE BY TYPE 2018–2025 (KILOTON)
TABLE 88 FRANCE: MARKET SIZE BY TYPE 2018–2025 (USD MILLION)
TABLE 89 SPAIN: SURFACTANT MARKET SIZE BY TYPE 2018–2025 (KILOTON)
TABLE 90 SPAIN: MARKET SIZE BY TYPE 2018–2025 (USD MILLION)
TABLE 91 UK: SURFACTANTS MARKET SIZE BY TYPE 2018–2025 (KILOTON)
TABLE 92 UK: MARKET SIZE BY TYPE 2018–2025 (USD MILLION)
TABLE 93 NETHERLANDS: SURFACTANT MARKET SIZE BY TYPE 2018–2025 (KILOTON)
TABLE 94 NETHERLANDS: MARKET SIZE BY TYPE 2018–2025 (USD MILLION)
TABLE 95 POLAND: SURFACTANTS MARKET SIZE BY TYPE 2018–2025 (KILOTON)
TABLE 96 POLAND: MARKET SIZE BY TYPE 2018–2025 (USD MILLION)
TABLE 97 REST OF EUROPE: SURFACTANT MARKET SIZE BY TYPE 2018–2025 (KILOTON)
TABLE 98 REST OF EUROPE: MARKET SIZE BY TYPE 2018–2025 (USD MILLION)
TABLE 99 MIDDLE EAST & AFRICA: SURFACTANTS MARKET SIZE BY COUNTRY 2018–2025 (KILOTON)
TABLE 100 MIDDLE EAST & AFRICA: MARKET SIZE BY COUNTRY 2018–2025 (USD MILLION)
TABLE 101 MIDDLE EAST & AFRICA: MARKET SIZE BY TYPE 2018–2025 (KILOTON)
TABLE 102 MIDDLE EAST & AFRICA: MARKET SIZE BY TYPE 2018–2025 (USD MILLION)
TABLE 103 EGYPT: SURFACTANT MARKET SIZE BY TYPE 2018–2025 (KILOTON)
TABLE 104 EGYPT: MARKET SIZE BY TYPE 2018–2025 (USD MILLION)
TABLE 105 UAE: SURFACTANTS MARKET SIZE BY TYPE 2018–2025 (KILOTON)
TABLE 106 UAE: MARKET SIZE BY TYPE 2018–2025 (USD MILLION)
TABLE 107 SOUTH AFRICA: SURFACTANT MARKET SIZE BY TYPE 2018–2025 (KILOTON)
TABLE 108 SOUTH AFRICA: MARKET SIZE BY TYPE 2018–2025 (USD MILLION)
TABLE 109 SAUDI ARABIA: SURFACTANTS MARKET SIZE BY TYPE 2018–2025 (KILOTON)
TABLE 110 SAUDI ARABIA: MARKET SIZE BY TYPE 2018–2025 (USD MILLION)
TABLE 111 REST OF MIDDLE EAST & AFRICA: SURFACTANT MARKET SIZE BY TYPE 2018–2025 (KILOTON)
TABLE 112 REST OF MIDDLE EAST & AFRICA: MARKET SIZE BY TYPE 2018–2025 (USD MILLION)
TABLE 113 SOUTH AMERICA: SURFACTANTS MARKET SIZE BY COUNTRY 2018–2025 (KILOTON)
TABLE 114 SOUTH AMERICA: MARKET SIZE BY COUNTRY 2018–2025 (USD MILLION)
TABLE 115 SOUTH AMERICA: MARKET SIZE BY TYPE 2018–2025 (KILOTON)
TABLE 116 SOUTH AMERICA: MARKET SIZE BY TYPE 2018–2025 (USD MILLION)
TABLE 117 BRAZIL: SURFACTANT MARKET SIZE BY TYPE 2018–2025 (KILOTON)
TABLE 118 BRAZIL: MARKET SIZE BY TYPE 2018–2025 (USD MILLION)
TABLE 119 ARGENTINA: SURFACTANTS MARKET SIZE BY TYPE 2018–2025 (KILOTON)
TABLE 120 ARGENTINA: MARKET SIZE BY TYPE 2018–2025 (USD MILLION)
TABLE 121 REST OF SOUTH AMERICA: SURFACTANT MARKET SIZE BY TYPE 2018–2025 (KILOTON)
TABLE 122 REST OF SOUTH AMERICA: MARKET SIZE BY TYPE 2018–2025 (USD MILLION)
TABLE 123 NEW PRODUCT LAUNCH 2018–2020
TABLE 124 INNOVATION 2018–2020
TABLE 125 EXPANSION 2018–2020
TABLE 126 PARTNERSHIP & AGREEMENT 2018–2020
TABLE 127 ACQUISITION 2018–2020
TABLE 128 OTHER DEVELOPMENTS 2018–2020


LIST OF FIGURES (53 FIGURES)

FIGURE 1 SURFACTANTS: MARKET SEGMENTATION
FIGURE 2 SURFACTANTS MARKET: RESEARCH DESIGN
FIGURE 3 MARKET SIZE ESTIMATION: BOTTOM-UP APPROACH
FIGURE 4 MARKET SIZE ESTIMATION: TOP-DOWN APPROACH
FIGURE 5 SURFACTANT MARKET: BASE NUMBER CALCULATION APPROACH 1
FIGURE 6 SURFACTANTS MARKET: BASE NUMBER CALCULATION APPROACH 2
FIGURE 7 SURFACTANT MARKET FORECAST CALCULATION METHODOLOGY
FIGURE 8 SURFACTANTS MARKET CALCULATION: BY APPLICATION
FIGURE 9 SURFACTANT MARKET: DATA TRIANGULATION
FIGURE 10 SURFACTANTS MARKET TO GROW AT A MODERATE RATE IN THE REALISTIC SCENARIO
FIGURE 11 ANIONIC SURFACTANTS ACCOUNTED FOR THE LARGEST SHARE OF THE SURFACTANTS MARKET IN 2019
FIGURE 12 AGROCHEMICALS TO BE FASTEST-GROWING APPLICATION OF SURFACTANTS BETWEEN 2020 AND 2025
FIGURE 13 APAC TO BE THE FASTEST-GROWING REGION IN THE SURFACTANT MARKET
FIGURE 14 INCREASING DEMAND FROM APAC TO DRIVE THE GLOBAL SURFACTANTS MARKET
FIGURE 15 APAC TO BE FASTEST-GROWING MARKET FOR SURFACTANTS
FIGURE 16 ANIONIC SURFACTANTS WAS THE LARGEST TYPE IN 2019
FIGURE 17 CHINA ACCOUNTED FOR THE LARGEST SHARE OF THE SURFACTANTS MARKET IN APAC
FIGURE 18 INDIA TO GROW AT THE HIGHEST RATE DURING THE FORECAST PERIOD
FIGURE 19 DRIVERS RESTRAINTS CHALLENGES AND OPPORTUNITIES IN THE SURFACTANT MARKET
FIGURE 20 SUPPLY CHAIN ANALYSIS FOR THE SURFACTANTS MARKET
FIGURE 21 PORTER’S FIVE FORCES ANALYSIS
FIGURE 22 ANIONIC SURFACTANTS TO LEAD THE SURFACTANT MARKET DURING THE FORECAST PERIOD
FIGURE 23 HOME CARE SEGMENT TO LEAD THE SURFACTANTS MARKET DURING THE FORECAST PERIOD
FIGURE 24 APAC TO REGISTER THE HIGHEST CAGR DURING THE FORECAST PERIOD
FIGURE 25 APAC: SURFACTANT MARKET SNAPSHOT
FIGURE 26 NORTH AMERICA: SURFACTANTS MARKET SNAPSHOT
FIGURE 27 EUROPE: SURFACTANT MARKET SNAPSHOT
FIGURE 28 SURFACTANTS MARKET: COMPETITIVE LEADERSHIP MAPPING 2019
FIGURE 29 PRODUCT PORTFOLIO ANALYSIS OF TOP PLAYERS IN THE SURFACTANTS MARKET
FIGURE 30 BUSINESS STRATEGY EXCELLENCE OF TOP PLAYERS IN THE SURFACTANT MARKET
FIGURE 31 SURFACTANTS MARKET: COMPETITIVE LEADERSHIP MAPPING 2019 (OTHER PLAYERS)
FIGURE 32 PRODUCT PORTFOLIO ANALYSIS OF TOP PLAYERS IN SURFACTANTS MARKET
FIGURE 33 BUSINESS STRATEGY EXCELLENCE OF TOP PLAYERS IN THE SURFACTANT MARKET
FIGURE 34 NEW PRODUCT LAUNCH WAS THE KEY GROWTH STRATEGY ADOPTED BY THE MARKET PLAYERS BETWEEN 2018 AND 2020
FIGURE 35 MARKET SHARE ANALYSIS IN 2019
FIGURE 36 BASF SE: COMPANY SNAPSHOT
FIGURE 37 BASF SE: WINNING IMPERATIVES
FIGURE 38 NOURYON: COMPANY SNAPSHOT
FIGURE 39 NOURYON: WINNING IMPERATIVES
FIGURE 40 EVONIK INDUSTRIES AG: COMPANY SNAPSHOT
FIGURE 41 EVONIK INDUSTRIES AG: WINNING IMPERATIVES
FIGURE 42 STEPAN COMPANY: COMPANY SNAPSHOT
FIGURE 43 STEPAN COMPANY: WINNING IMPERATIVES
FIGURE 44 SOLVAY: COMPANY SNAPSHOT
FIGURE 45 SOLVAY: WINNING IMPERATIVES
FIGURE 46 THE DOW CHEMICAL COMPANY: COMPANY SNAPSHOT
FIGURE 47 THE DOW CHEMICAL COMPANY: WINNING IMPERATIVES
FIGURE 48 INDORAMA VENTURES PUBLIC COMPANY LIMITED: COMPANY SNAPSHOT
FIGURE 49 CLARIANT: COMPANY SNAPSHOT
FIGURE 50 ASHLAND GLOBAL HOLDINGS INC.: COMPANY SNAPSHOT
FIGURE 51 KAO CORPORATION: COMPANY SNAPSHOT
FIGURE 52 LONZA: COMPANY SNAPSHOT
FIGURE 53 CRODA INTERNATIONAL PLC: COMPANY SNAPSHOT

The study involved four major activities in estimating the market size for surfactants. Exhaustive secondary research was done to collect information on the market, the peer market, and the parent market. The next step was to validate these findings, assumptions, and sizing with industry experts across the value chain through primary research. Both top-down and bottom-up approaches were employed to estimate the complete market size. Post that, the market breakdown and data triangulation procedures were used to estimate the market size of the segments and subsegments.

Secondary Research

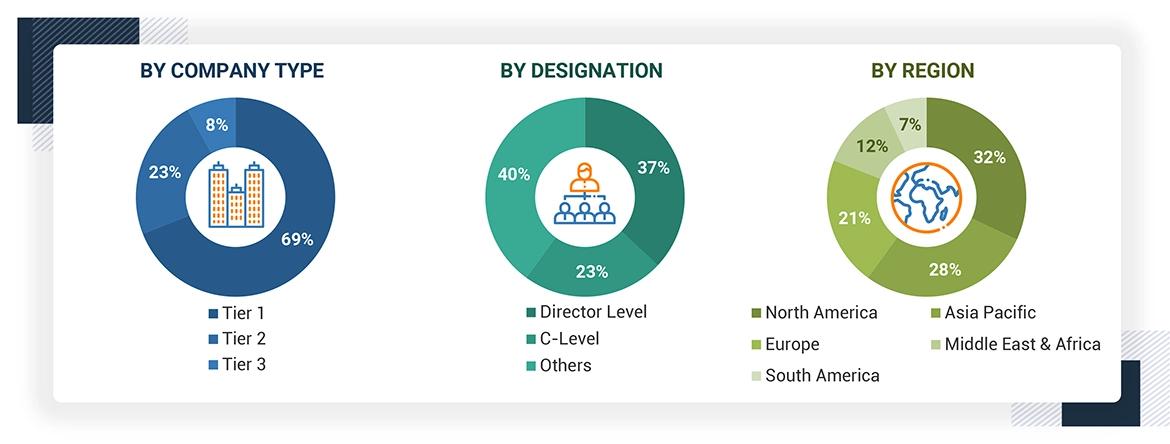
Secondary sources used in this study included annual reports, press releases, and investor presentations of companies; white papers; certified publications; articles from recognized authors; and gold standard & silver standard websites such as Factiva, ICIS, Bloomberg, and others. Findings of this study were verified through primary research by conducting extensive interviews with key officials such as CEOs, VPs, directors, and other executives.

Primary Research

The surfactants market comprises several stakeholders, such as raw material suppliers, end-product manufacturers, and regulatory organizations in the supply chain. The demand side of this market is characterized by the companies which are into the manufacturing of home care, personal care, agrochemicals, and food & beverage, among others. The supply side is characterized by advancements in technology. Various primary sources from both the supply and demand sides of the market were interviewed to obtain qualitative and quantitative information.
Surfactants Market Size, and Share

To know about the assumptions considered for the study, download the pdf brochure

Market Size Estimation

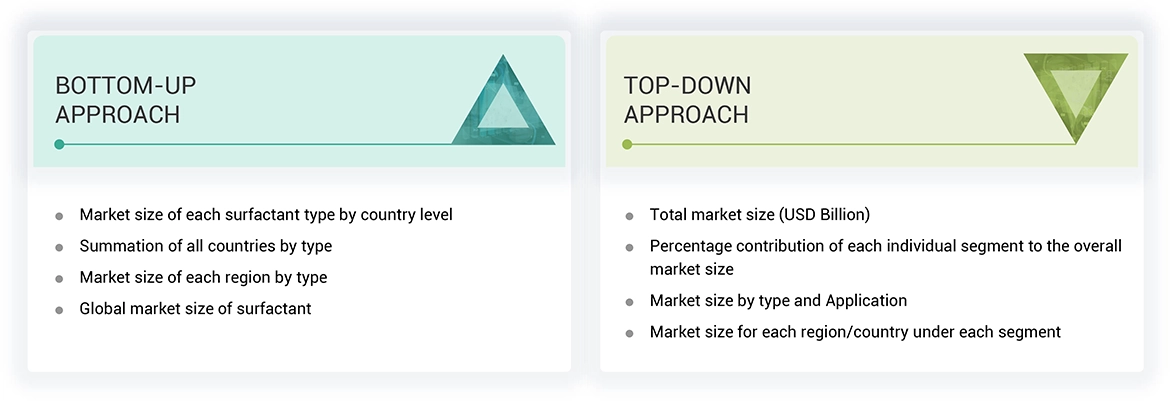
Both the top-down and bottom-up approaches were used to estimate and validate the total size of the surfactants market. These methods were also used extensively to estimate the size of various subsegments in the market. The research methodology used to estimate the market size includes the following:

The key players in the industry were identified through extensive secondary research.

  • The industry’s supply chain and market size, in terms of value, were determined through primary and secondary research processes.
  • All percentage shares, splits, and breakdowns were determined using secondary sources and verified through primary sources.

Data Triangulation

After arriving at the overall market size—using the market size estimation processes as explained above—the market was split into several segments and subsegments. To complete the overall market engineering process and arrive at the exact statistics of each market segment and subsegment, the data triangulation and market breakdown procedures were employed, wherever applicable. The data was triangulated by studying various factors and trends from both the demand and supply sides.

Report Objectives

  • To analyze and forecast the size of the global surfactants market in terms of value and volume
  • To provide detailed information regarding the major factors (drivers, restraints, opportunities, and challenges) influencing the growth of the market
  • To define, describe, and forecast the global surfactants market on the basis of type, application, and region
  • To forecast the market size of different segments based on regions: Asia Pacific (APAC), Europe, North America, the Middle East & Africa, and South America, along with their key countries
  • To strategically analyze micromarkets with respect to individual growth trends, growth prospects, and their contribution to the overall market
  • To analyze the opportunities in the market for stakeholders by identifying the high-growth segments of the market
  • To track and analyze competitive developments such as new product launch, expansion, acquisition, partnership & agreement, and innovation in the surfactants market
  • To strategically profile the key players and comprehensively analyze their core competencies

Available Customizations

Along with the given market data, MarketsandMarkets offers customizations according to the company’s specific needs. The following customization options are available for the report:

Regional Analysis

  • Further breakdown of a region with respect to a particular country or type

Company Information

  • Detailed analysis and profiles of additional market players (up to five)
Report Code
CH 3464
Published ON
Jun, 2020
Choose License Type
BUY NOW
  • SHARE
X
Request Customization
Speak to Analyst
Speak to Analyst
OR FACE-TO-FACE MEETING
PERSONALIZE THIS RESEARCH
  • Triangulate with your Own Data
  • Get Data as per your Format and Definition
  • Gain a Deeper Dive on a Specific Application, Geography, Customer or Competitor
  • Any level of Personalization
REQUEST A FREE CUSTOMIZATION
LET US HELP YOU!
  • What are the Known and Unknown Adjacencies Impacting the Surfactants Market
  • What will your New Revenue Sources be?
  • Who will be your Top Customer; what will make them switch?
  • Defend your Market Share or Win Competitors
  • Get a Scorecard for Target Partners
CUSTOMIZED WORKSHOP REQUEST
+1-888-600-6441
  • Call Us
  • +1-888-600-6441 (Corporate office hours)
  • +1-888-600-6441 (US/Can toll free)
  • +44-800-368-9399 (UK office hours)
CONNECT WITH US
ABOUT TRUST ONLINE
©2023 MarketsandMarkets Research Private Ltd. All rights reserved
DMCA.com Protection Status Website Feedback