
Polylactic Acid Market

Polylactic Acid Market by Grade (Thermoforming Grade, Injection Molding Grade, Extrusion Grade, Blow Molding Grade), Application (Rigid Thermoforms, Films & Sheets, Bottles), End-use Industry (Packaging, Consumer Goods, Agricultural, Textile, Bio-Medical), Raw Material (Sugarcane, Corn starch, Cassava, Sugarbeet), and Region - Global Forecast to 2030
Updated on : December 11, 2025


POLYLACTIC ACID MARKET
Source: Secondary Research, Interviews with Experts, MarketsandMarkets Analysis
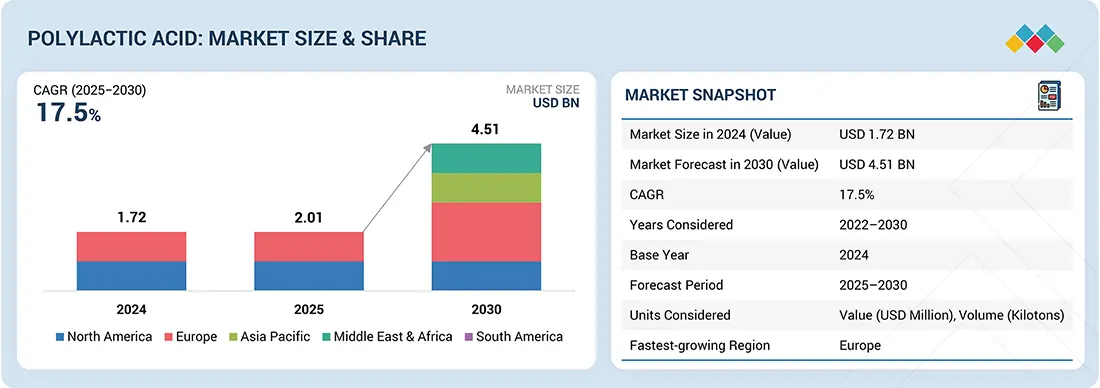
The polylactic acid market was valued at USD 2.01 billion in 2025 and is projected to reach USD 4.51 billion by 2030, growing at 17.5% cagr from 2025 to 2030. The market is becoming saturated, driven by the growing demand for sustainable and biodegradable alternatives to conventional plastics. PLA is increasingly found across packaging, textiles, agriculture, automotive, and medical applications, as it is compostable, transparent, and versatile in processing. Some drivers of growth for the PLA market are increased government action against single-use plastics, increased consumer demand for eco-friendly products, technological advancements in high-heat and durable grades of PLA, and greater implementation of 3D printing applications.
KEY TAKEAWAYS
-
BY RAW MATERIALRaw materials for PLA include renewable sources such as sugarcane, corn starch, cassava, and sugar beet. Each raw material source has unique benefits in terms of availability, cost efficiency, carbon footprint, and processing ease, making them well-suited for large-scale PLA production.
-
BY GRADEThere are several grades for processing through thermoforming, injection molding, extrusion, and blow molding. Thermoforming grades are used for rigid packaging, extrusion grades are used for films and sheets, injection molding grades are used for consumer goods and biomedical products, and blow molding grades are identified for bottles and hollow containers.
-
BY APPLICATIONPLA applications include rigid thermoforms, films and sheets, and bottles.
-
BY END USE INDUSTRYEnd-user markets include packaging, consumer goods, agriculture, textiles, and biomedical.
-
BY REGIONThe PLA market is expected to grow the fastest in the Asia Pacific because of the availability of feedstock (corn, sugarcane), government initiatives against single-use plastics, and growing consumer markets. North America and Europe remain strong markets due to technological advancements, sustainability targets, and supportive regulations promoting bioplastics adoption.
-
COMPETITIVE LANDSCAPEThe PLA market is competitive, as businesses implement organic and inorganic growth tactics, including capacity expansions, joint ventures, and acquisitions. Industry leaders, such as NatureWorks LLC, TotalEnergies Corbion, Euterro, Danimer Scientific, and BASF SE, are all increasing production capabilities and investing in advanced grades such as high-heat and durable PLA.
The PLA market is projected to witness robust growth due to mounting global sustainability demands and continuous innovation. PLA is becoming a one-stop material to not only meet the strict environmental standards but also deliver the same quality as traditional plastics. Its selling points are biodegradability, light-weight, and process compatibility, which are the main reasons for its widespread use in packaging, consumer goods, agriculture, textiles, and biomedical.
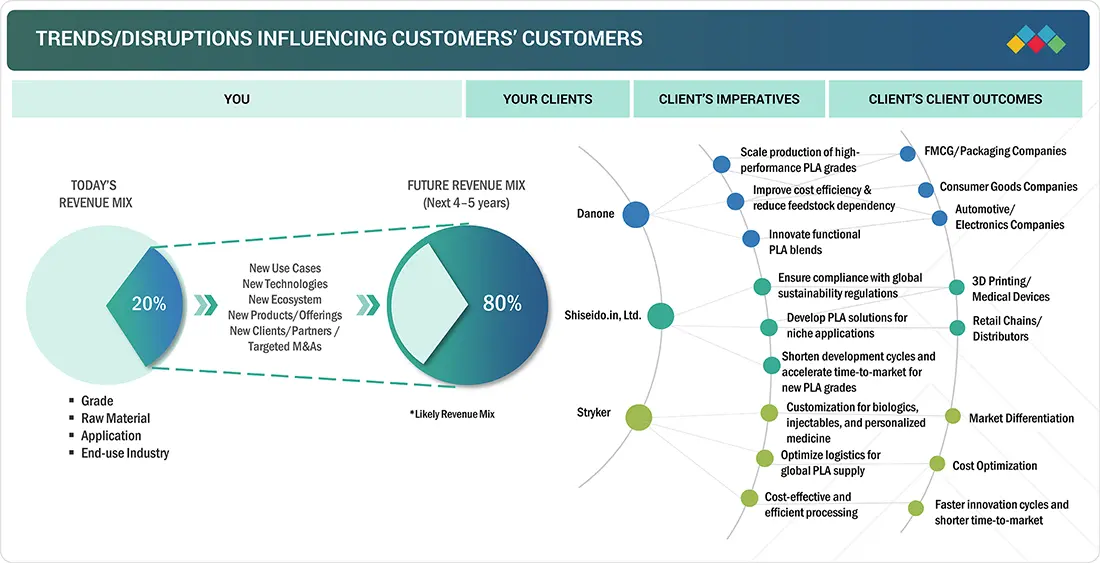
TRENDS & DISRUPTIONS IMPACTING CUSTOMERS' CUSTOMERS
The changes in the PLA sector business are primarily due to changes in consumer preferences and disruptions in the industries that are the main users of this sector. As an illustration, packaging manufacturers, consumer goods producers, agricultural film converters, and biomedical device makers are the main stakeholders of PLA suppliers. The end users are a mix of environmentally friendly consumers and industries implementing sustainable solutions. The demand in those sectors depends a lot on the trends such as the global push for sustainability, the government regulations on single-use plastics, the biopolymer processing technology, and the price competitiveness with conventional plastics. Changes in raw material supply, production capacity, and consumer adoption of eco-friendly products directly impact PLA producers' revenues,, which eventually determine the overall growth and competition of the polylactic acid market.
Source: Secondary Research, Interviews with Experts, MarketsandMarkets Analysis
POLYLACTIC ACID MARKET DYNAMICS
Level
-
Changing consumer preference toward eco-friendly plastic products

-
Increasing use in packaging and compostable bag applications

Level
-
Higher prices of PLA compared to conventional plastics

-
Limited performance in high-temperature and high-impact applications

Level
-
Development of new end-use applications

-
High growth potential in emerging economies of Asia Pacific

Level
-
Lower thermal stability and mechanical performance compared to traditional plastics

-
Competition from other biodegradable or recycled plastics

Source: Secondary Research, Interviews with Experts, MarketsandMarkets Analysis
Driver: Changing consumer preference toward eco-friendly plastic products
Growing consumer awareness of environmental issues and efforts to eliminate non-biodegradable plastics are boosting PLA market growth. Petroleum-based plastics take decades to degrade, often sitting in landfills for long periods. In contrast, PLA decomposes faster when discarded and absorbed into ecosystems. Microorganisms speed up the breakdown of biodegradable plastics compared to traditional plastics. Increased landfills and waste piles pose serious environmental hazards, harming flora and fauna. Consumer awareness of these dangers encourages PLA use. The table below lists the risks of conventional plastics, which drive demand for safer, human-friendly products.
Restraint: Higher prices of polylactic acid than conventional plastics
The PLA market is hindered by higher costs than petrochemical plastics like PE and PP, due to renewable feedstocks, complex fermentation, and polymerization processes. Limited demand and capacity prevent economies of scale, raising per-unit costs and reducing competitiveness, especially in low-margin markets. Consumer and regulatory pressures, technological advances, and increasing production may close the cost gap, allowing PLA to become more competitive and expand into wider markets.
Opportunity: Development of new applications
Growing sustainability initiatives and supportive government policies are opening new markets for polylactic acid (PLA) in industries like electronics, biomedical, and automotive. PLA is expanding beyond niche uses as companies recognize its biocompatibility, biodegradability, and versatility. In medicine, R&D is exploring PLA for entirely biodegradable sutures, screws, implants, and scaffolds. In autos, PLA-starch blends are making lightweight parts for better fuel efficiency, with biobased designs increasingly required. In electronics, PLA materials are being considered for casings and insulated components due to eco-friendly and cost benefits.
Challenge: Lower thermal stability and mechanical performance compared to traditional plastics
PLA's environmental benefits are limited by its inferior mechanical and thermal properties, such as low heat resistance and brittleness, reducing its effectiveness in durable industries like automotive, aerospace, and high-temperature packaging. While blending with other materials can improve these properties, it increases complexity and cost, limiting PLA's market appeal in performance-driven sectors.
Polylactic Acid Market: COMMERCIAL USE CASES ACROSS INDUSTRIES
| COMPANY | USE CASE DESCRIPTION | BENEFITS |
|---|---|---|
 |
Developed Ingeo PLA biopolymers are used widely in food packaging, 3D printing, fibers for textiles, and nonwovens (personal care, hygiene) | Enabled compostable, bio-based packaging; reduced landfill waste; improved material clarity; used in medical implants and 3D-printed devices |
 |
Launched Luminy PLA grades for rigid thermoformed packaging, compostable straws/cups, single-use food service ware; works with PHA for sustainable biomaterial blends in China | Delivered fully recyclable, compostable solutions for food packaging, cutlery, and promoted circular plastics in large-scale manufacturing |
 |
Developed a full-cycle PLA biorefinery for both PLA production and chemical recycling; serves packaging, textiles, and consumer goods | Achieved reduced carbon footprint, promoted circular economy via recycling, and advanced high-quality PLA for major brands |
 |
Developed PHA/PLA blends for marine-degradable packaging, films, and coatings for food and beverage sector | Created rapidly degradable bioplastics for ocean-safe, single-use items, supporting regulatory compliance in global markets |
Logos and trademarks shown above are the property of their respective owners. Their use here is for informational and illustrative purposes only.
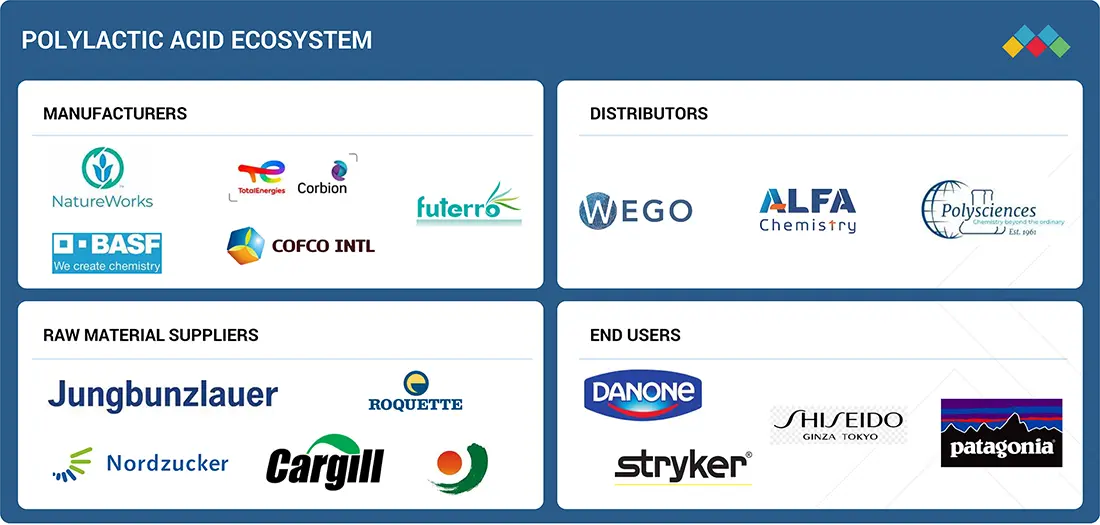
POLYLACTIC ACID MARKET ECOSYSTEM
The PLA ecosystem includes raw material suppliers, PLA manufacturers, distributors, and end users. Suppliers provide biomass feedstocks like corn starch, sugarcane, cassava, and sugar beet, which are fermented to produce lactic acid, the key monomer in PLA. Now, fermenters also process non-food biomass and promote diverse feedstocks. Distributors handle logistics, storage, and global distribution of PLA resins or clumps, offering downstream converters access to regional markets, packaging mandates, traceability, and sustainability documentation. End users span industries such as packaging, agriculture, 3D printing, textiles, automotive, and medical devices.
Logos and trademarks shown above are the property of their respective owners. Their use here is for informational and illustrative purposes only.
POLYLACTIC ACID MARKET SEGMENTS
Source: Secondary Research, Interviews with Experts, MarketsandMarkets Analysis
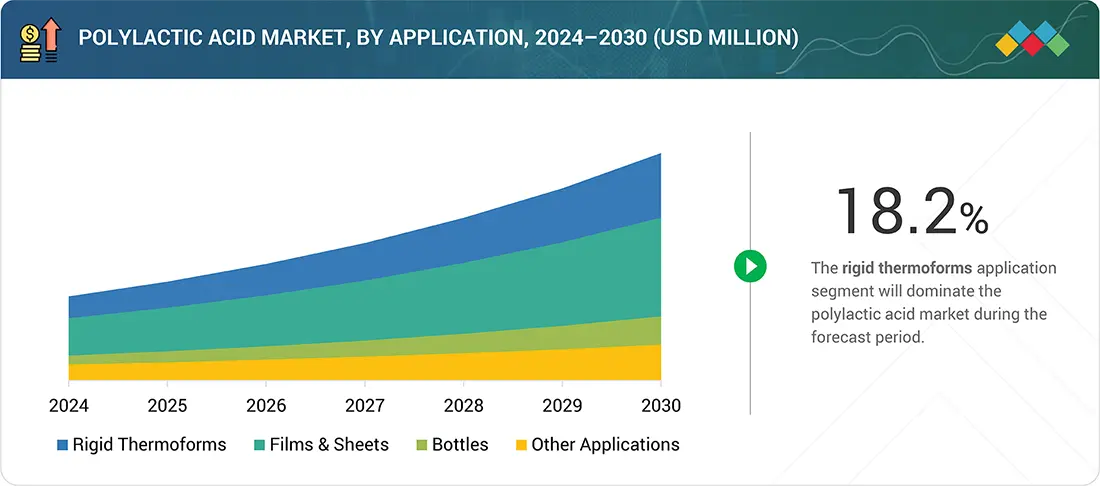
Polylactic Acid Market, By Application
Rigid thermoforms are expected to see the fastest growth in PLA use, mainly in disposable food service, electronics, and medical packaging. PLA thermoformed trays, clamshells, and blister packs offer strength and environmental benefits over petroleum plastics. Their ease of customization and production suitability make them attractive for large-scale use. As industries adopt sustainable packaging, PLA thermoforms stand out due to their lightness, durability, and compostability. They also meet legal and consumer sustainability demands.
Polylactic Acid Market, By End-use Industry
The packaging segment is projected to grow fastest in the polylactic acid market due to environmental concerns and stricter regulations on traditional plastics, encouraging brands to adopt bio-based options. PLA's clarity, printability, and compostability make it ideal for food packaging, single-use containers, and consumer goods. As demand for sustainable, recyclable packaging rises in food, beverage, personal care, and e-commerce, PLA's importance increases. This trend is supported by more investments in compostable packaging infrastructure and consumer preference for eco-friendly materials.
REGION
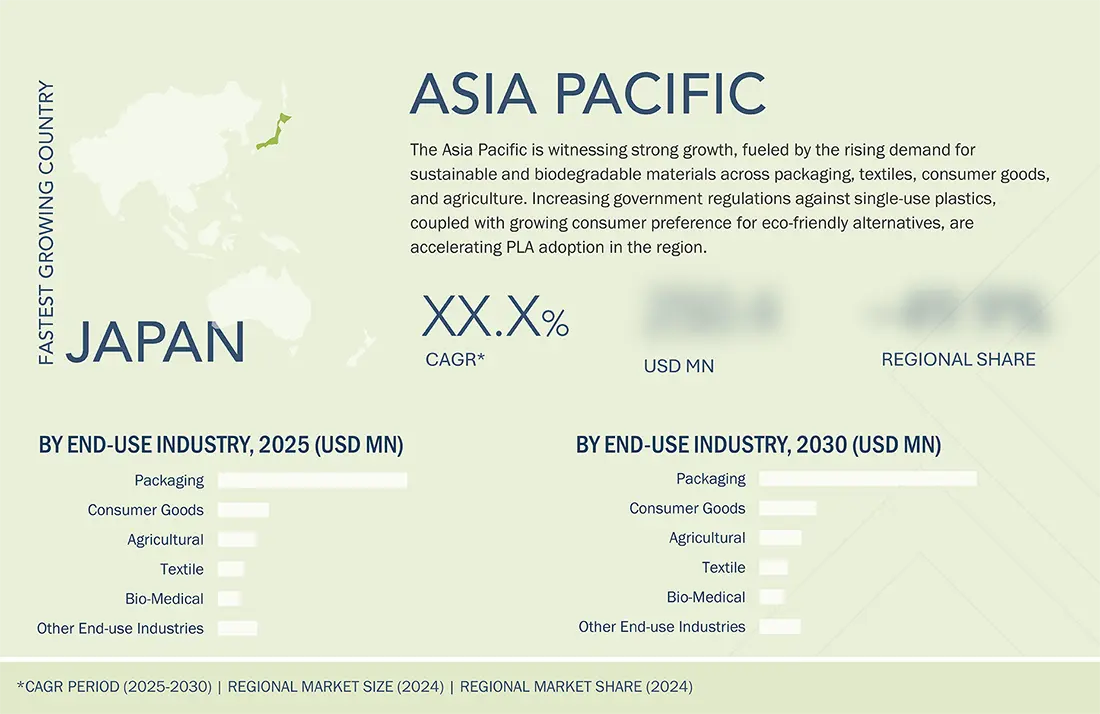
Asia Pacific to be the fastest-growing region in the global polylactic acid market during the forecast period
Our estimates show Asia Pacific will be the fastest-growing region for polylactic acid (PLA) during the forecast. Countries like China, India, Japan, and South Korea are industrializing and urbanizing, with increased environmental awareness leading to a shift towards sustainable materials. Government incentives, such as bans on single-use plastics and promotion of bio-based materials, are driving demand. Growth in packaging, textiles, electronics, and automotive sectors will sustain PLA expansion. Policies supporting local bioplastics production and public-private partnerships to achieve circular economy goals are further boosting market growth. With government support, rising industrial capacity, and demand from downstream industries, Asia Pacific is set to be the fastest-growing PLA market globally.
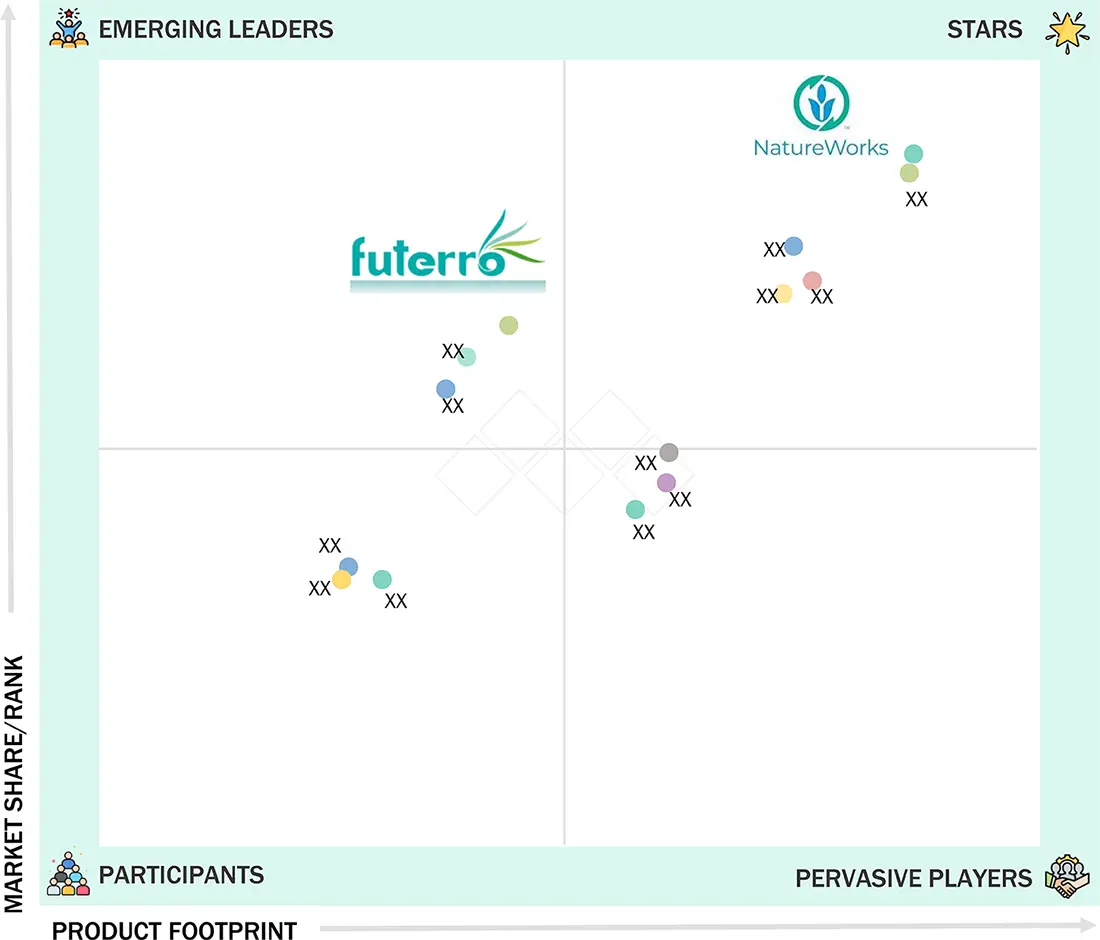
Polylactic Acid Market: COMPANY EVALUATION MATRIX
NatureWorks LLC (Star) has large-scale capacity, a global footprint, and strong sustainability investments, placing it at the top of the PLA market. TotalEnergies Corbion (Emerging Leader) advances with its Luminy PLA range in Europe and Asia, focusing on high-heat and durable grades for packaging and medical uses. Through innovation and partnerships, NatureWorks maintains its lead, while TotalEnergies Corbion, with capacity expansions and strategic collaborations, gains momentum as a sustainability-focused competitor.
Source: Secondary Research, Interviews with Experts, MarketsandMarkets Analysis
KEY MARKET PLAYERS
POLYLACTIC ACID MARKET SCOPE
| REPORT METRIC | DETAILS |
|---|---|
| Market Size in 2024 (Value) | USD 1.72 Billion |
| Market Forecast in 2030 (Value) | USD 4.51 Billion |
| Growth Rate | CAGR of 17.5% from 2025-2030 |
| Years Considered | 2022-2030 |
| Base Year | 2024 |
| Forecast Period | 2025-2030 |
| Units Considered | Value (USD Million), Volume (Kilotons) |
| Report Coverage | Revenue forecast, company ranking, competitive landscape, growth factors, and trends. |
| Segments Covered |
|
| Regions Covered | North America, Asia Pacific, Europe, South America, Middle East & Africa |
WHAT IS IN IT FOR YOU: Polylactic Acid Market REPORT CONTENT GUIDE
DELIVERED CUSTOMIZATIONS
We have successfully delivered the following deep-dive customizations:
| CLIENT REQUEST | CUSTOMIZATION DELIVERED | VALUE ADDS |
|---|---|---|
| Global PLA Producer | • Profiling on a highly detailed level of the top manufacturers of PLA (NatureWorks, TotalEnergies Corbion, Futerro, Danimer Scientific) • Production capacity benchmarking at a global and regional level by grade (thermoforming, injection molding, extrusion, blow molding) and comparing the standard, rapid, and high molecular weight grades • Tracking the development of new companies entering the market, agreements on licensing, and expansions | • Forward integration strategy into consumer goods and packaging was strengthened • Locations of supply-demand missed opportunities were pinpointed in Asia, Europe, and North America • By accessing the market of high-heat & copolymer PLA grades first, competitiveness was raised with the help of an early-mover advantage |
| Rigid Thermoforms Manufacturer | • Detailed comparison of PLA versus PET/PS use in trays, clamshells, and containers for food service • Thermoforming cost–performance benchmarking • Assessment of compostability, recyclability, and food-contact compliance in various parts of the world | • The roadmap for the transition from PET/PS to PLA in rigid packaging was made possible • Points of unexploited potential were discovered in ready-meal trays, bakery, and medical blister packs • Adoption process was regulated and rationalized in accordance with the sustainability concerns of the thermoforming sector |
| Films & Sheets Manufacturer | • Competition review of PLA films against PE/PET films for flexible packages and agricultural products • Developing compostable wraps, pouches, and mulch films – the role of case studies • Map of certification and compliance (EN 13432, ASTM D6400) was drawn | • The market of biodegradable film with high growth potential in Asia Pacific and Europe was discovered. • Supplier positioning in flexible and agricultural applications was benchmarked. • Client transition plans from fossil-based to bio-based films were supported. |
| Bottles Manufacturer | • Technical benchmarking of PLA and PET bottles in terms of strength, barrier, and shelf-life performance was reported • An overview of various PLA applications in water, dairy, and single-serve beverage bottles was presented • Encouraging examples of additive technologies for making PLA bottles more durable were given | • The areas where beverage brands move to bio-based bottles where the easiest entrances were found were highlighted • Feasibility of PLA bottles in high-volume packaging was checked • With the help of consumer insights, the go-to-market strategy was reinforced |
RECENT DEVELOPMENTS
- June 2025 : TotalEnergies Corbion published a new Life Cycle Assessment (LCA) for its Luminy PLA.
- May 2025 : Futerro plans to set up Europe's biorefinery in Normandy, combining lactic acid, lactide, and PLA production with chemical and mechanical recycling.
- April 2025 : TotalEnergies Corbion and USEON Technology Limited have partnered to commercialize EPLA.
- November 2024 : Futerro set up Europe’s first vertically integrated biorefinery in Normandy for the production and recycling of PLA.
Table of Contents
 Exclusive indicates content/data unique to MarketsandMarkets and not available with any competitors.
Methodology
The study carried out four key activities to measure the size of the global polylactic acid (PLA) market. Extensive secondary research was performed to gather information on the PLA market, related bioplastic markets, and the broader markets for bio-based polymers. These findings were verified through primary research with industry experts from various parts of the PLA value chain, including sources from raw material supply industries, polymer manufacturers, compounders, and end-use industries. The overall PLA market size was estimated using both top-down and bottom-up approaches. Market segmentation and data triangulation were then used to accurately determine the sizes of the segments and sub-segments of the PLA market.
Secondary Research
We developed a market landscape for companies providing PLA and related solutions using a combination of secondary data sources, both publicly available and those we paid for, including evaluation of company product portfolios, industry publications, and trade databases. The following sources were examined to assess macroeconomic and industry-level trends influencing PLA uptake: Bloomberg, Factiva, Business Standard, and the World Bank. In addition, we used annual reports from our climate policy framework assessment, press releases, sustainability reports, and investor briefings of PLA manufacturers and bio-based (derived from renewable biomass) polymer manufacturers and as well as guidance from industry associations, environmental policy frameworks, and whitepapers related to bioplastics. This research led to an understanding of the various components of the PLA value chain, the top players in the PLA business, how the market is categorized, innovation developments in technology, and related information in the PLA ecosystem.
Primary Research
In the primary research process, various primary sources from both the supply and demand sides were interviewed to obtain qualitative and quantitative information for this report. The primary sources from the supply side included industry experts, such as Chief Executive Officers (CEOs), Vice Presidents (VPs), marketing directors, technology and innovation directors, and related key executives from several key companies and organizations operating in the PLA market. After the complete market engineering (calculations for market statistics, market breakdown, market size estimations, market forecasting, and data triangulation), extensive primary research was conducted to gather information and verify and validate the critical numbers arrived at. Primary research was also conducted to identify the segmentation types, industry trends, competitive landscape of PLA offered by various market players, and key market dynamics, such as drivers, restraints, opportunities, challenges, industry trends, and key player strategies. In the complete market engineering process, the top-down and bottom-up approaches and several data triangulation methods were extensively used to perform the market estimation and market forecasting for the overall market segments and subsegments listed in this report. Extensive qualitative and quantitative analysis was performed on the complete market engineering process to list the key information/insights throughout the report.
The following is the breakdown of primary respondents:

Notes: Other designations include sales, marketing, and product managers.
Tier 1: >USD 1 Billion; Tier 2: USD 500 million–1 Billion; and Tier 3: < USD 500 million.
To know about the assumptions considered for the study, download the pdf brochure
Market Size Estimation
The top-down and bottom-up approaches were used to estimate and validate the size of the global PLA market. These approaches were also used extensively to estimate the size of various dependent market segments. The research methodology used to estimate the market size included the following:

Data Triangulation
After estimating the overall market size using standardized methodologies, the PLA market was divided into various application areas, grades, raw materials, and regional markets. Data triangulation and market breakup techniques were used, when necessary, to complete the market analysis and produce accurate statistics for each segment and subsegment. The triangulation process involved analyzing and confirming data from supply-side factors (such as production capacities, raw material availability, technology adoption) and demand-side trends (including end-use consumption, application growth, regulatory requirements) to ensure consistency and precision in the final market estimates.
Market Definition
PLA is a bio-based and fully biodegradable thermoplastic polyester typically derived from renewable resources that include corn starch, sugarcane, cassava, and sugarbeet. PLA is produced from the fermentation of sugars to lactic acid, followed by polymerization. It is recognized for its clarity, compostability, and being easy to process, and is frequently used in packaging, 3D printing, textiles, medical devices, and in the disposal of products. PLA offers adequate mechanical strength, biocompatibility, and significantly less environmental impact when compared to traditional fossil-fuel-based plastics; however, there are some limitations with PLA, specifically with regard to heat resistance and its rate of degradation in non-industrial composting situations. Overall, PLA can be made using conventional plastic processing methods, such as injection molding, thermoforming, blow molding, and extrusion. Because of increasing demand for more sustainable alternatives, PLA is changing its position in the new world manufacturing sector with the rapid transition to circular and bio-economy-based manufacturing.
Stakeholders
- PLA manufacturers
- Raw material suppliers
- Downstream converters and processors
- Distributors and traders
- Industry associations and regulatory bodies
- End users
Report Objectives
- To define, describe, and forecast the size of the global PLA market based on application, grade, sales channel, and region in terms of value and volume
- To provide detailed information on the significant drivers, restraints, opportunities, and challenges influencing the market
- To strategically analyze micromarkets concerning individual growth trends, prospects, and their contribution to the market
- To assess the growth opportunities in the market for stakeholders and provide details on the competitive landscape for market leaders
- To forecast the market size of segments and subsegments for North America, Europe, Asia Pacific, South America, and the Middle East & Africa
- To strategically profile key players and comprehensively analyze their market shares and core competencies
- To analyze competitive developments such as product launches, acquisitions, expansions, partnerships, and agreements in the PLA market
- To provide the impact of AI/Gen AI on the market
Key Questions Addressed by the Report
What are the drivers of the PLA market?
Increasing global demand for sustainable and compostable materials, environmental regulations on single-use plastics, corporate sustainability commitments, and government support are key drivers. Technological improvements in processing and thermal resistance also expand PLA applications.
What are the major challenges of the PLA market?
Key challenges include higher production costs, limited industrial composting infrastructure, reduced thermal and barrier properties, feedstock availability issues (e.g., corn, sugarcane), and competition from other bio-based or recyclable materials.
What are the major opportunities in the PLA market?
Opportunities lie in high-performance PLA grades, chemical recycling, growth in 3D printing, biomedical applications, automotive uses, and expansion into non-food biomass sources. Increasing demand in Asia-Pacific, Middle East, and Latin America also fuels growth.
What are the major factors restraining the growth of the PLA market?
Restraints include limited consumer awareness, lack of composting infrastructure, low-cost competition from petrochemical plastics, and unclear biodegradability regulations that challenge broader adoption.
Who are the major players in the PLA market?
Major companies include NatureWorks LLC (US), TotalEnergies Corbion (Netherlands), BASF SE (Germany), COFCO (China), and Futerro (Belgium).
Need a Tailored Report?
Customize this report to your needs
Get 10% FREE Customization
Customize This ReportPersonalize This Research
- Triangulate with your Own Data
- Get Data as per your Format and Definition
- Gain a Deeper Dive on a Specific Application, Geography, Customer or Competitor
- Any level of Personalization
Let Us Help You
- What are the Known and Unknown Adjacencies Impacting the Polylactic Acid Market
- What will your New Revenue Sources be?
- Who will be your Top Customer; what will make them switch?
- Defend your Market Share or Win Competitors
- Get a Scorecard for Target Partners

Custom Market Research Services
We Will Customise The Research For You, In Case The Report Listed Above Does Not Meet With Your Requirements
Get 10% Free CustomisationTESTIMONIALS

We at Nissan Chemicals Corporation have been clients of MarketsandMarkets for more than a year now. We recently consulted MarketsandMarkets for a study, the team at MarketsandMarkets was extremely professional and organized. The business insights were very detailed and aligned well with our expectations that really helped us formulate the Business Plans and device new strategies for development themes. MarketsandMarkets offers a unique combination of expertise and dedicated engagement model. Their research findings have helped us in designing our Pricing Strategy which will make it easier for us to predict the future sales and profits for the next ten years. We look forward to working with MarketsandMarkets in the future.
VP of Strategy & New Business Development
Leading Specialty Chemical Company
The MarketsandMarkets Engagement Model, composed of both the Knowledge Store and advisory custom research, has greatly helped us in understanding our markets and making strategic decisions. The Knowledge Store is a fast way to allow everyone in our organization to understand more about most any market they are interested in. The ability to then get custom research done and get answers to specific strategic questions and market insight has been spectacular. The Markets and Markets team feel more like colleagues than vendors and their services have helped us change our culture where statements of things like growth opportunities and competitive position are always backed by industry research.

Rich Gibson,
Director, Corporate Strategy
Milliken & Company,
Leading Industrial Manufacturer of specialty chemical, floor covering, performance and protective textile materials, and healthcaremilliken.com
MarketsandMarkets is a trusted resource that helps us to better understand markets that are near-adjacencies-whether its technology, value chain or geography. Their Knowledge Store platform provides a dashboard of markets and their characteristics which is easy to use and saves us time.
Adam Shaw,
Market Development and Strategy Manager
AdvanSix Inc. USA,
An American Leader in Chemicalswww.advansix.com
The Knowledge Store from MarketsandMarkets is a valuable tool which has helped my team acquire greater insight in to the end markets that our business serves. This has enabled us to help our company build stronger strategies throughout our planning process.
TOSHIO KINOSHITA
Senior Chif Consultion Research & Consulting Division
Mitsubishi Chemical Research Corporation,
Leading Manufacturer of Chemical Productswww.mitsubishichem-res.co.jp/en/

We recently engaged with MarketsandMarkets for a study, the team not only clearly understood our business objectives but was also extremely professional in the way they handled the entire project. The study was efficiently conducted in a phase-wise manner, and the engagement model furnished us with high-quality business insights that far exceeded our expectations at each phase. We were especially happy that MarketsandMarkets could provide us with both, an English as well as a Japanese version of the study. A special thanks to the Analyst Team and Client Services Team, whose fluency in Japanese enhanced our comfort level, as we could converse with them in our preferred language.
Independent entrepreneurs
Arrow Precision
We approached MarketsandMarkets for study on Proppants Market, and their work exceeded our expectations. The study conducted was comprehensive and enabled us to view the market through the various dimensions. In addition, the team was extraordinarily responsive throughout the process and resolved our queries on time. I strongly recommend MarketsandMarkets and will certainly consider them for additional market assessments we will need in the future.
Global engineering company, Japan
Deputy Manager,
Strategic Planning OfficeThe high-quality insights shared by the MarketsandMarkets team helped us understand the pharmaceutical plant designers in a specific geography. It also captured the risks that we may likely face in communicating with our potential partners. The study would enable us identify partners, which would impact our future growth.


Growth opportunities and latent adjacency in Polylactic Acid Market