Biodegradable Plastics Market

Report Code CH 2736
Published in Oct, 2024, By MarketsandMarkets™
Download PDF

Choose License Type

Buy Report Now Inquire Before Buying

Biodegradable Plastics Market by Type (PLA, Starch Blends, PBAT, PHA, PBS, Cellulose Based), End-Use Industry (Packaging, Consumer Goods, Textiles, Agriculture & Horticulture), and Region- Global Forecast to 2029

Overview

The global biodegradable plastics market is projected to grow from USD 9.64 billion in 2024 to USD 30.05 billion by 2029, at a CAGR of 25.5%. The increasing use of biodegradable plastics such as PLA and PHA in the packaging industry in emerging economies is expected to drive the market during the forecast period. Growing environmental awareness has also increased the adoption of biodegradable plastics. Furthermore, stringent regulations toward banning single-use plastics (SUPs) in developing economies such as China and India are expected to significantly increase the demand for biodegradable plastics. Government focus on new policies related to the use of traditional plastics and replacement with biodegradable plastics globally drive the market.

Attractive Opportunities in the Biodegradable Plastics Market

Asia Pacific

The availability of low-cost raw material and labor along with increasing demand from packaging, consumer goods, agriculture & horticulture industries in Asia Pacific drive the biodegradable plastics market.

The increasing application of biodegradable plastics in the packaging industry is contributing to the growth of the market in Asia Pacific.

China's dominance in the manufacturing sector is driving significant growth in the Asia Pacific market.

The Asia Pacific biodegradable plastics market is expected to be worth USD 6.5 billion by 2029, growing at CAGR of 23.4% during the forecast period.

Easy availability of raw materials, low-cost labor, and improved lifestyle coupled with stringent plastics regulations are growth opportunities for the biodegradable plastics market.

Global Biodegradable Plastics Market Dynamics

DRIVER: Consumers with strong purchasing power and commitment to environmental sustainability

The high purchasing power and growing environmental awareness of the benefits of biodegradable plastics are the most critical factors driving the market. Consumers now consider sustainability in their purchasing decisions as concerns over environmental issues are raised by plastic pollution boards and climate change authorities. They consciously choose those products that suit their values and thus buy biodegradable plastics instead of regular alternatives. As sustainability becomes a significant factor in purchase decisions, customers are now willing to pay more for such products. Offering biodegradable products can differentiate brands from competitors manufacturing conventional plastics. This business trend is becoming obvious in the packaging, food service, and personal care sectors, where biodegradable alternatives help ensure customer loyalty and market share. Those companies responding to demand are innovating their product development and enriching their marketing strategies by pointing out the environmental benefits of biodegradable materials. Additionally, innovation in the production process for biodegradable plastics has reduced overall production costs, making biodegradable plastics increasingly competitive compared to traditional plastics. These advancements are necessary for scaling up production and meeting global demand. Thus, the convergence of consumer preference for sustainable products with a willingness to pay a premium for eco-friendly options drives the market.

RESTRAINT: Volatility in raw material prices

The raw material price volatility significantly restrains the performance of a market by introducing uncertainty and affecting business profit margins. Raw materials of biodegradable plastics are derived from renewable sources like plants and microorganisms. Key materials include starches from corn, potatoes, cassava, and wheat, frequently used due to their abundance and biodegradability. Another important feedstock of biodegradable plastics is cellulose acetate, extracted from wood pulp, cotton, and hemp. The cost of these feedstocks varies, mainly due to alterations in agricultural yields, unpredictable conditions, and even market demand. An increase in the price of producing corn, perhaps because of weather disturbances or distortions in global supply chains, is an example of feedstock cost variation. The manufacturing process for biodegradable plastics, which involves polymerization and compounding, adds more room for uncertainty over cost factors. It is also for the production of materials like PLA, which makes it susceptible to changes in the availability and pricing of raw materials. Consequently, prices tend to become relatively uncompetitive with more traditional, petroleum-based plastics, of which production processes are conventional and lower in cost.


OPPORTUNITY: Increasing use of biodegradable plastics in packaging industry

The use of biodegradable plastics in the packaging industry is expected to increase, posing an immense opportunity for biodegradable plastic manufacturers. As consumers and businesses develop greater awareness of the consequences of plastic waste, demand for greener packaging solutions that are better known as sustainable options is increasing. The shift from conventional plastics to biodegradable plastics is visible, and consumers now tend to use more sustainable products. Biodegradable plastics have given the best solution to help plastic converters reduce their carbon footprint while fulfilling their regulatory expectations and those of consumers for eco-friendly products. This evolution is more visible in some industries, such as food and beverage, where brands are fully on the quest for biodegradable materials for packaging purposes to increase their sustainability profile. As the e-commerce business continues to grow and become more significant, the use of biodegradable packages will increase. Further developments in biodegradable film technology and better barrier properties also lead to new applications in packaging. Investment in research and development into high-performance biodegradable packaging keeps companies growing while setting a precedent for sustainable practices in business lines around it.

CHALLENGES: High price and complex production process

The bio-refinery process is one of the costliest units in the biotechnological manufacturing sector. The most attractive requirement is the setting up of a bio-refinery, and most bio-products cannot achieve the economy of scale. Cheaper and more efficient products, like petroleum products, are easily available in the market. Thus, the whole process of production and its application is costly. The production process for biodegradable plastics is quite complex and remains a crucial challenge in the growth and adoption of this market. Multi-step manufacturing involves sourcing raw materials, polymerization, and compounding, which are often engaged in producing biodegradable plastics. For example, producing PLA involves several steps, including the fermentation of sugars to lactic acid and then polymerization in the conditions determined to produce PLA. Thus, temperature and pressure-control conditions need to be controlled, which increases the cost of production and makes the process sensitive to slight variations in parameters used, leading to compromised product quality. The quality of the final products may require tight control over parameters such as temperature and pressure, and such a process is as complex as it is sensitive to even minute changes.

Global Biodegradable Plastics Market Ecosystem Analysis

The biodegradable plastics ecosystem comprises raw material suppliers providing chemicals to manufacturers, manufacturers conducting research & development of the final products for use in various industries, and intermediaries & distributors providing a link between manufacturers and end users by supplying final products. They work together to supply the final products to end users in different industries. It involves a series of processes, from raw material procurement to manufacturing the end products and distributing them to end users for further use in various end-use industries.


The consumer goods industry is estimated to be the second fastest-growing end-use industry during the forecast period.

Major goods falling under the consumer goods category include electrical appliances, domestic appliances, etc. Several companies manufacturing consumer goods have shifted toward developing biodegradable plastics instead of traditional plastics. Biodegradable plastics are used to produce consumer goods such as casings of touchscreen computers, speakers, mobile casings, and vacuum cleaners, and companies are constantly coming up with biodegradable alternatives to conventional plastics that can be used for most products. The reason for such changes is the growing demand from consumers for environmental-sensitive products, as consumers increasingly look out for products sharing similar sustainability values. Increasing consumer awareness has led to their search for more environmentally sensitive products. Therefore, such consumer goods would meet this need by incorporating biodegradable plastics, thus helping increase their reputation on the market and attract an environmentally conscious consumer. In addition, regulatory pressures in favor of the growing demand for sustainability will continue to drive growth in using biodegradable materials. These factors have significantly helped increase this end-use industry's market share. The consumer goods industry is estimated to be the second fastest-growing end-use industry during the forecast period.

The starch blend type is expected to be the fifth fastest-growing type during the forecast period in terms of value.

Starch blends are usually prepared using a starch matrix incorporated with other polymers such as PLA, PBAT, and PHA. The addition of these polymers has provided improved mechanical properties and flexibility together with the processability of the final product when the starch-based material is melted in hot water. Starch blends generally appear either granular (native or modified) or thermoplastic (plasticized). They consist of two types of polymers of glucose—amylose and amylopectin. The advantages of starch blends for plastic production include biodegradability, renewability, excellent oxygen barrier in the dry state, easy availability, and low cost. Due to excellent tensile strength and elongation properties, the demand for starch-based biodegradable plastics is rising in the packaging industry. Starch-based biodegradable plastics have a lower carbon footprint compared to conventional plastics, hence making them eco-friendly alternatives for both production and disposal. Among the important producers of starch blends, Novamont sells starch blends under the name Mater-Bi, for shopping bags, agricultural films, and the food service industry. Similarly, FkuR, another biodegradable plastic manufacturer, offers Bio-Flex, which finds applications in consumer goods products like films, bags, and many others.

Asia Pacific will hold the third-largest market share during the forecast period.

The major markets for biodegradable plastics are Europe, North America, and Asia Pacific. The availability of low-cost raw materials and labor coupled with the growing demand for packaging, consumer goods, agriculture & horticulture, and textile industries will likely make the region an attractive investment destination for biodegradable plastic manufacturers. Government initiatives toward the enforcement of single-use plastic bans in Asia Pacific are also expected to drive the market. Banning single-use plastics (SUPs) in China and India will create demand for sustainable alternatives such as biodegradable plastics. Governments of both countries have implemented stringent regulations promoting sustainable solutions to reduce plastic waste. For instance, the Chinese government has banned single-use plastics products such as straws, cutlery, and packaging products used in the food service industry, which will likely positively impact the growth of the biodegradable plastics market.

Most of the production of the bio-based manufacturing market in the region is confined to China, Thailand, and Japan. Some of the major players in the region include Tianjin GreenBio Materials Co. (China), Tianan Biologic Materials Co. Ltd. (China), Mitsubishi Chemical Holding Corporation (Japan), and Indorama Ventures PCL (Thailand).

HIGHEST CAGR MARKET IN 2023
CHINA FASTEST GROWING MARKET IN THE REGION

Recent Developments of Biodegradable Plastics Market

  • In April 2024, NatureWorks LLC partnered with IMA Coffee to introduce a turn-key compostable coffee pod solution designed for compatibility with Keurig brewers in the North American market. This collaboration, which began in April 2021, leverages NatureWorks LLC's expertise in Ingeo PLA biopolymer and IMA Coffee's proficiency in coffee processing and packaging technologies. The partnership aims to simplify the supply chain for coffee brands seeking sustainable packaging solutions that preserve the taste and aroma of coffee.
  • In August 2024, TotalEnergies Corbion partnered with Nagase & Co., Ltd. to enhance the distribution of Luminy PLA bioplastics in Japan. This collaboration aims to expand the reach of Luminy PLA, a sustainable bioplastic derived from renewable sugarcane, in a market increasingly focused on reducing greenhouse gas emissions. Under this agreement, the two companies will boost sales and engage in joint research and development to improve material properties and create new applications tailored to customer needs.
  • In June 2022, Confoil, one of Australia's food packaging manufacturers, and BASF SE collaborated to develop certified compostable dual ovenable paper trays for packaging. The lightweight paperboard trays contain BASF SE's biopolymer Ecovio PS 1606.
  • In April 2020, Novamont launched a new grade of Mater-Bi for extrusion coating and lamination on paper boards and other substrates, which can be compostable in industrial parts. This grade improved process stability, coating thicknesses, processing speed comparable with LDPE, and excellent adhesion to different substrates. The excellent toughness and resistance to perforation made it suitable for contact with food and microwave use and offer excellent resistance to oils and fats.

Key Market Players

KEY PLAYERS IN THE BIODEGRADABLE PLASTICS MARKET INCLUDE

Want to explore hidden markets that can drive new revenue in Biodegradable Plastics Market?

Scope of the Report

Report Metric Details
Years considered for the study 2021-2029
Base Year 2023
Forecast period 2024-2029
Units considered Value (USD Million), Volume (Kiloton)
Segments Type, End Use Industry, and Region
Region Asia Pacific, North America, Europe, Middle East & Africa, and South America


Key Questions Addressed by the Report

Which are the major companies in the biodegradable plastics market? What are their major strategies to strengthen their market presence?
Some of the key players in the biodegradable plastics market are NatureWork LLC (US), BASF SE (Germany), TotalEnergies Corbion (Netherlands), Mitsubishi Chemical Group Corporation (Japan), Biome Bioplastics (UK), Plantic (Australia), FKuR (Germany), Danimer Scientific (US), TORAY INDUSTRIES, INC. (Japan), and Novamont (Italy). Global companies offer high-quality biodegradable plastics and focus on developing a wide range for various applications. Local players are offering biodegradable plastics at lower costs to stay competitive in the market.
What are the drivers and opportunities for the biodegradable plastics market?
Government focus on new policies and regulations, the strong purchasing power of consumers, and a high degree of environmental awareness provide an opportunity for the market to grow.
Which region is expected to hold the highest market share?
Europe's biodegradable plastics market has been experiencing growth and significant industry demand. It is driven by economic growth in countries such as the UK, Germany, Italy, Spain, and France. The increasing demand from various end-use industries is driving the demand for biodegradable plastics in the region.
What is the total CAGR expected to be recorded for the biodegradable plastics market during 2024–2029?
The market is expected to record a CAGR of 25.5% during 2024–2029.
How is the biodegradable plastics market aligned?
The market has keen competition, and various growth strategies such as capacity expansion, mergers & acquisitions, and the launch of new products are planned by many manufacturers to maintain their presence in the market.

Personalize This Research

  • Triangulate with your Own Data
  • Get Data as per your Format and Definition
  • Gain a Deeper Dive on a Specific Application, Geography, Customer or Competitor
  • Any level of Personalization
Request A Free Customisation

Let Us Help You

  • What are the Known and Unknown Adjacencies Impacting the Biodegradable Plastics Market
  • What will your New Revenue Sources be?
  • Who will be your Top Customer; what will make them switch?
  • Defend your Market Share or Win Competitors
  • Get a Scorecard for Target Partners
Customized Workshop Request

Table of Contents

Exclusive indicates content/data unique to MarketsandMarkets and not available with any competitors.

TITLE
PAGE NO
INTRODUCTION
25
RESEARCH METHODOLOGY
30
EXECUTIVE SUMMARY
39
PREMIUM INSIGHTS
43
MARKET OVERVIEW
46
  • 5.1 INTRODUCTION
  • 5.2 IMPACT OF AI/GEN AI
    INTRODUCTION
    OVERVIEW OF IMPACT
    - Innovative biodegradable packaging from vineyard waste
    - Synergizing generative AI and biodegradable plastics for sustainable agriculture
    - Enhancing sustainability in packaging: Role of AI and biodegradable plastics
  • 5.3 MARKET DYNAMICS
    DRIVERS
    - Government focus on new policies and regulations
    - Consumers with strong purchasing power and commitment to environmental sustainability
    - Increasing applications of eco-friendly products
    RESTRAINTS
    - Volatility in raw material prices
    - Higher price of biodegradable plastics than that of conventional plastics
    OPPORTUNITIES
    - Increasing use of biodegradable plastics in packaging end-use industry
    - Higher growth in emerging economies of Asia Pacific
    CHALLENGES
    - High price and complex production process
    - Less durability of biodegradable plastics than traditional plastics
  • 5.4 PORTER’S FIVE FORCES ANALYSIS
    THREAT OF SUBSTITUTES
    BARGAINING POWER OF SUPPLIERS
    THREAT OF NEW ENTRANTS
    BARGAINING POWER OF BUYERS
    INTENSITY OF COMPETITIVE RIVALRY
  • 5.5 KEY STAKEHOLDERS AND BUYING CRITERIA
    KEY STAKEHOLDERS IN BUYING PROCESS
    BUYING CRITERIA
  • 5.6 VALUE CHAIN ANALYSIS
    RAW MATERIAL SUPPLY
    MANUFACTURING
    DISTRIBUTION
    END USE
  • 5.7 MACROECONOMIC INDICATORS
    GLOBAL GDP TRENDS
  • 5.8 ECOSYSTEM ANALYSIS
  • 5.9 CASE STUDY ANALYSIS
    HOLLER POLLER – WOODEN TOYS WITH BIO-PLASTIC TIRES
    ENHANCING BIOBASED PLASTICS WITH NATURAL RESIN DERIVATIVES
    SUSTAINABLE COSMETIC PACKAGING BY RAMAPLAST S.P.A.
  • 5.10 REGULATORY LANDSCAPE
    REGULATIONS
    - North America
    - Asia Pacific
    - Europe
    - Middle East & Africa
    - South America
    REGULATORY BODIES, GOVERNMENT BODIES AND OTHER ORGANIZATIONS
  • 5.11 TECHNOLOGY ANALYSIS
    KEY TECHNOLOGIES
    - PLA production
    - Polyhydroxyalkanoates (PHA) Synthesis
    COMPLEMENTARY TECHNOLOGIES
    - Enzyme-catalyzed polymerization
    - Nano-Composite Technologies
    ADJACENT TECHNOLOGIES
    - Recycling and Upcycling Technologies
    - Sustainable Packaging Solutions
  • 5.12 TRENDS/DISRUPTIONS IMPACTING CUSTOMER BUSINESS
  • 5.13 TRADE ANALYSIS (EXPORT/IMPORT)- VOLUME AND TRADE PRICES, 2020-2023
    TRADE ANALYSIS
    IMPORT SCENARIO (HS CODE 390770)
    EXPORT SCENARIO (HS CODE 390770)
  • 5.14 KEY CONFERENCES AND EVENTS, 2024–2025
  • 5.15 AVERAGE SELLING PRICE, 2021–2029
    FACTORS AFFECTING PRICES
    AVERAGE SELLING PRICE TREND BY REGION
    AVERAGE SELLING PRICE, BY TYPE
    AVERAGE SELLING PRICE, BY END-USE INDUSTRY
    AVERAGE SELLING PRICE TREND OF KEY PLAYERS, BY END-USE INDUSTRY
  • 5.16 INVESTMENT AND FUNDING SCENARIO
  • 5.17 PATENT ANALYSIS
    METHODOLOGY
    DOCUMENT TYPE
    INSIGHTS
    PATENTS BY BASF SE
    TOP 10 PATENT OWNERS IN LAST 10 YEARS
BIODEGRADABLE PLASTICS MARKET, BY TYPE
83
  • 6.1 INTRODUCTION
  • 6.2 PLA
    EXTENSIVE UTILIZATION OF PLA IN PACKAGING INDUSTRY
  • 6.3 STARCH BLENDS
    RISING APPLICATION IN VARIOUS INDUSTRIES
  • 6.4 PHA
    INCREASING USE IN AGRICULTURE AND HORTICULTURE INDUSTRIES
  • 6.5 PBAT
    GROWING APPLICATIONS IN PACKAGING, FLEXIBLE, AND MULCH FILMS
  • 6.6 PBS
    COST-EFFECTIVENESS OF PBS TO INCREASE DEMAND
  • 6.7 CELLULOSE BASED
    INCREASED USE IN PACKAGING INDUSTRY
  • 6.8 OTHER TYPES
BIODEGRADABLE PLASTICS MARKET, BY END-USE INDUSTRY
90
  • 7.1 INTRODUCTION
  • 7.2 PACKAGING
    FLEXIBLE PACKAGING
    - Long shelf-life, low costs, and eco-friendliness influencing several brands
    - Bags
    - Pouches
    - Films and roll stocks
    - Others
    RIGID PACKAGING
    - Growing demand in food & beverages, personal care, and consumer goods industries
    - Bottle and jars
    - Trays
    - Tubs
    - Caps and closures
    - Others
  • 7.3 CONSUMER GOODS
    ELECTRICAL APPLIANCES
    - Demand from fast-moving consumer electronics
    DOMESTIC APPLIANCES
    - Demand for biodegradable houseware
    OTHERS
  • 7.4 TEXTILE
    MEDICAL & HEALTHCARE TEXTILES
    - Increasing demand for medical textiles
    PERSONAL CARE, CLOTHES, AND OTHER TEXTILES
    - Increasing demand for thermoplastics fibers
  • 7.5 AGRICULTURE AND HORTICULTURE
    TAPES & MULCH FILMS
    - Low labor and disposal costs
    OTHERS
  • 7.6 OTHER END-USE INDUSTRIES
BIODEGRADABLE PLASTICS MARKET, BY REGION
99
  • 8.1 INTRODUCTION
  • 8.2 NORTH AMERICA
    US
    - Increasing focus on sustainable packaging products
    CANADA
    - Growing demand for sustainable packaging
    MEXICO
    - Skilled workforce, geographic advantages, political and economic stability
  • 8.3 EUROPE
    GERMANY
    - Growth in packaging industry
    ITALY
    - Growth in various end-use industries
    FRANCE
    - Demand for sustainable packaging
    UK
    - Increasing focus on policy implementation and regulations
    SPAIN
    - Increasing demand for food & beverage packaging
    REST OF EUROPE
  • 8.4 ASIA PACIFIC
    CHINA
    - Ban on single-use plastics
    JAPAN
    - Increasing demand for biodegradable plastic in various end-use industries
    SOUTH KOREA
    - Environmental sustainability
    INDIA
    - Increasing application biodegradable plastics in agricultural industry
    REST OF ASIA PACIFIC
  • 8.5 MIDDLE EAST & AFRICA
    GCC COUNTRIES
    SAUDI ARABIA
    - Potential growth in upcoming years
    REST OF GCC COUNTRIES
    SOUTH AFRICA
    - Advancements in bioplastics research and innovation
    REST OF MIDDLE EAST & AFRICA
  • 8.6 SOUTH AMERICA
    BRAZIL
    - Rising demand for sustainable packaging solutions from agricultural sector
    ARGENTINA
    - Rising demand for environmentally friendly packaging materials
    REST OF SOUTH AMERICA
COMPETITIVE LANDSCAPE
158
  • 9.1 INTRODUCTION
  • 9.2 KEY PLAYER STRATEGIES/RIGHT TO WIN 2019–2024
  • 9.3 MARKET SHARE ANALYSIS, 2023
  • 9.4 REVENUE ANALYSIS, 2019–2023
    BASF SE
    NATUREWORKS LLC
    MITSUBISHI CHEMICAL HOLDING CORPORATION
    TOTALENERGIES CORBION
    BIOME BIOPLASTICS
  • 9.5 COMPANY VALUATION AND FINANCIAL METRICS
  • 9.6 BRAND/PRODUCTION COMPARISON
  • 9.7 COMPANY EVALUATION MATRIX: KEY PLAYERS, 2023
    STARS
    EMERGING LEADERS
    PERVASIVE PLAYERS
    PARTICIPANTS PLAYERS
    COMPANY FOOTPRINT: KEY PLAYERS, 2023
    - Company footprint
    - Type footprint
    - End-use industry footprint
    - Region footprint
  • 9.8 COMPANY EVALUATION MATRIX: STARTUPS/SMES, 2023
    PROGRESSIVE COMPANIES
    RESPONSIVE COMPANIES
    DYNAMIC COMPANIES
    STARTING BLOCKS
    COMPETITIVE BENCHMARKING, STARTUPS/SMES, 2023
    - Detailed list of key startups/SMES
    - Competitive benchmarking of key startups/SMES
  • 9.9 COMPETITIVE SCENARIO
    PRODUCT LAUNCHES
    DEALS
    EXPANSIONS
COMPANY PROFILES
184
  • 10.1 KEY PLAYERS
    NATUREWORKS LLC
    - Business overview
    - Products/Solutions/Services offered
    - Recent developments
    - MnM view
    BASF SE
    - Business overview
    - Products/Solutions/Services offered
    - Recent developments
    - MnM view
    TOTALENERGIES CORBION
    - Business overview
    - Products/Solutions/Services offered
    - Recent developments
    - MnM view
    MITSUBISHI CHEMICAL GROUP CORPORATION
    - Business overview
    - Products/solutions/services offered
    - Recent developments
    - MnM view
    BIOME BIOPLASTICS
    - Business overview
    - Products/Solutions/Services offered
    - Recent developments
    - MnM view
    PLANTIC
    - Business overview
    - Products/Solutions/Services offered
    - MnM view
    FKUR
    - Business overview
    - Products/Solutions/Services offered
    - Recent developments
    - MnM view
    DANIMER SCIENTIFIC
    - Business overview
    - Products/Solutions/Services offered
    - Recent developments
    - MnM view
    TORAY INDUSTRIES, INC.
    - Business overview
    - Products/Solutions/Services offered
    - Recent developments
    - MnM view
    NOVAMONT
    - Business overview
    - Products/Solutions/Services offered
    - Recent developments
    - MnM view
  • 10.2 OTHER PLAYERS
    BIO ON
    ZHEJIANG HISUN BIOMATERIALS CO., LTD.
    BIO-FED
    GREEN DOT BIOPLASTICS
    SPHERE
    TIANAN BIOLOGIC MATERIALS CO., LTD.
    SUCCINITY
    CARBIOLICE
    AGRANA
    FUTERRO
    EASTMAN CHEMICAL COMPANY
    INGEVITY
    PTT MCC BIOCHEM CO., LTD.
    YIELD10 BIOSCIENCE, INC.
    NATUR TEC
APPENDIX
234
  • 11.1 DISCUSSION GUIDE
  • 11.2 KNOWLEDGESTORE: MARKETSANDMARKETS’ SUBSCRIPTION PORTAL
  • 11.3 CUSTOMIZATION OPTIONS
  • 11.4 RELATED REPORTS
  • 11.5 AUTHOR DETAILS
LIST OF TABLES
 
  • TABLE 1 BIODEGRADABLE PLASTICS MARKET: INCLUSIONS AND EXCLUSIONS
  • TABLE 2 INTERVIEWS WITH EXPERTS – DEMAND AND SUPPLY SIDES
  • TABLE 3 REGULATIONS ON USE OF PLASTIC BAGS
  • TABLE 4 BIODEGRADABLE PLASTICS MARKET: PORTER’S FIVE FORCES ANALYSIS
  • TABLE 5 INFLUENCE OF STAKEHOLDERS ON BUYING PROCESS, BY END-USE INDUSTRY (%)
  • TABLE 6 KEY BUYING CRITERIA, BY END-USE INDUSTRY
  • TABLE 7 TRENDS OF PER CAPITA GDP, BY COUNTRY, 2020–2023 (USD)
  • TABLE 8 GDP GROWTH ESTIMATES AND PROJECTIONS OF KEY COUNTRIES, 2024–2027 (USD)
  • TABLE 9 PRODUCTION OF AGRICULTURAL CROPS, BY COUNTRY, 2022 (THOUSAND TONS)
  • TABLE 10 ROLES OF COMPANIES IN BIODEGRADABLE PLASTICS ECOSYSTEM
  • TABLE 11 REGULATORY BODIES, GOVERNMENT AGENCIES, AND OTHER ORGANIZATIONS
  • TABLE 12 BIODEGRADABLE PLASTICS MARKET: KEY CONFERENCES AND EVENTS, 2024–2025
  • TABLE 13 AVERAGE SELLING PRICE OF BIODEGRADABLE PLASTICS AMONG KEY PLAYERS, BY END-USE INDUSTRY (USD/KG)
  • TABLE 14 BIODEGRADABLE PLASTICS MARKET, BY TYPE, 2021–2023 (KILOTON)
  • TABLE 15 BIODEGRADABLE PLASTICS MARKET, BY TYPE, 2024–2029 (KILOTON)
  • TABLE 16 BIODEGRADABLE PLASTICS MARKET, BY TYPE, 2021–2023 (USD MILLION)
  • TABLE 17 BIODEGRADABLE PLASTICS MARKET, BY TYPE, 2024–2029 (USD MILLION)
  • TABLE 18 BIODEGRADABLE PLASTICS MARKET, BY END-USE INDUSTRY, 2021–2023 (KILOTON)
  • TABLE 19 BIODEGRADABLE PLASTICS MARKET, BY END-USE INDUSTRY, 2024–2029 (KILOTON)
  • TABLE 20 BIODEGRADABLE PLASTICS MARKET, BY END-USE INDUSTRY, 2021–2023 (USD MILLION)
  • TABLE 21 BIODEGRADABLE PLASTICS MARKET, BY END-USE INDUSTRY, 2024–2029 (USD MILLION)
  • TABLE 22 BIODEGRADABLE PLASTICS MARKET, BY REGION, 2021–2023 (KILOTON)
  • TABLE 23 BIODEGRADABLE PLASTICS MARKET, BY REGION, 2024–2029 (KILOTON)
  • TABLE 24 BIODEGRADABLE PLASTICS MARKET, BY REGION, 2021–2023 (USD MILLION)
  • TABLE 25 BIODEGRADABLE PLASTICS MARKET, BY REGION, 2024–2029 (USD MILLION)
  • TABLE 26 NORTH AMERICA: BIODEGRADABLE PLASTICS MARKET, BY COUNTRY, 2021–2023 (USD MILLION)
  • TABLE 27 NORTH AMERICA: BIODEGRADABLE PLASTICS MARKET, BY COUNTRY, 2024–2029 (USD MILLION)
  • TABLE 28 NORTH AMERICA: BIODEGRADABLE PLASTICS MARKET, BY COUNTRY, 2021–2023 (KILOTON)
  • TABLE 29 NORTH AMERICA: BIODEGRADABLE PLASTICS MARKET, BY COUNTRY, 2024–2029 (KILOTON)
  • TABLE 30 NORTH AMERICA: BIODEGRADABLE PLASTICS MARKET, BY END-USE INDUSTRY, 2021–2023 (USD MILLION)
  • TABLE 31 NORTH AMERICA: BIODEGRADABLE PLASTICS MARKET, BY END-USE INDUSTRY, 2024–2029 (USD MILLION)
  • TABLE 32 NORTH AMERICA: BIODEGRADABLE PLASTICS MARKET, BY END-USE INDUSTRY, 2021–2023 (KILOTON)
  • TABLE 33 NORTH AMERICA: BIODEGRADABLE PLASTICS MARKET, BY END-USE INDUSTRY, 2024–2029 (KILOTON)
  • TABLE 34 US: BIODEGRADABLE PLASTICS MARKET, BY END-USE INDUSTRY, 2021–2023 (USD MILLION)
  • TABLE 35 US: BIODEGRADABLE PLASTICS MARKET, BY END-USE INDUSTRY, 2024–2029 (USD MILLION)
  • TABLE 36 US: BIODEGRADABLE PLASTICS MARKET, BY END-USE INDUSTRY, 2021–2023 (KILOTON)
  • TABLE 37 US: BIODEGRADABLE PLASTICS MARKET, BY END-USE INDUSTRY, 2024–2029 (KILOTON)
  • TABLE 38 CANADA: BIODEGRADABLE PLASTICS MARKET, BY END-USE INDUSTRY, 2021–2023 (USD MILLION)
  • TABLE 39 CANADA: BIODEGRADABLE PLASTICS MARKET, BY END-USE INDUSTRY, 2024–2029 (USD MILLION)
  • TABLE 40 CANADA: BIODEGRADABLE PLASTICS MARKET, BY END-USE INDUSTRY, 2021–2023 (KILOTON)
  • TABLE 41 CANADA: BIODEGRADABLE PLASTICS MARKET, BY END-USE INDUSTRY, 2024–2029 (KILOTON)
  • TABLE 42 MEXICO: BIODEGRADABLE PLASTICS MARKET, BY END-USE INDUSTRY, 2021–2023 (USD MILLION)
  • TABLE 43 MEXICO: BIODEGRADABLE PLASTICS MARKET, BY END-USE INDUSTRY, 2024–2029 (USD MILLION)
  • TABLE 44 MEXICO: BIODEGRADABLE PLASTICS MARKET, BY END-USE INDUSTRY, 2021–2023 (KILOTON)
  • TABLE 45 MEXICO: BIODEGRADABLE PLASTICS MARKET, BY END-USE INDUSTRY, 2024–2029 (KILOTON)
  • TABLE 46 EUROPE: BIODEGRADABLE PLASTICS MARKET, BY COUNTRY, 2021–2023 (USD MILLION)
  • TABLE 47 EUROPE: BIODEGRADABLE PLASTICS MARKET, BY COUNTRY, 2024–2029 (USD MILLION)
  • TABLE 48 EUROPE: BIODEGRADABLE PLASTICS MARKET, BY COUNTRY, 2021–2023 (KILOTON)
  • TABLE 49 EUROPE: BIODEGRADABLE PLASTICS MARKET, BY COUNTRY, 2024–2029 (KILOTON)
  • TABLE 50 EUROPE: BIODEGRADABLE PLASTICS MARKET, BY END-USE INDUSTRY, 2021–2023 (USD MILLION)
  • TABLE 51 EUROPE: BIODEGRADABLE PLASTICS MARKET, BY END-USE INDUSTRY, 2024–2029 (USD MILLION)
  • TABLE 52 EUROPE: BIODEGRADABLE PLASTICS MARKET, BY END-USE INDUSTRY, 2021–2023 (KILOTON)
  • TABLE 53 EUROPE: BIODEGRADABLE PLASTICS MARKET, BY END-USE INDUSTRY, 2024–2029 (KILOTON)
  • TABLE 54 GERMANY: BIODEGRADABLE PLASTICS MARKET, BY END-USE INDUSTRY, 2021–2023 (USD MILLION)
  • TABLE 55 GERMANY: BIODEGRADABLE PLASTICS MARKET, BY END-USE INDUSTRY, 2024–2029 (USD MILLION)
  • TABLE 56 GERMANY: BIODEGRADABLE PLASTICS MARKET, BY END-USE INDUSTRY, 2021–2023 (KILOTON)
  • TABLE 57 GERMANY: BIODEGRADABLE PLASTICS MARKET, BY END-USE INDUSTRY, 2024–2029 (KILOTON)
  • TABLE 58 ITALY: BIODEGRADABLE PLASTICS MARKET, BY END-USE INDUSTRY, 2021–2023 (USD MILLION)
  • TABLE 59 ITALY: BIODEGRADABLE PLASTICS MARKET, BY END-USE INDUSTRY, 2024–2029 (USD MILLION)
  • TABLE 60 ITALY: BIODEGRADABLE PLASTICS MARKET, BY END-USE INDUSTRY, 2021–2023 (KILOTON)
  • TABLE 61 ITALY: BIODEGRADABLE PLASTICS MARKET, BY END-USE INDUSTRY, 2024–2029 (KILOTON)
  • TABLE 62 FRANCE: BIODEGRADABLE PLASTICS MARKET, BY END-USE INDUSTRY, 2021–2023 (USD MILLION)
  • TABLE 63 FRANCE: BIODEGRADABLE PLASTICS MARKET, BY END-USE INDUSTRY, 2024–2029 (USD MILLION)
  • TABLE 64 FRANCE: BIODEGRADABLE PLASTICS MARKET, BY END-USE INDUSTRY, 2021–2023 (KILOTON)
  • TABLE 65 FRANCE: BIODEGRADABLE PLASTICS MARKET, BY END-USE INDUSTRY, 2024–2029 (KILOTON)
  • TABLE 66 UK: BIODEGRADABLE PLASTICS MARKET, BY END-USE INDUSTRY, 2021–2023 (USD MILLION)
  • TABLE 67 UK: BIODEGRADABLE PLASTICS MARKET, BY END-USE INDUSTRY, 2024–2029 (USD MILLION)
  • TABLE 68 UK: BIODEGRADABLE PLASTICS MARKET, BY END-USE INDUSTRY, 2021–2023 (KILOTON)
  • TABLE 69 UK: BIODEGRADABLE PLASTICS MARKET, BY END-USE INDUSTRY, 2024–2029 (KILOTON)
  • TABLE 70 SPAIN: BIODEGRADABLE PLASTICS MARKET, BY END-USE INDUSTRY, 2021–2023 (USD MILLION)
  • TABLE 71 SPAIN: BIODEGRADABLE PLASTICS MARKET, BY END-USE INDUSTRY, 2024–2029 (USD MILLION)
  • TABLE 72 SPAIN: BIODEGRADABLE PLASTICS MARKET, BY END-USE INDUSTRY, 2021–2023 (KILOTON)
  • TABLE 73 SPAIN: BIODEGRADABLE PLASTICS MARKET, BY END-USE INDUSTRY, 2024–2029 (KILOTON)
  • TABLE 74 REST OF EUROPE: BIODEGRADABLE PLASTICS MARKET, BY END-USE INDUSTRY, 2021–2023 (USD MILLION)
  • TABLE 75 REST OF EUROPE: BIODEGRADABLE PLASTICS MARKET, BY END-USE INDUSTRY, 2024–2029 (USD MILLION)
  • TABLE 76 REST OF EUROPE: BIODEGRADABLE PLASTICS MARKET, BY END-USE INDUSTRY, 2021–2023 (KILOTON)
  • TABLE 77 REST OF EUROPE: BIODEGRADABLE PLASTICS MARKET, BY END-USE INDUSTRY, 2024–2029 (KILOTON)
  • TABLE 78 ASIA PACIFIC: BIODEGRADABLE PLASTICS MARKET, BY COUNTRY, 2021–2023 (USD MILLION)
  • TABLE 79 ASIA PACIFIC: BIODEGRADABLE PLASTICS MARKET, BY COUNTRY, 2024–2029 (USD MILLION)
  • TABLE 80 ASIA PACIFIC: BIODEGRADABLE PLASTICS MARKET, BY COUNTRY, 2021–2023 (KILOTON)
  • TABLE 81 ASIA PACIFIC: BIODEGRADABLE PLASTICS MARKET, BY COUNTRY, 2024–2029 (KILOTON)
  • TABLE 82 ASIA PACIFIC: BIODEGRADABLE PLASTICS MARKET, BY END-USE INDUSTRY, 2021–2023 (USD MILLION)
  • TABLE 83 ASIA PACIFIC: BIODEGRADABLE PLASTICS MARKET, BY END-USE INDUSTRY, 2024–2029 (USD MILLION)
  • TABLE 84 ASIA PACIFIC: BIODEGRADABLE PLASTICS MARKET, BY END-USE INDUSTRY, 2021–2023 (KILOTON)
  • TABLE 85 ASIA PACIFIC: BIODEGRADABLE PLASTICS MARKET, BY END-USE INDUSTRY, 2024–2029 (KILOTON)
  • TABLE 86 CHINA: BIODEGRADABLE PLASTICS MARKET, BY END-USE INDUSTRY, 2021–2023 (USD MILLION)
  • TABLE 87 CHINA: BIODEGRADABLE PLASTICS MARKET, BY END-USE INDUSTRY, 2024–2029 (USD MILLION)
  • TABLE 88 CHINA: BIODEGRADABLE PLASTICS MARKET, BY END-USE INDUSTRY, 2021–2023 (KILOTON)
  • TABLE 89 CHINA: BIODEGRADABLE PLASTICS MARKET, BY END-USE INDUSTRY, 2024–2029 (KILOTON)
  • TABLE 90 JAPAN: BIODEGRADABLE PLASTICS MARKET, BY END-USE INDUSTRY, 2021–2023 (USD MILLION)
  • TABLE 91 JAPAN: BIODEGRADABLE PLASTICS MARKET, BY END-USE INDUSTRY, 2024–2029 (USD MILLION)
  • TABLE 92 JAPAN: BIODEGRADABLE PLASTICS MARKET, BY END-USE INDUSTRY, 2021–2023 (KILOTON)
  • TABLE 93 JAPAN: BIODEGRADABLE PLASTICS MARKET, BY END-USE INDUSTRY, 2024–2029 (KILOTON)
  • TABLE 94 SOUTH KOREA: BIODEGRADABLE PLASTICS MARKET, BY END-USE INDUSTRY, 2021–2023 (USD MILLION)
  • TABLE 95 SOUTH KOREA: BIODEGRADABLE PLASTICS MARKET, BY END-USE INDUSTRY, 2024–2029 (USD MILLION)
  • TABLE 96 SOUTH KOREA: BIODEGRADABLE PLASTICS MARKET, BY END-USE INDUSTRY, 2021–2023 (KILOTON)
  • TABLE 97 SOUTH KOREA: BIODEGRADABLE PLASTICS MARKET, BY END-USE INDUSTRY, 2024–2029 (KILOTON)
  • TABLE 98 INDIA: BIODEGRADABLE PLASTICS MARKET, BY END-USE INDUSTRY, 2021–2023 (USD MILLION)
  • TABLE 99 INDIA: BIODEGRADABLE PLASTICS MARKET, BY END-USE INDUSTRY, 2024–2029 (USD MILLION)
  • TABLE 100 INDIA: BIODEGRADABLE PLASTICS MARKET, BY END-USE INDUSTRY, 2021–2023 (KILOTON)
  • TABLE 101 INDIA: BIODEGRADABLE PLASTICS MARKET, BY END-USE INDUSTRY, 2024–2029 (KILOTON)
  • TABLE 102 REST OF ASIA PACIFIC: BIODEGRADABLE PLASTICS MARKET, BY END-USE INDUSTRY, 2021–2023 (USD MILLION)
  • TABLE 103 REST OF ASIA PACIFIC: BIODEGRADABLE PLASTICS MARKET, BY END-USE INDUSTRY, 2024–2029 (USD MILLION)
  • TABLE 104 REST OF ASIA PACIFIC: BIODEGRADABLE PLASTICS MARKET, BY END-USE INDUSTRY, 2021–2023 (KILOTON)
  • TABLE 105 REST OF ASIA PACIFIC: BIODEGRADABLE PLASTICS MARKET, BY END-USE INDUSTRY, 2024–2029 (KILOTON)
  • TABLE 106 MIDDLE EAST & AFRICA: BIODEGRADABLE PLASTICS MARKET, BY COUNTRY, 2021–2023 (USD MILLION)
  • TABLE 107 MIDDLE EAST & AFRICA: BIODEGRADABLE PLASTICS MARKET, BY COUNTRY, 2024–2029 (USD MILLION)
  • TABLE 108 MIDDLE EAST & AFRICA: BIODEGRADABLE PLASTICS MARKET, BY COUNTRY, 2021–2023 (KILOTON)
  • TABLE 109 MIDDLE EAST & AFRICA: BIODEGRADABLE PLASTICS MARKET, BY COUNTRY, 2024–2029 (KILOTON)
  • TABLE 110 MIDDLE EAST & AFRICA: BIODEGRADABLE PLASTICS MARKET, BY END-USE INDUSTRY, 2021–2023 (USD MILLION)
  • TABLE 111 MIDDLE EAST & AFRICA: BIODEGRADABLE PLASTICS MARKET, BY END-USE INDUSTRY, 2024–2029 (USD MILLION)
  • TABLE 112 MIDDLE EAST & AFRICA: BIODEGRADABLE PLASTICS MARKET, BY END-USE INDUSTRY, 2021–2023 (KILOTON)
  • TABLE 113 MIDDLE EAST & AFRICA: BIODEGRADABLE PLASTICS MARKET, BY END-USE INDUSTRY, 2024–2029 (KILOTON)
  • TABLE 114 SAUDI ARABIA: BIODEGRADABLE PLASTICS MARKET, BY END-USE INDUSTRY, 2021–2023 (USD MILLION)
  • TABLE 115 SAUDI ARABIA: BIODEGRADABLE PLASTICS MARKET, BY END-USE INDUSTRY, 2024–2029 (USD MILLION)
  • TABLE 116 SAUDI ARABIA: BIODEGRADABLE PLASTICS MARKET, BY END-USE INDUSTRY, 2021–2023 (KILOTON)
  • TABLE 117 SAUDI ARABIA: BIODEGRADABLE PLASTICS MARKET, BY END-USE INDUSTRY, 2024–2029 (KILOTON)
  • TABLE 118 REST OF GCC: BIODEGRADABLE PLASTICS MARKET, BY END-USE INDUSTRY, 2021–2023 (USD MILLION)
  • TABLE 119 REST OF GCC: BIODEGRADABLE PLASTICS MARKET, BY END-USE INDUSTRY, 2024–2029 (USD MILLION)
  • TABLE 120 REST OF GCC: BIODEGRADABLE PLASTICS MARKET, BY END-USE INDUSTRY, 2021–2023 (KILOTON)
  • TABLE 121 REST OF GCC: BIODEGRADABLE PLASTICS MARKET, BY END-USE INDUSTRY, 2024–2029 (KILOTON)
  • TABLE 122 SOUTH AFRICA: BIODEGRADABLE PLASTICS MARKET, BY END-USE INDUSTRY, 2021–2023 (USD MILLION)
  • TABLE 123 SOUTH AFRICA: BIODEGRADABLE PLASTICS MARKET, BY END-USE INDUSTRY, 2024–2029 (USD MILLION)
  • TABLE 124 SOUTH AFRICA: BIODEGRADABLE PLASTICS MARKET, BY END-USE INDUSTRY, 2021–2023 (KILOTON)
  • TABLE 125 SOUTH AFRICA: BIODEGRADABLE PLASTICS MARKET, BY END-USE INDUSTRY, 2024–2029 (KILOTON)
  • TABLE 126 REST OF MIDDLE EAST & AFRICA: BIODEGRADABLE PLASTICS MARKET, BY END-USE INDUSTRY, 2021–2023 (USD MILLION)
  • TABLE 127 REST OF MIDDLE EAST & AFRICA: BIODEGRADABLE PLASTICS MARKET, BY END-USE INDUSTRY, 2024–2029 (USD MILLION)
  • TABLE 128 REST OF MIDDLE EAST & AFRICA: BIODEGRADABLE PLASTICS MARKET, BY END-USE INDUSTRY, 2021–2023 (KILOTON)
  • TABLE 129 REST OF MIDDLE EAST & AFRICA: BIODEGRADABLE PLASTICS MARKET, BY END-USE INDUSTRY, 2024–2029 (KILOTON)
  • TABLE 130 SOUTH AMERICA: BIODEGRADABLE PLASTICS MARKET, BY COUNTRY, 2021–2023 (USD MILLION)
  • TABLE 131 SOUTH AMERICA: BIODEGRADABLE PLASTICS MARKET, BY COUNTRY, 2024–2029 (USD MILLION)
  • TABLE 132 SOUTH AMERICA: BIODEGRADABLE PLASTICS MARKET, BY COUNTRY, 2021–2023 (KILOTON)
  • TABLE 133 SOUTH AMERICA: BIODEGRADABLE PLASTICS MARKET, BY COUNTRY, 2024–2029 (KILOTON)
  • TABLE 134 SOUTH AMERICA: BIODEGRADABLE PLASTICS MARKET, BY END-USE INDUSTRY, 2021–2023 (USD MILLION)
  • TABLE 135 SOUTH AMERICA: BIODEGRADABLE PLASTICS MARKET, BY END-USE INDUSTRY, 2024–2029 (USD MILLION)
  • TABLE 136 SOUTH AMERICA: BIODEGRADABLE PLASTICS MARKET, BY END-USE INDUSTRY, 2021–2023 (KILOTON)
  • TABLE 137 SOUTH AMERICA: BIODEGRADABLE PLASTICS MARKET, BY END-USE INDUSTRY, 2024–2029 (KILOTON)
  • TABLE 138 BRAZIL: BIODEGRADABLE PLASTICS MARKET, BY END-USE INDUSTRY, 2021–2023 (USD MILLION)
  • TABLE 139 BRAZIL: BIODEGRADABLE PLASTICS MARKET, BY END-USE INDUSTRY, 2024–2029 (USD MILLION)
  • TABLE 140 BRAZIL: BIODEGRADABLE PLASTICS MARKET, BY END-USE INDUSTRY, 2021–2023 (KILOTON)
  • TABLE 141 BRAZIL: BIODEGRADABLE PLASTICS MARKET, BY END-USE INDUSTRY, 2024–2029 (KILOTON)
  • TABLE 142 ARGENTINA: BIODEGRADABLE PLASTICS MARKET, BY END-USE INDUSTRY, 2021–2023 (USD MILLION)
  • TABLE 143 ARGENTINA: BIODEGRADABLE PLASTICS MARKET, BY END-USE INDUSTRY, 2024–2029 (USD MILLION)
  • TABLE 144 ARGENTINA: BIODEGRADABLE PLASTICS MARKET, BY END-USE INDUSTRY, 2021–2023 (KILOTON)
  • TABLE 145 ARGENTINA: BIODEGRADABLE PLASTICS MARKET, BY END-USE INDUSTRY, 2024–2029 (KILOTON)
  • TABLE 146 REST OF SOUTH AMERICA: BIODEGRADABLE PLASTICS MARKET, BY END-USE INDUSTRY, 2021–2023 (USD MILLION)
  • TABLE 147 REST OF SOUTH AMERICA: BIODEGRADABLE PLASTICS MARKET, BY END-USE INDUSTRY, 2024–2029 (USD MILLION)
  • TABLE 148 REST OF SOUTH AMERICA: BIODEGRADABLE PLASTICS MARKET, BY END-USE INDUSTRY, 2021–2023 (KILOTON)
  • TABLE 149 REST OF SOUTH AMERICA: BIODEGRADABLE PLASTICS MARKET, BY END-USE INDUSTRY, 2024–2029 (KILOTON)
  • TABLE 150 OVERVIEW OF STRATEGIES ADOPTED BY KEY PLAYERS IN BIODEGRADABLE PLASTICS MARKET BETWEEN 2019 AND 2024
  • TABLE 151 BIODEGRADABLE PLASTICS MARKET: DEGREE OF COMPETITION
  • TABLE 152 BIODEGRADABLE PLASTICS: TYPE FOOTPRINT
  • TABLE 153 BIODEGRADABLE PLASTICS: END-USE INDUSTRY FOOTPRINT
  • TABLE 154 BIODEGRADABLE PLASTICS: REGION FOOTPRINT
  • TABLE 155 BIODEGRADABLE PLASTICS MARKET: KEY STARTUPS/SMES
  • TABLE 156 BIODEGRADABLE PLASTICS MARKET: COMPETITIVE BENCHMARKING OF STARTUPS/SMES
  • TABLE 157 BIODEGRADABLE PLASTICS: PRODUCT LAUNCHES, MAY 2019–JUNE 2024
  • TABLE 158 BIODEGRADABLE PLASTICS: DEALS, MAY 2019–JUNE 2024
  • TABLE 159 BIODEGRADABLE PLASTICS MARKET: EXPANSIONS, JANUARY 2019–JUNE 2024
  • TABLE 160 NATUREWORKS LLC: COMPANY OVERVIEW
  • TABLE 161 NATUREWORKS LLC: PRODUCTS/SOLUTIONS/SERVICES OFFERED
  • TABLE 162 NATUREWORKS LLC: PRODUCT LAUNCHES, JANUARY 2019–JULY 2024
  • TABLE 163 NATUREWORKS LLC: DEALS, JANUARY 2019–JULY 2024
  • TABLE 164 NATUREWORKS LLC: EXPANSIONS, JANUARY 2019–JULY 2024
  • TABLE 165 BASF SE: COMPANY OVERVIEW
  • TABLE 166 BASF SE: PRODUCTS/SOLUTIONS/SERVICES OFFERED
  • TABLE 167 BASF SE: PRODUCT LAUNCHES, JANUARY 2019–JULY 2024
  • TABLE 168 BASF SE: DEALS, JANUARY 2019–JULY 2024
  • TABLE 169 TOTALENERGIES CORBION: COMPANY OVERVIEW
  • TABLE 170 TOTALENERGIES CORBION: PRODUCTS/SOLUTIONS/SERVICES OFFERED
  • TABLE 171 TOTALENERGIES CORBION: PRODUCT LAUNCHES, JANUARY 2019–JULY 2024
  • TABLE 172 TOTALENERGIES CORBION: DEALS, JANUARY 2019–JULY 2024
  • TABLE 173 TOTALENERGIES CORBION: EXPANSIONS, JANUARY 2019–JULY 2024
  • TABLE 174 MITSUBISHI CHEMICAL GROUP CORPORATION: COMPANY OVERVIEW
  • TABLE 175 MITSUBISHI CHEMICAL GROUP CORPORATION: PRODUCTS/SOLUTIONS/SERVICES OFFERED
  • TABLE 176 MITSUBISHI CHEMICAL GROUP CORPORATION.: OTHERS, JANUARY 2019–JULY 2024
  • TABLE 177 BIOME BIOPLASTICS: COMPANY OVERVIEW
  • TABLE 178 BIOME BIOPLASTICS: PRODUCTS/SOLUTIONS/SERVICES OFFERED
  • TABLE 179 BIOME BIOPLASTICS: DEALS, JANUARY 2019–JULY 2024
  • TABLE 180 BIOME BIOPLASTICS: OTHERS, JANUARY 2019–JULY 2024
  • TABLE 181 PLANTIC: COMPANY OVERVIEW
  • TABLE 182 PLANTIC: PRODUCTS/SOLUTIONS/SERVICES OFFERED
  • TABLE 183 FKUR: COMPANY OVERVIEW
  • TABLE 184 FKUR: PRODUCTS/SOLUTIONS/SERVICES OFFERED
  • TABLE 185 FKUR: DEALS, JANUARY 2019–JULY 2024
  • TABLE 186 FKUR: OTHERS, JANUARY 2019–JULY 2024
  • TABLE 187 DANIMER SCIENTIFIC: COMPANY OVERVIEW
  • TABLE 188 DANIMER SCIENTIFIC: PRODUCTS/SOLUTIONS/SERVICES OFFERED
  • TABLE 189 DANIMER SCIENTIFIC: DEALS, JANUARY 2019–JULY 2024
  • TABLE 190 DANIMER SCIENTIFIC: OTHERS, JANUARY 2019–JULY 2024
  • TABLE 191 TORAY INDUSTRIES, INC.: COMPANY OVERVIEW
  • TABLE 192 TORAY INDUSTRIES, INC.: PRODUCTS/SOLUTIONS/SERVICES OFFERED
  • TABLE 193 TORAY INDUSTRIES, INC.: DEALS, JANUARY 2019–JULY 2024
  • TABLE 194 NOVAMONT: COMPANY OVERVIEW
  • TABLE 195 NOVAMONT: PRODUCTS/SOLUTIONS/SERVICES OFFERED
  • TABLE 196 NOVAMONT: PRODUCT LAUNCHES, JANUARY 2019–JULY 2024
  • TABLE 197 NOVAMONT: EXPANSIONS, JANUARY 2019–JULY 2024
  • TABLE 198 BIO ON: COMPANY OVERVIEW
  • TABLE 199 ZHEJIANG HISUN BIOMATERIALS CO., LTD.: COMPANY OVERVIEW
  • TABLE 200 BIO-FED: COMPANY OVERVIEW
  • TABLE 201 GREEN DOT BIOPLASTICS: COMPANY OVERVIEW
  • TABLE 202 SPHERE: COMPANY OVERVIEW
  • TABLE 203 TIANAN BIOLOGIC MATERIALS CO., LTD.: COMPANY OVERVIEW
  • TABLE 204 SUCCINITY: COMPANY OVERVIEW
  • TABLE 205 CARBIOLICE: COMPANY OVERVIEW
  • TABLE 206 AGRANA: COMPANY OVERVIEW
  • TABLE 207 FUTERRO: COMPANY OVERVIEW
  • TABLE 208 EASTMAN CHEMICAL COMPANY: COMPANY OVERVIEW
  • TABLE 209 INGEVITY: COMPANY OVERVIEW
  • TABLE 210 PTT MCC BIOCHEM CO., LTD.: COMPANY OVERVIEW
  • TABLE 211 YIELD10 BIOSCIENCE, INC.: COMPANY OVERVIEW
  • TABLE 212 NATUR TEC: COMPANY OVERVIEW
LIST OF FIGURES
 
  • FIGURE 1 BIODEGRADABLE PLASTICS MARKET SEGMENTATION AND REGIONAL SCOPE
  • FIGURE 2 BIODEGRADABLE PLASTICS MARKET: RESEARCH DESIGN
  • FIGURE 3 MARKET SIZE ESTIMATION APPROACH: DEMAND SIDE
  • FIGURE 4 MARKET SIZE ESTIMATION: BOTTOM-UP APPROACH
  • FIGURE 5 MARKET SIZE ESTIMATION: TOP-DOWN APPROACH
  • FIGURE 6 BIODEGRADABLE PLASTICS MARKET: DATA TRIANGULATION
  • FIGURE 7 BIODEGRADABLE PLASTICS MARKET: FACTORS IMPACTING MARKET
  • FIGURE 8 PBS TYPE TO WITNESS FASTEST CAGR DURING FORECAST PERIOD
  • FIGURE 9 PACKAGING END-USE INDUSTRY TO REGISTER HIGHEST CAGR DURING FORECAST PERIOD
  • FIGURE 10 PACKAGING TO ACCOUNT FOR LARGEST MARKET SHARE DURING FORECAST PERIOD
  • FIGURE 11 EUROPE ACCOUNTED FOR LARGEST MARKET SHARE IN 2023
  • FIGURE 12 ASIA PACIFIC TO REGISTER FASTEST CAGR DURING FORECAST PERIOD
  • FIGURE 13 PLA TO BE FASTEST-GROWING SEGMENT DURING FORECAST PERIOD
  • FIGURE 14 PACKAGING TO ACCOUNT FOR LARGEST SHARE DURING FORECAST PERIOD
  • FIGURE 15 PACKAGING AND EUROPE ACCOUNTED FOR LARGEST MARKET SHARES IN 2023
  • FIGURE 16 INDIA TO REGISTER FASTEST CAGR DURING FORECAST PERIOD
  • FIGURE 17 DRIVERS, RESTRAINTS, OPPORTUNITIES, AND CHALLENGES IN BIODEGRADABLE PLASTICS MARKET
  • FIGURE 18 BIODEGRADABLE PLASTICS MARKET: PORTER’S FIVE FORCES ANALYSIS
  • FIGURE 19 INFLUENCE OF STAKEHOLDERS ON BUYING PROCESS, BY END-USE INDUSTRY
  • FIGURE 20 KEY BUYING CRITERIA, BY END-USE INDUSTRY
  • FIGURE 21 BIODEGRADABLE PLASTICS MARKET VALUE CHAIN
  • FIGURE 22 BIODEGRADABLE PLASTICS MARKET: ECOSYSTEM ANALYSIS
  • FIGURE 23 TRENDS/DISRUPTIONS IMPACTING CUSTOMER BUSINESS
  • FIGURE 24 COUNTRY-WISE IMPORT, 2020–2023 (USD MILLION)
  • FIGURE 25 COUNTRY-WISE EXPORT, 2020–2023 (USD MILLION)
  • FIGURE 26 AVERAGE SELLING PRICE BY REGION, 2021–2029 (USD/KG)
  • FIGURE 27 AVERAGE SELLING PRICE, BY TYPE, 2021–2029 (USD/KG)
  • FIGURE 28 AVERAGE SELLING PRICE, BY END-USE INDUSTRY, 2021–2029 (USD/KG)
  • FIGURE 29 AVERAGE SELLING PRICE, BY KEY PLAYER, 2021–2029 (USD/KG)
  • FIGURE 30 INVESTMENT AND FUNDING SCENARIO
  • FIGURE 31 GRANTED PATENTS ACCOUNTED FOR SIGNIFICANT SHARE OF BIODEGRADABLE PLASTICS MARKET
  • FIGURE 32 JURISDICTION ANALYSIS
  • FIGURE 33 PLA TO LEAD BIODEGRADABLE PLASTICS MARKET BETWEEN 2024 AND 2029
  • FIGURE 34 PACKAGING INDUSTRY TO DRIVE BIODEGRADABLE PLASTICS MARKET BETWEEN 2024 AND 2029
  • FIGURE 35 INDIA TO BE FASTEST-GROWING MARKET DURING FORECAST PERIOD
  • FIGURE 36 NORTH AMERICA: BIODEGRADABLE PLASTICS MARKET SNAPSHOT
  • FIGURE 37 EUROPE: BIODEGRADABLE PLASTICS MARKET SNAPSHOT
  • FIGURE 38 ASIA PACIFIC: BIODEGRADABLE PLASTICS MARKET SNAPSHOT
  • FIGURE 39 SHARE OF LEADING COMPANIES, 2023
  • FIGURE 40 REVENUE ANALYSIS OF KEY COMPANIES, 2019–2023
  • FIGURE 41 COMPANY VALUATION, 2023
  • FIGURE 42 FINANCIAL METRICS, 2023
  • FIGURE 43 BIODEGRADABLE PLASTICS: BRAND/PRODUCTION COMPARISON
  • FIGURE 44 BIODEGRADABLE PLASTICS: COMPANY EVALUATION MATRIX, KEY PLAYERS, 2023
  • FIGURE 45 BIODEGRADABLE PLASTICS: COMPANY OVERALL FOOTPRINT
  • FIGURE 46 BIODEGRADABLE PLASTICS MARKET: COMPANY EVALUATION MATRIX (STARTUPS/SMES), 2023
  • FIGURE 47 BASF SE: COMPANY SNAPSHOT
  • FIGURE 48 MITSUBISHI CHEMICAL GROUP CORPORATION: COMPANY SNAPSHOT
  • FIGURE 49 DANIMER SCIENTIFIC: COMPANY SNAPSHOT
  • FIGURE 50 TORAY INDUSTRIES, INC.: COMPANY SNAPSHOT


The study involved four major activities in estimating the market size of the biodegradable plastics market. Exhaustive secondary research was done to collect information on the market, the peer market, and the parent market. The next step was to validate these findings, assumptions, and sizing with industry experts across the value chain through primary research. Both top-down and bottom-up approaches were employed to estimate the complete market size. Thereafter, the market breakdown and data triangulation procedures were used to estimate the market size of the segments and subsegments.

Secondary Research

In the secondary research process, various secondary sources have been referred to for identifying and collecting information for this study. These secondary sources include annual reports, press releases, investor presentations of companies, corporate documents, white papers, certified publications, trade directories, certified publications, articles from recognized authors, associations, gold standard and silver standard websites, and databases.

Secondary research has been used to obtain key information about the value chain of the industry, monetary chain of the market, the total pool of key players, market classification and segmentation according to industry trends to the bottom-most level, and regional markets. It was also used to obtain information about the key developments from a market-oriented perspective.

Primary Research

The biodegradable plastics market comprises several stakeholders in the value chain, which include raw material suppliers, component manufacturers, manufacturers and end consumers. Various primary sources from the supply and demand sides of the biodegradable plastics market have been interviewed to obtain qualitative and quantitative information. The primary interviewees from the demand side include key opinion leaders in end-use sectors. The primary sources from the supply side include manufacturers, associations, and institutions involved in the biodegradable plastics industry.

Primary interviews were conducted to gather insights such as market statistics, data of revenue collected from the products and services, market breakdowns, market size estimations, market forecasting, and data triangulation. Primary research also helped in understanding the various trends related to type, end use industry and region. Stakeholders from the demand side, such as CIOs, CTOs, and CSOs were interviewed to understand the buyer’s perspective on the suppliers, products, component providers, and their current usage of biodegradable plastics and future outlook of their business which will affect the overall market.

The breakdown of profiles of the primary interviewees is illustrated in the figure below:
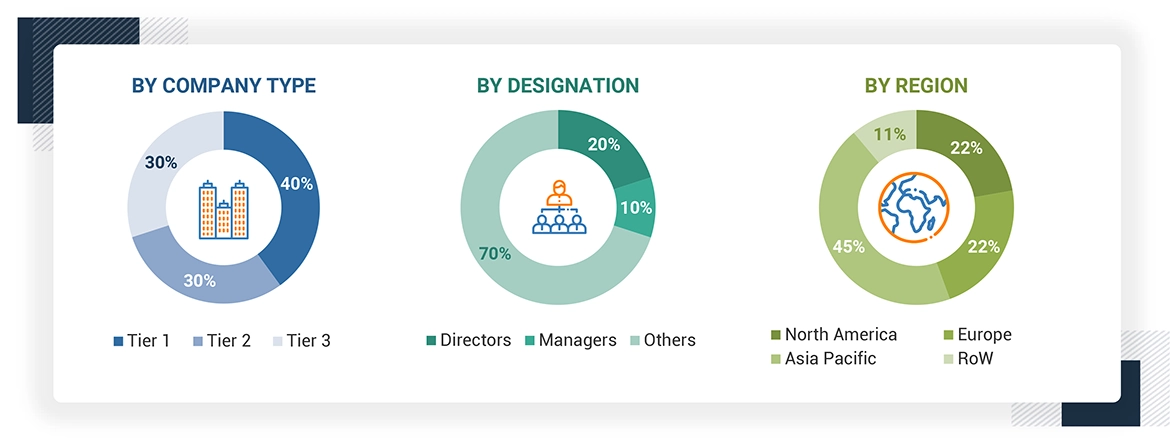
Note: Tier 1, Tier 2, and Tier 3 companies are classified based on their market revenue in 2023 available in the public domain, product portfolios, and geographical presence.

Other designations include sales representatives, production heads, and technicians.

To know about the assumptions considered for the study, download the pdf brochure

Market Size Estimation

The top-down approach was used to estimate and validate the size of various submarkets for biodegradable plastics for each region. The research methodology used to estimate the market size included the following steps:

  • The key players in the industry have been identified through extensive secondary research.
  • The supply chain of the industry has been determined through primary and secondary research.
  • The global market was then segmented into five major regions and validated by industry experts.
  • All percentage shares, splits, and breakdowns based on type, end use industry and region were determined using secondary sources and verified through primary sources.
  • All possible parameters that affect the markets covered in this research study were accounted for, viewed in extensive detail, verified through primary research, and analyzed to get the final quantitative and qualitative data. This data was consolidated and added with detailed inputs and analysis and presented in this report.

Source: Secondary Research, Interviews with Experts, and MarketsandMarkets Analysis

Data Triangulation

After arriving at the total market size from the estimation process of biodegradable plastics above, the overall market has been split into several segments and sub-segments. To complete the overall market engineering process and arrive at the exact statistics for all the segments and sub-segments, the data triangulation and market breakdown procedures have been employed, wherever applicable. The data has been triangulated by studying various factors and trends from both the demand and supply sides. Along with this, the market size has been validated by using both the top-down and bottom-up approaches and primary interviews. Hence, for every data segment, there have been three sources—top-down approach, bottom-up approach, and expert interviews. The data was assumed correct when the values arrived from the three sources matched.

Market Definition

Biodegradable plastics are polymers that degrade naturally by the action of microorganisms, within a specified time under environmental conditions, such as composting or soil burial, into nontoxic by-products like water, carbon dioxide, or biomass. These plastics are produced from renewable sources like plant starches, cellulose, or even specifically designed petrochemicals, are designed to be less harmful and more environment-friendly compared with traditional plastics since they provide a greener substitute for plastics to resolve the problems of plastic wastes and pollution.

Stakeholders

  • Biodegradable plastics Manufacturers
  • Raw Material Suppliers
  • Manufacturing Technology Providers
  • Industry Associations
  • Manufacturers in End-Use Industries

Report Objectives

  • To define, describe, and forecast the size of the biodegradable plastics market, in terms of value and volume.
  • To provide detailed information regarding the major factors (drivers, opportunities, restraints, and challenges) influencing the growth of the market.
  • To estimate and forecast the market size based on type, end use industry, and region.
  • To forecast the size of the market with respect to major regions, namely, Europe, North America, Asia Pacific, Middle East & Africa, and South America, along with their key countries.
  • To strategically analyze micromarkets1 with respect to individual growth trends, prospects, and their contribution to the overall market.
  • To analyze opportunities in the market for stakeholders and provide a competitive landscape of market leaders.
  • To track and analyze recent developments such as expansions, new product launches, partnerships & agreements, and acquisitions in the market.
  • To strategically profile key market players and comprehensively analyze their core competencies.

Previous Versions of this Report

Biodegradable Plastics Market by Type (PLA, Starch Blends, PHA, Biodegradable Polyesters), End Use Industry (Packaging, Consumer Goods, Textile, Agriculture & Horticulture), and Region( APAC, Europe, NA, South America, MEA) - Global Forecast to 2028

Report Code CH 2736
Published in Jul, 2023, By MarketsandMarkets™

Biodegradable Plastics Market by Type (PLA, Starch Blends, PHA, Biodegradable Polyesters), End Use Industry (Packaging, Consumer Goods, Textile, Agriculture & Horticulture), and Region (APAC, Europe, North America & RoW) - Global Forecast to 2026

Report Code CH 2736
Published in Sep, 2021, By MarketsandMarkets™

Biodegradable Plastics Market by Type (PLA, Starch Blends, Biodegradable Polyesters, PHA), End Use Industry (Packaging & Bags, Consumer Goods, Agriculture & Horticulture), and Region (APAC, Europe, North America, Rest of the World) - Global Forecast to 2023

Report Code CH 2736
Published in Oct, 2018, By MarketsandMarkets™

Biodegradable Plastics Market by Type (PLA, PHA, PBS, Starch-Based Plastics, Regenerated Cellulose, PCL), by Application (Packaging, Fibers, Agriculture, Injection Molding, and Others) - Global Trends & Forecasts to 2020

Report Code CH 2736
Published in Aug, 2015, By MarketsandMarkets™

Biodegradable Plastics Market by Type (PLA, PHA, PBS, Starch Based Plastics, Regenerated Cellulose, PCL), by Application (Packaging, Fibers, Agriculture, Injection Molding) - Global Trends and Forecasts to 2019

Report Code CH 2736
Published in Oct, 2014, By MarketsandMarkets™

Biodegradable Plastics Market by Type (PLA, PHA, PBS, Starch Based Plastics, Regenerated Cellulose, PCL), by Application (Packaging, Fibers, Agriculture, Injection Molding) - Global Trends and Forecasts to 2019

Report Code CH 2736
Published in Jan, 2011, By MarketsandMarkets™
"Our USP is "providing game-changing business opportunities reports with free customization" - so please feel free to provide us with your specific areas of interest / business challenges in much greater detail !!"

We appreciate your interest in this report. Once you fill out the form, you'll be immediately directed to an exclusive solution tailored to your needs. This high-value offering can help boost your revenue by 30% - a must-see opportunity for anyone looking to maximize growth.


By clicking the "Submit" button, you are agreeing to the Terms of Use and Privacy Policy.

Custom Market Research Services

We Will Customise The Research For You, In Case The Report Listed Above Does Not Meet With Your Requirements

Get 10% Free Customisation

Growth opportunities and latent adjacency in Biodegradable Plastics Market

DMCA.com Protection Status