Bioresorbable Polymers Market

Report Code CH 4342
Published in Nov, 2024, By MarketsandMarkets™
Download PDF

Choose License Type

Buy Report Now Inquire Before Buying

Bioresorbable Polymers Market by Type (Polylactic Acid (PLA), Polyglycolic Acid (PGA), Polylactic-co-glycolic acid (PLGA), Polycaprolactone) PCL), Application (Orthopedic Devices, Drug Delivery), and Region - Global Forecast to 2029

Overview

The global bioresorbable polymers market is valued at USD 500.0 million in 2024 and is projected to reach USD 867.2 million by 2029, growing at 11.6% cagr from 2024 to 2029. The orthopedic devices sector plays a significant role in the market for bioresorbable polymers, with a constant demand for materials that provide support for healing without the need for a second surgical intervention. Bioresorbable polymers such as PLA and PGA are utilized in screws, pins, and plates, and this is the largest benefit of the implants, in that they naturally degrade inside the body; thus, long-term complications, including stress shielding and infection, are minimized. Continuous developments in polymer technologies have increased the strength, degradation rates, and biocompatibility, and advances have accelerated their use in orthopedics due to the support for the market shift toward safer and more efficient patient-centric solutions.

Attractive Opportunities in the Bioresorbable Polymers Market

Asia Pacific

Market growth can be attributed to the strong healthcare industry in the region.

Rising demand from orthopedic devices sector is driving the global bioresorbable polymers market.

Mergers & acquisitions is expected to offer lucrative opportunities for market players in the next 5 years.

Asia Pacific is expected to be the highest growing market for bioresorbable polymers during the forecast period.

Market growth in Asia Pacific can be attributed to the growing geriatric population and investments in healthcare industry in emerging economies.

Global Bioresorbable Polymers Market Dynamics

Driver: Increasing number of surgical interventions

The World Bank Group predicts that in 2030, the number of surgeries worldwide is expected to reach 5,000 surgeries for every 100,000 people on an annual basis, dominated by road traffic injuries. Recently obtained WHO 2023 statistics indicate that every year across the globe, approximately 1.2 million people die due to road traffic accidents; however, between 20 to 50 million people also sustain non-fatal types of injuries that need surgical attention. Adults aged 65 years and above have a higher burden of chronic diseases, which is another factor for the increase in the number of surgical procedures performed. In both, emerging and developed economies, NCDs (Noncommunicable Diseases) represent over 87% of the disease burden. Alongside this, there has been an increase in the number of people seeking plastic and dental procedures, which is further creating demand for bioresorbable medical devices.

Restraints: Increasing preference for minimally invasive surgeries

The preference for minimally invasive surgeries is increasing due to the associated benefits, which include short stays in hospitals, faster recovery, minimal bleeding and pain. However, this shift in preference toward more minimally invasive procedures as opposed to the conventional mode of surgery has also resulted in the reduced demand for different kinds of medical devices, thereby limiting the growth of the market.

Laparoscopy is considered one of the most popular forms of minimally invasive surgeries in which several tiny incisions of 0.5-1.5 cm are made in the abdomen or pelvic area. This eliminates the need for a high number of stitches, which, in turn, reduces the demand for surgical sutures and decreases the consumption of bioresorbable polymers used in these sutures.


Opportunities: Electrospinning and 3D printing technology

Bioresorbable polymers, particularly in the case of electrospinning combined with 3D printing, are improving scaffold fabrication in tissue engineering in that scaffolds are more biocompatible and supportive to cells. Electrospinning produces thin fibrous elements representing the structure of the natural extracellular matrix (ECM) in order to enhance the cell attachment and growth required for the formation of the desired tissue. 3D printing also makes it possible to produce scaffolds as per specific patient needs, optimized according to the required dimensions, configurations, and biodegradation rates, which are important for regenerative medicine. The architecture of the detailed scaffold design enhances the tissue integration capacity, more so in the repair of bone and soft tissues. Because these polymers are designed to erode away in the body, the chances of the patient undergoing a removal surgery are significantly reduced, thus breathing new life into personalized medicine and creative treatment approaches.

Challenges: Stringent regulatory framework for medical devices

The innovation of bioresorbable medical devices is an expensive exercise, usually requiring more than 7–8 years to get the product on the market. In the US, for instance, the FDA requires manufacturers of bioabsorbable devices to obtain a Premarket Approval (PMA), which has several filing requirements and clinical trial data to be submitted with the filing. Developmental costs and high risks prohibit more than two-thirds of the products from ever advancing into the clinical trial stages. The burden of acquiring clinically meaningful trial data is also high. Smart polymers, which are bioresorbable, are considered Class II devices, and regulatory constraints impose a major bottleneck in the development and market entry of new bioresorbable polymers.

Global Bioresorbable Polymers Market Ecosystem Analysis

Prominent companies in this market include well-established, financially stable manufacturers of bioresorbable polymers. These companies have been in business for a while and have broad product portfolios, cutting-edge technologies, and wide international sales and marketing networks. Prominent companies in this market include Corbion (Netherlands), Evonik Industries AG (Germany), Foster Corporation (US), KLS Martin Group (Germany), DSM Biomedical (US), Ashland Global Holdings Inc. (US), Zeus Company LLC (US), Seqens (France), Reva Medical, LLC (US), and Poly-Med Incorporated (US).


Based on type, PLGA to be fastest-growing segment in bioresorbable polymers market during forecast period

PLGA (polylactic-co-glycolic acid) bioresorbable polymer has the highest demand in the market, primarily due to the wide range of applications, biocompatibility, and controlled degradation. The degradation time period of PLGA can be engineered by changing its lactic and glycolic acid ratio, allowing it to serve a multitude of medical purposes, from drug delivery systems to tissue engineering and surgical sutures. PLGA’s affordability, coupled with its FDA-approved use for various applications encourages its multifunctional utilization as it ensures safety and efficacy even under the strictest measures. The extensive use of PLGA in regenerative medicine and implants also favors its growth in the healthcare market due to the rising demand for advanced bioresorbable products.

Based on end-use industry, drug delivery to be fastest-growing segment in bioresorbable polymers market during forecast period

Among all existing applications of bioresorbable polymers, the drug delivery segment is projected to grow at the highest rate. Controlled drug release helps improve the effectiveness of treatment and patient compliance. These polymers have a gradual bioavailability that does not need removal,, thus reducing the risk of post-treatment complications. This means that they absolutely fit uses in biomedical applications such as those dealing with cancer, where the slow and sustained delivery of drugs helps in achieving better results. Above all, recent improvements in the polymer technology enable controlled release and drug eluting kinetics. The need for efficient, precise, and least invasive delivery systems, which are being provided owing to the emerging trends are contributing to the growth of this segment.

In terms of CAGR, Asia Pacific to lead bioresorbable polymers market during the forecast period

In terms of revenue growth, the Asia Pacific region is poised to lead the bioresorbable polymers market. The rapid growth is attributed to the increase in healthcare spending, rise in the number of chronic diseases, and the growing need for advanced healthcare technologies. The expanding pharmaceutical and medical devices market, as well as rapid economic development in countries such as China, India, and Southeast Asian countries, is, however, crucial. In the region, patients are also becoming increasingly aware of minimally invasive surgeries as well as the benefits of bioresorbable polymers, such as low surgical complications and reduced length of stay in hospitals. Additional government backing in the form of policies, research funding, and investments in healthcare systems also enhance the growth of the market. Global and local manufacturers’ know-how and manufacturer exemptions also contribute to innovative developments and market expansion in the region.

HIGHEST CAGR MARKET IN 2024-2029
INDIA FASTEST GROWING MARKET IN THE REGION

Recent Developments of Bioresorbable Polymers Market

  • In August 2024, Ashland’s expanded Irish facility boosts bioresorbable polymer production, enhancing the production of the injectable technology to meet the rising demand for advanced pharmaceutical applications, including long-acting formulations, bioresorbable devices, and tissue engineering solutions.
  • In April 2024, Evonik expanded its RESOMER powder biomaterial production facility in Germany, adding the solvent-free micronization technology to offer customized medical powders for implants and esthetic applications.
  • In August 2021, Evonik acquired the German biotech JeNaCell, to expand its biomaterials portfolio, integrating innovative cellulose-based materials for wound care, dermatology, and medical technology into its Health Care division.
  • In September 2020, Corbion and Total announced building a new PLA bioplastics plant in Europe through their Total Corbion PLA joint venture. The plant is expected to have a capacity of 100,000 tons per annum, being the first global-scale PLA production facility in Europe. The new plant is planned to be located in France and be operational in 2024. This additional PLA investment is expected to accelerate plans to further expand the production of lactic acid.

Key Market Players

KEY PLAYERS IN THE BIORESORBABLE POLYMERS MARKET INCLUDE

Want to explore hidden markets that can drive new revenue in Bioresorbable Polymers Market?

Scope of the Report

Report Metric Details
Years considered for the study 2019-2029
Base Year Considered 2023
Forecast period 2024-2029
Units considered Value (USD Million) and Volume (Unit)
Segments covered Type, Application, and Region
Geographies covered Asia Pacific, Europe, North America, Middle East & Africa, and South America

Key Questions Addressed by the Report

Who are the major players in the bioresorbable polymers market?
The key players in this market include Corbion (Netherlands), Evonik Industries AG (Germany), Foster Corporation (US), KLS Martin Group (Germany), DSM Biomedical (US), Ashland Global Holdings Inc. (US), Zeus Company LLC (US), Seqens (France), Reva Medical, LLC (US), and Poly-Med Incorporated (US).
What are the drivers and opportunities for the bioresorbable polymers market?
The increasing number of surgical interventions is the major driver for the bioresorbable polymers market. Electrospinning and the 3D printing technology are expected to create new opportunities for the market.
Which strategies are the key players focusing upon in the bioresorbable polymers market?
Product launches, acquisitions, and expansions are some of the strategies adopted by the key players to expand their global presence.
What is expected to be the CAGR of the bioresorbable polymers market during the forecast period?
The market is projected to grow at a CAGR of 11.6% in terms of value during the forecast period.
Which major factors are expected to restrain the growth of the bioresorbable polymers market during the forecast period?
The increasing preference for minimally invasive surgeries is expected to restrict market growth during the forecast period.

Personalize This Research

  • Triangulate with your Own Data
  • Get Data as per your Format and Definition
  • Gain a Deeper Dive on a Specific Application, Geography, Customer or Competitor
  • Any level of Personalization
Request A Free Customisation

Let Us Help You

  • What are the Known and Unknown Adjacencies Impacting the Bioresorbable Polymers Market
  • What will your New Revenue Sources be?
  • Who will be your Top Customer; what will make them switch?
  • Defend your Market Share or Win Competitors
  • Get a Scorecard for Target Partners
Customized Workshop Request

Table of Contents

Exclusive indicates content/data unique to MarketsandMarkets and not available with any competitors.

TITLE
PAGE NO
INTRODUCTION
23
RESEARCH METHODOLOGY
29
EXECUTIVE SUMMARY
42
PREMIUM INSIGHTS
46
MARKET OVERVIEW
49
  • 5.1 INTRODUCTION
  • 5.2 MARKET DYNAMICS
    DRIVERS
    - Increasing number of surgical interventions
    - Rising demand for biocompatible medical devices
    - Growing demand for drug delivery applications
    - Favorable reimbursement scenario
    RESTRAINTS
    - Increasing preference for minimally invasive surgeries
    - Higher cost of bioresorbable polymers than conventional polymers
    - Lack of quality control measures in emerging countries
    OPPORTUNITIES
    - Electrospinning and 3D printing technologies
    CHALLENGES
    - Stringent regulatory framework for medical devices
    - Requirement of skilled personnel for effective use of bioresorbable medical products
  • 5.3 PORTER’S FIVE FORCES ANALYSIS
    THREAT OF NEW ENTRANTS
    THREAT OF SUBSTITUTES
    BARGAINING POWER OF SUPPLIERS
    BARGAINING POWER OF BUYERS
    INTENSITY OF COMPETITIVE RIVALRY
  • 5.4 KEY STAKEHOLDERS AND BUYING CRITERIA
    KEY STAKEHOLDERS IN BUYING PROCESS
    BUYING CRITERIA
  • 5.5 MACROECONOMIC INDICATORS
    GDP TRENDS AND FORECAST OF MOST PROMINENT ECONOMIES
INDUSTRY TRENDS
60
  • 6.1 SUPPLY CHAIN ANALYSIS
    RAW MATERIAL SUPPLIERS
    MANUFACTURERS
    DISTRIBUTORS
    END-USE INDUSTRIES
  • 6.2 PRICING ANALYSIS
    AVERAGE SELLING PRICE TREND OF KEY PLAYERS, BY APPLICATION
    AVERAGE SELLING PRICE TREND, BY REGION
  • 6.3 TRENDS/DISRUPTIONS IMPACTING CUSTOMER BUSINESS
  • 6.4 ECOSYSTEM ANALYSIS
  • 6.5 TECHNOLOGY ANALYSIS
    KEY TECHNOLOGIES
    - Electrospinning technology in bioresorbable polymers
    COMPLEMENTARY TECHNOLOGIES
    - Melt extrusion technology
  • 6.6 CASE STUDY ANALYSIS
    BIORESORBABLE POLYMER SCAFFOLDS FOR TISSUE ENGINEERING
    BIORESORBABLE MATERIALS FOR CARDIOVASCULAR DEVICES
    BIORESORBABLE 3D-PRINTED PATIENT-SPECIFIC IMPLANTS FOR CRANIO-MAXILLOFACIAL SURGERY
  • 6.7 TRADE ANALYSIS
    IMPORT SCENARIO (HS CODE 390770)
    EXPORT SCENARIO (HS CODE 390770)
  • 6.8 REGULATORY LANDSCAPE
    REGULATORY BODIES, GOVERNMENT AGENCIES, AND OTHER ORGANIZATIONS
    REGULATORY FRAMEWORK
    - Regulations impacting bioresorbable polymers business
    - FDA guidelines for bioabsorbable polymers in medical devices
    - REACH (Registration, evaluation, authorization and restriction of chemicals)
    - ISO 10993 (Biological evaluation of medical devices)
    - EU medical device regulation (MDR) for bioresorbable polymers
    - ASTM standards for absorbable polymers and implants
  • 6.9 KEY CONFERENCES AND EVENTS, 2024–2025
  • 6.10 INVESTMENT AND FUNDING SCENARIO
  • 6.11 PATENT ANALYSIS
    APPROACH
    PATENT TYPES
    TOP APPLICANTS
    JURISDICTION ANALYSIS
  • 6.12 IMPACT OF AI/GEN AI ON BIORESORBABLE POLYMERS MARKET
BIORESORBABLE POLYMERS MARKET, BY TYPE
83
  • 7.1 INTRODUCTION
  • 7.2 POLYLACTIC ACID (PLA)
    RISING DEMAND FOR ORTHOPEDIC DEVICES TO DRIVE MARKET
  • 7.3 POLYGLYCOLIC ACID (PGA)
    USE IN SUTURES AND OTHER MEDICAL IMPLANTS TO PROPEL MARKET
  • 7.4 POLY (LACTIC-CO-GLYCOLIC ACID) (PLGA)
    BIOCOMPATIBILITY AND BIODEGRADABILITY TO DRIVE MARKET
  • 7.5 POLYCAPROLACTONE (PCL)
    DRUG DELIVERY, TISSUE ENGINEERING, AND ORTHOPEDIC DEVICE APPLICATIONS TO DRIVE MARKET
  • 7.6 OTHER TYPES
BIORESORBABLE POLYMERS MARKET, BY APPLICATION
97
  • 8.1 INTRODUCTION
  • 8.2 ORTHOPEDIC DEVICES
    HIGH CONSUMPTION IN NORTH AMERICA AND EUROPE TO DRIVE MARKET
  • 8.3 DRUG DELIVERY
    SIGNIFICANT DEMAND FOR ORAL CAPSULES TO DRIVE MARKET
  • 8.4 OTHER APPLICATIONS
BIORESORBABLE POLYMERS MARKET, BY REGION
110
  • 9.1 INTRODUCTION
  • 9.2 NORTH AMERICA
    US
    - Growing demand for orthopedic devices and drug delivery applications to drive market
    CANADA
    - Increasing geriatric population to boost demand
    MEXICO
    - Rising medical tourism to propel market growth
  • 9.3 ASIA PACIFIC
    CHINA
    - Economic growth to be major driver for market growth
    JAPAN
    - Rapidly aging population to drive market
    INDIA
    - Growing pharmaceutical and medical industries to drive market
    SOUTH KOREA
    - Increasing access to healthcare facilities to drive market
  • 9.4 EUROPE
    GERMANY
    - Established healthcare industry and technological advancements offer opportunities for market growth
    UK
    - Increasing healthcare expenditure to drive market growth
    ITALY
    - Orthopedic and pharmaceutical applications to propel market
    FRANCE
    - Initiatives to boost healthcare sector to drive demand
    RUSSIA
    - Orthopedics, healthcare, and pharmaceutical segments contribute significantly to market growth
  • 9.5 MIDDLE EAST & AFRICA
    MIDDLE EAST
    - Improving healthcare infrastructure to drive market
    AFRICA
    - South Africa to be largest market
  • 9.6 SOUTH AMERICA
    BRAZIL
    - Rising demand for implants in surgeries to drive market
    ARGENTINA
    - Investments by major players to drive market
COMPETITIVE LANDSCAPE
163
  • 10.1 INTRODUCTION
  • 10.2 KEY PLAYER STRATEGIES/RIGHT TO WIN
  • 10.3 MARKET SHARE ANALYSIS
  • 10.4 REVENUE ANALYSIS
  • 10.5 COMPANY EVALUATION MATRIX: KEY PLAYERS, 2023
    STARS
    EMERGING LEADERS
    PERVASIVE PLAYERS
    PARTICIPANTS
    COMPANY FOOTPRINT: KEY PLAYERS, 2023
    - Company footprint
    - Type footprint
    - Application footprint
    - Region footprint
  • 10.6 COMPANY EVALUATION MATRIX: STARTUPS/SMES, 2023
    PROGRESSIVE COMPANIES
    RESPONSIVE COMPANIES
    DYNAMIC COMPANIES
    STARTING BLOCKS
    COMPETITIVE BENCHMARKING: STARTUPS/SMES, 2023
    - Detailed list of key startups/SMEs
    - Competitive benchmarking of key startups/SMEs
  • 10.7 BRAND/PRODUCT COMPARISON
  • 10.8 COMPANY VALUATION AND FINANCIAL METRICS
  • 10.9 COMPETITIVE SCENARIO
    PRODUCT LAUNCHES
    DEALS
    EXPANSIONS
COMPANY PROFILES
182
  • 11.1 KEY PLAYERS
    CORBION
    - Business overview
    - Products/Solutions/Services offered
    - Recent developments
    - MnM view
    EVONIK INDUSTRIES AG
    - Business overview
    - Products/Solutions/Services offered
    - Recent developments
    - MnM view
    FOSTER CORPORATION
    - Business overview
    - Products/Solutions/Services offered
    - MnM view
    KLS MARTIN GROUP
    - Business overview
    - Products/Solutions/Services offered
    - MnM view
    DSM BIOMEDICAL
    - Business overview
    - Products/Solutions/Services offered
    - MnM view
    ASHLAND GLOBAL HOLDINGS INC.
    - Business overview
    - Products/Solutions/Services offered
    - Recent developments
    ZEUS COMPANY LLC
    - Business overview
    - Products/Solutions/Services offered
    - Recent developments
    SEQENS
    - Business overview
    - Products/Solutions/Services offered
    REVA MEDICAL, LLC
    - Business overview
    - Products/Solutions/Services offered
    POLY-MED INCORPORATED
    - Business overview
    - Products/Solutions/Services offered
  • 11.2 OTHER PLAYERS
    BEZWADA BIOMEDICAL, LLC
    NOMISMA HEALTHCARE PVT. LTD.
    BMG INC.
    POLYSCIENCES, INC.
    HUIZHOU FORYOU MEDICAL DEVICES CO., LTD.
    MUSASHINO CHEMICAL LABORATORY, LTD.
    HENAN XINGHAN BIOLOGICAL TECHNOLOGY CO., LTD.
ADJACENT AND RELATED MARKETS
210
  • 12.1 INTRODUCTION
  • 12.2 LIMITATIONS
  • 12.3 POLY LACTIC ACID MARKET
    MARKET DEFINITION
    MARKET OVERVIEW
  • 12.4 POLY LACTIC ACID MARKET, BY REGION
    EUROPE
    NORTH AMERICA
    ASIA PACIFIC
    SOUTH AMERICA
    MIDDLE EAST & AFRICA
APPENDIX
215
  • 13.1 DISCUSSION GUIDE
  • 13.2 KNOWLEDGESTORE: MARKETSANDMARKETS’ SUBSCRIPTION PORTAL
  • 13.3 CUSTOMIZATION OPTIONS
  • 13.4 RELATED REPORTS
  • 13.5 AUTHOR DETAILS
LIST OF TABLES
 
  • TABLE 1 USD EXCHANGE RATES CONSIDERED, 2020–2023
  • TABLE 2 BIORESORBABLE POLYMERS MARKET: RISK ASSESSMENT
  • TABLE 3 TOTAL EXPENDITURE ON HEALTH, BY COUNTRY, 2015–2021 (% OF GDP)
  • TABLE 4 BIORESORBABLE POLYMERS MARKET: PORTER’S FIVE FORCES ANALYSIS
  • TABLE 5 INFLUENCE OF STAKEHOLDERS ON BUYING PROCESS FOR TOP THREE TYPES (%)
  • TABLE 6 KEY BUYING CRITERIA FOR TOP THREE TYPES
  • TABLE 7 GDP TRENDS AND FORECAST, BY KEY COUNTRY, 2021–2029 (USD BILLION)
  • TABLE 8 AVERAGE SELLING PRICE TREND OF BIORESORBABLE POLYMERS OFFERED BY KEY PLAYERS, BY APPLICATION, 2023 (USD/KG)
  • TABLE 9 AVERAGE SELLING PRICE TREND OF BIORESORBABLE POLYMERS, BY REGION, 2021–2029 (USD/KG)
  • TABLE 10 ROLES OF COMPANIES IN BIORESORBABLE POLYMERS ECOSYSTEM
  • TABLE 11 IMPORT DATA FOR HS CODE 390770-COMPLIANT PRODUCTS, BY REGION, 2019–2023 (USD THOUSAND)
  • TABLE 12 EXPORT DATA FOR HS CODE 390770-COMPLIANT PRODUCTS, BY REGION, 2019–2023 (USD THOUSAND)
  • TABLE 13 GLOBAL: REGULATORY BODIES, GOVERNMENT AGENCIES, AND OTHER ORGANIZATIONS
  • TABLE 14 NORTH AMERICA: REGULATORY BODIES, GOVERNMENT AGENCIES, AND OTHER ORGANIZATIONS
  • TABLE 15 EUROPE: REGULATORY BODIES, GOVERNMENT AGENCIES, AND OTHER ORGANIZATIONS
  • TABLE 16 ASIA PACIFIC: REGULATORY BODIES, GOVERNMENT AGENCIES, AND OTHER ORGANIZATIONS
  • TABLE 17 SOUTH AMERICA: REGULATORY BODIES, GOVERNMENT AGENCIES, AND OTHER ORGANIZATIONS
  • TABLE 18 MIDDLE EAST & AFRICA: REGULATORY BODIES, GOVERNMENT AGENCIES, AND OTHER ORGANIZATIONS
  • TABLE 19 BIORESORBABLE POLYMERS: LIST OF KEY CONFERENCES AND EVENTS, 2024–2025
  • TABLE 20 BIORESORBABLE POLYMERS MARKET: FUNDING/INVESTMENT SCENARIO
  • TABLE 21 BIORESORBABLE POLYMERS MARKET: PATENT STATUS, 2014–2024
  • TABLE 22 LIST OF MAJOR PATENTS FOR BIORESORBABLE POLYMERS, 2014–2024
  • TABLE 23 PATENTS BY GORE & ASSOCIATES, 2014–2024
  • TABLE 24 PATENTS BY KCI LICENSING INC., 2014–2024
  • TABLE 25 PATENTS BY LOCKE CHRISTOPHER BRIAN, 2014–2024
  • TABLE 26 TOP 10 PATENT OWNERS IN US, 2014–2024
  • TABLE 27 BIORESORBABLE POLYMERS MARKET, BY TYPE, 2017–2022 (USD MILLION)
  • TABLE 28 BIORESORBABLE POLYMERS MARKET, BY TYPE, 2023–2029 (USD MILLION)
  • TABLE 29 BIORESORBABLE POLYMERS MARKET, BY TYPE, 2017–2022 (TON)
  • TABLE 30 BIORESORBABLE POLYMERS MARKET, BY TYPE, 2023–2029 (TON)
  • TABLE 31 PLA-BASED BIORESORBABLE POLYMERS MARKET, BY REGION, 2017–2022 (USD MILLION)
  • TABLE 32 PLA-BASED BIORESORBABLE POLYMERS MARKET, BY REGION, 2023–2029 (USD MILLION)
  • TABLE 33 PLA-BASED BIORESORBABLE POLYMERS MARKET, BY REGION, 2017–2022 (TON)
  • TABLE 34 PLA-BASED BIORESORBABLE POLYMERS MARKET, BY REGION, 2023–2029 (TON)
  • TABLE 35 PGA-BASED BIORESORBABLE POLYMERS MARKET, BY REGION, 2017–2022 (USD MILLION)
  • TABLE 36 PGA-BASED BIORESORBABLE POLYMERS MARKET, BY REGION, 2023–2029 (USD MILLION)
  • TABLE 37 PGA-BASED BIORESORBABLE POLYMERS MARKET, BY REGION, 2017–2022 (TON)
  • TABLE 38 PGA-BASED BIORESORBABLE POLYMERS MARKET, BY REGION, 2023–2029 (TON)
  • TABLE 39 PLGA-BASED BIORESORBABLE POLYMERS MARKET, BY REGION, 2017–2022 (USD MILLION)
  • TABLE 40 PLGA-BASED BIORESORBABLE POLYMERS MARKET, BY REGION, 2023–2029 (USD MILLION)
  • TABLE 41 PLGA-BASED BIORESORBABLE POLYMERS MARKET, BY REGION, 2017–2022 (TON)
  • TABLE 42 PLGA-BASED BIORESORBABLE POLYMERS MARKET, BY REGION, 2023–2029 (TON)
  • TABLE 43 PCL-BASED BIORESORBABLE POLYMERS MARKET, BY REGION, 2017–2022 (USD MILLION)
  • TABLE 44 PCL-BASED BIORESORBABLE POLYMERS MARKET, BY REGION, 2023–2029 (USD MILLION)
  • TABLE 45 PCL-BASED BIORESORBABLE POLYMERS MARKET, BY REGION, 2017–2022 (TON)
  • TABLE 46 PCL-BASED BIORESORBABLE POLYMERS MARKET, BY REGION, 2023–2029 (TON)
  • TABLE 47 OTHER BIORESORBABLE POLYMER TYPES MARKET, BY REGION, 2017–2022 (USD MILLION)
  • TABLE 48 OTHER BIORESORBABLE POLYMER TYPES MARKET, BY REGION, 2023–2029 (USD MILLION)
  • TABLE 49 OTHER BIORESORBABLE POLYMER TYPES MARKET, BY REGION, 2017–2022 (TON)
  • TABLE 50 OTHER BIORESORBABLE POLYMER TYPES MARKET, BY REGION, 2023–2029 (TON)
  • TABLE 51 BIORESORBABLE POLYMERS MARKET, BY APPLICATION, 2017–2022 (USD MILLION)
  • TABLE 52 BIORESORBABLE POLYMERS MARKET, BY APPLICATION, 2023–2029 (USD MILLION)
  • TABLE 53 BIORESORBABLE POLYMERS MARKET, BY APPLICATION, 2017–2022 (TON)
  • TABLE 54 BIORESORBABLE POLYMERS MARKET, BY APPLICATION, 2023–2029 (TON)
  • TABLE 55 BIORESORBABLE POLYMERS MARKET IN ORTHOPEDIC DEVICES, BY REGION, 2017–2022 (USD MILLION)
  • TABLE 56 BIORESORBABLE POLYMERS MARKET IN ORTHOPEDIC DEVICES, BY REGION, 2023–2029 (USD MILLION)
  • TABLE 57 BIORESORBABLE POLYMERS MARKET IN ORTHOPEDIC DEVICES, BY REGION, 2017–2022 (TON)
  • TABLE 58 BIORESORBABLE POLYMERS MARKET IN ORTHOPEDIC DEVICES, BY REGION, 2023–2029 (TON)
  • TABLE 59 BIORESORBABLE POLYMERS MARKET IN ORTHOPEDIC DEVICES, BY APPLICATION, 2017–2022 (USD MILLION)
  • TABLE 60 BIORESORBABLE POLYMERS MARKET IN ORTHOPEDIC DEVICES, BY APPLICATION, 2023–2029 (USD MILLION)
  • TABLE 61 BIORESORBABLE POLYMERS MARKET IN ORTHOPEDIC DEVICES, BY APPLICATION, 2017–2022 (TON)
  • TABLE 62 BIORESORBABLE POLYMERS MARKET IN ORTHOPEDIC DEVICES, BY APPLICATION, 2023–2029 (TON)
  • TABLE 63 BIORESORBABLE POLYMERS MARKET IN DRUG DELIVERY, BY REGION, 2017–2022 (USD MILLION)
  • TABLE 64 BIORESORBABLE POLYMERS MARKET IN DRUG DELIVERY, BY REGION, 2023–2029 (USD MILLION)
  • TABLE 65 BIORESORBABLE POLYMERS MARKET IN DRUG DELIVERY, BY REGION, 2017–2022 (TON)
  • TABLE 66 BIORESORBABLE POLYMERS MARKET IN DRUG DELIVERY, BY REGION, 2023–2029 (TON)
  • TABLE 67 BIORESORBABLE POLYMERS MARKET IN DRUG DELIVERY, BY APPLICATION, 2017–2022 (USD MILLION)
  • TABLE 68 BIORESORBABLE POLYMERS MARKET IN DRUG DELIVERY, BY APPLICATION, 2023–2029 (USD MILLION)
  • TABLE 69 BIORESORBABLE POLYMERS MARKET IN DRUG DELIVERY, BY APPLICATION, 2017–2022 (TON)
  • TABLE 70 BIORESORBABLE POLYMERS MARKET IN DRUG DELIVERY, BY APPLICATION, 2023–2029 (TON)
  • TABLE 71 BIORESORBABLE POLYMERS MARKET IN OTHER APPLICATIONS, BY REGION, 2017–2022 (USD MILLION)
  • TABLE 72 BIORESORBABLE POLYMERS MARKET IN OTHER APPLICATIONS, BY REGION, 2023–2029 (USD MILLION)
  • TABLE 73 BIORESORBABLE POLYMERS MARKET IN OTHER APPLICATIONS, BY REGION, 2017–2022 (TON)
  • TABLE 74 BIORESORBABLE POLYMERS MARKET IN OTHER APPLICATIONS, BY REGION, 2023–2029 (TON)
  • TABLE 75 BIORESORBABLE POLYMERS MARKET, BY REGION, 2017–2022 (USD MILLION)
  • TABLE 76 BIORESORBABLE POLYMERS MARKET, BY REGION, 2023–2029 (USD MILLION)
  • TABLE 77 BIORESORBABLE POLYMERS MARKET, BY REGION, 2017–2022 (TON)
  • TABLE 78 BIORESORBABLE POLYMERS MARKET, BY REGION, 2023–2029 (TON)
  • TABLE 79 NORTH AMERICA: BIORESORBABLE POLYMERS MARKET, BY TYPE, 2017–2022 (USD MILLION)
  • TABLE 80 NORTH AMERICA: BIORESORBABLE POLYMERS MARKET, BY TYPE, 2023–2029 (USD MILLION)
  • TABLE 81 NORTH AMERICA: BIORESORBABLE POLYMERS MARKET, BY TYPE, 2017–2022 (TON)
  • TABLE 82 NORTH AMERICA: BIORESORBABLE POLYMERS MARKET, BY TYPE, 2023–2029 (TON)
  • TABLE 83 NORTH AMERICA: BIORESORBABLE POLYMERS MARKET, BY APPLICATION, 2017–2022 (USD MILLION)
  • TABLE 84 NORTH AMERICA: BIORESORBABLE POLYMERS MARKET, BY APPLICATION, 2023–2029 (USD MILLION)
  • TABLE 85 NORTH AMERICA: BIORESORBABLE POLYMERS MARKET, BY APPLICATION, 2017–2022 (TON)
  • TABLE 86 NORTH AMERICA: BIORESORBABLE POLYMERS MARKET, BY APPLICATION, 2023–2029 (TON)
  • TABLE 87 NORTH AMERICA: BIORESORBABLE POLYMERS MARKET, BY COUNTRY, 2017–2022 (USD MILLION)
  • TABLE 88 NORTH AMERICA: BIORESORBABLE POLYMERS MARKET, BY COUNTRY, 2023–2029 (USD MILLION)
  • TABLE 89 NORTH AMERICA: BIORESORBABLE POLYMERS MARKET, BY COUNTRY, 2017–2022 (TON)
  • TABLE 90 NORTH AMERICA: BIORESORBABLE POLYMERS MARKET, BY COUNTRY, 2023–2029 (TON)
  • TABLE 91 US: BIORESORBABLE POLYMERS MARKET, BY APPLICATION, 2017–2022 (USD MILLION)
  • TABLE 92 US: BIORESORBABLE POLYMERS MARKET, BY APPLICATION, 2023–2029 (USD MILLION)
  • TABLE 93 US: BIORESORBABLE POLYMERS MARKET, BY APPLICATION, 2017–2022 (TON)
  • TABLE 94 US: BIORESORBABLE POLYMERS MARKET, BY APPLICATION, 2023–2029 (TON)
  • TABLE 95 CANADA: BIORESORBABLE POLYMERS MARKET, BY APPLICATION, 2017–2022 (USD MILLION)
  • TABLE 96 CANADA: BIORESORBABLE POLYMERS MARKET, BY APPLICATION, 2023–2029 (USD MILLION)
  • TABLE 97 CANADA: BIORESORBABLE POLYMERS MARKET, BY APPLICATION, 2017–2022 (TON)
  • TABLE 98 CANADA: BIORESORBABLE POLYMERS MARKET, BY APPLICATION, 2023–2029 (TON)
  • TABLE 99 MEXICO: BIORESORBABLE POLYMERS MARKET, BY APPLICATION, 2017–2022 (USD MILLION)
  • TABLE 100 MEXICO: BIORESORBABLE POLYMERS MARKET, BY APPLICATION, 2023–2029 (USD MILLION)
  • TABLE 101 MEXICO: BIORESORBABLE POLYMERS MARKET, BY APPLICATION, 2017–2022 (TON)
  • TABLE 102 MEXICO: BIORESORBABLE POLYMERS MARKET, BY APPLICATION, 2023–2029 (TON)
  • TABLE 103 ASIA PACIFIC: BIORESORBABLE POLYMERS MARKET, BY TYPE, 2017–2022 (USD MILLION)
  • TABLE 104 ASIA PACIFIC: BIORESORBABLE POLYMERS MARKET, BY TYPE, 2023–2029 (USD MILLION)
  • TABLE 105 ASIA PACIFIC: BIORESORBABLE POLYMERS MARKET, BY TYPE, 2017–2022 (TON)
  • TABLE 106 ASIA PACIFIC: BIORESORBABLE POLYMERS MARKET, BY TYPE, 2023–2029 (TON)
  • TABLE 107 ASIA PACIFIC: BIORESORBABLE POLYMERS MARKET, BY APPLICATION, 2017–2022 (USD MILLION)
  • TABLE 108 ASIA PACIFIC: BIORESORBABLE POLYMERS MARKET, BY APPLICATION, 2023–2029 (USD MILLION)
  • TABLE 109 ASIA PACIFIC: BIORESORBABLE POLYMERS MARKET, BY APPLICATION, 2017–2022 (TON)
  • TABLE 110 ASIA PACIFIC: BIORESORBABLE POLYMERS MARKET, BY APPLICATION, 2023–2029 (TON)
  • TABLE 111 ASIA PACIFIC: BIORESORBABLE POLYMERS MARKET, BY COUNTRY, 2017–2022 (USD MILLION)
  • TABLE 112 ASIA PACIFIC: BIORESORBABLE POLYMERS MARKET, BY COUNTRY, 2023–2029 (USD MILLION)
  • TABLE 113 ASIA PACIFIC: BIORESORBABLE POLYMERS MARKET, BY COUNTRY, 2017–2022 (TON)
  • TABLE 114 ASIA PACIFIC: BIORESORBABLE POLYMERS MARKET, BY COUNTRY, 2023–2029 (TON)
  • TABLE 115 CHINA: BIORESORBABLE POLYMERS MARKET, BY APPLICATION, 2017–2022 (USD MILLION)
  • TABLE 116 CHINA: BIORESORBABLE POLYMERS MARKET, BY APPLICATION, 2023–2029 (USD MILLION)
  • TABLE 117 CHINA: BIORESORBABLE POLYMERS MARKET, BY APPLICATION, 2017–2022 (TON)
  • TABLE 118 CHINA: BIORESORBABLE POLYMERS MARKET, BY APPLICATION, 2023–2029 (TON)
  • TABLE 119 JAPAN: BIORESORBABLE POLYMERS MARKET, BY APPLICATION, 2017–2022 (USD MILLION)
  • TABLE 120 JAPAN: BIORESORBABLE POLYMERS MARKET, BY APPLICATION, 2023–2029 (USD MILLION)
  • TABLE 121 JAPAN: BIORESORBABLE POLYMERS MARKET, BY APPLICATION, 2017–2022 (TON)
  • TABLE 122 JAPAN: BIORESORBABLE POLYMERS MARKET, BY APPLICATION, 2023–2029 (TON)
  • TABLE 123 INDIA: BIORESORBABLE POLYMERS MARKET, BY APPLICATION, 2017–2022 (USD MILLION)
  • TABLE 124 INDIA: BIORESORBABLE POLYMERS MARKET, BY APPLICATION, 2023–2029 (USD MILLION)
  • TABLE 125 INDIA: BIORESORBABLE POLYMERS MARKET, BY APPLICATION, 2017–2022 (TON)
  • TABLE 126 INDIA: BIORESORBABLE POLYMERS MARKET, BY APPLICATION, 2023–2029 (TON)
  • TABLE 127 SOUTH KOREA: BIORESORBABLE POLYMERS MARKET, BY APPLICATION, 2017–2022 (USD MILLION)
  • TABLE 128 SOUTH KOREA: BIORESORBABLE POLYMERS MARKET, BY APPLICATION, 2023–2029 (USD MILLION)
  • TABLE 129 SOUTH KOREA: BIORESORBABLE POLYMERS MARKET, BY APPLICATION, 2017–2022 (TON)
  • TABLE 130 SOUTH KOREA: BIORESORBABLE POLYMERS MARKET, BY APPLICATION, 2023–2029 (TON)
  • TABLE 131 EUROPE: BIORESORBABLE POLYMERS MARKET, BY TYPE, 2017–2022 (USD MILLION)
  • TABLE 132 EUROPE: BIORESORBABLE POLYMERS MARKET, BY TYPE, 2023–2029 (USD MILLION)
  • TABLE 133 EUROPE: BIORESORBABLE POLYMERS MARKET, BY TYPE, 2017–2022 (TON)
  • TABLE 134 EUROPE: BIORESORBABLE POLYMERS MARKET, BY TYPE, 2023–2029 (TON)
  • TABLE 135 EUROPE: BIORESORBABLE POLYMERS MARKET, BY APPLICATION, 2017–2022 (USD MILLION)
  • TABLE 136 EUROPE: BIORESORBABLE POLYMERS MARKET, BY APPLICATION, 2023–2029 (USD MILLION)
  • TABLE 137 EUROPE: BIORESORBABLE POLYMERS MARKET, BY APPLICATION, 2017–2022 (TON)
  • TABLE 138 EUROPE: BIORESORBABLE POLYMERS MARKET, BY APPLICATION, 2023–2029 (TON)
  • TABLE 139 EUROPE: BIORESORBABLE POLYMERS MARKET, BY COUNTRY, 2017–2022 (USD MILLION)
  • TABLE 140 EUROPE: BIORESORBABLE POLYMERS MARKET, BY COUNTRY, 2023–2029 (USD MILLION)
  • TABLE 141 EUROPE: BIORESORBABLE POLYMERS MARKET, BY COUNTRY, 2017–2022 (TON)
  • TABLE 142 EUROPE: BIORESORBABLE POLYMERS MARKET, BY COUNTRY, 2023–2029 (TON)
  • TABLE 143 GERMANY: BIORESORBABLE POLYMERS MARKET, BY APPLICATION, 2017–2022 (USD MILLION)
  • TABLE 144 GERMANY: BIORESORBABLE POLYMERS MARKET, BY APPLICATION, 2023–2029 (USD MILLION)
  • TABLE 145 GERMANY: BIORESORBABLE POLYMERS MARKET, BY APPLICATION, 2017–2022 (TON)
  • TABLE 146 GERMANY: BIORESORBABLE POLYMERS MARKET, BY APPLICATION, 2023–2029 (TON)
  • TABLE 147 UK: BIORESORBABLE POLYMERS MARKET, BY APPLICATION, 2017–2022 (USD MILLION)
  • TABLE 148 UK: BIORESORBABLE POLYMERS MARKET, BY APPLICATION, 2023–2029 (USD MILLION)
  • TABLE 149 UK: BIORESORBABLE POLYMERS MARKET, BY APPLICATION, 2017–2022 (TON)
  • TABLE 150 UK: BIORESORBABLE POLYMERS MARKET, BY APPLICATION, 2023–2029 (TON)
  • TABLE 151 ITALY: BIORESORBABLE POLYMERS MARKET, BY APPLICATION, 2017–2022 (USD MILLION)
  • TABLE 152 ITALY: BIORESORBABLE POLYMERS MARKET, BY APPLICATION, 2023–2029 (USD MILLION)
  • TABLE 153 ITALY: BIORESORBABLE POLYMERS MARKET, BY APPLICATION, 2017–2022 (TON)
  • TABLE 154 ITALY: BIORESORBABLE POLYMERS MARKET, BY APPLICATION, 2023–2029 (TON)
  • TABLE 155 FRANCE: BIORESORBABLE POLYMERS MARKET, BY APPLICATION, 2017–2022 (USD MILLION)
  • TABLE 156 FRANCE: BIORESORBABLE POLYMERS MARKET, BY APPLICATION, 2023–2029 (USD MILLION)
  • TABLE 157 FRANCE: BIORESORBABLE POLYMERS MARKET, BY APPLICATION, 2017–2022 (TON)
  • TABLE 158 FRANCE: BIORESORBABLE POLYMERS MARKET, BY APPLICATION, 2023–2029 (TON)
  • TABLE 159 RUSSIA: BIORESORBABLE POLYMERS MARKET, BY APPLICATION, 2017–2022 (USD MILLION)
  • TABLE 160 RUSSIA: BIORESORBABLE POLYMERS MARKET, BY APPLICATION, 2023–2029 (USD MILLION)
  • TABLE 161 RUSSIA: BIORESORBABLE POLYMERS MARKET, BY APPLICATION, 2017–2022 (TON)
  • TABLE 162 RUSSIA: BIORESORBABLE POLYMERS MARKET, BY APPLICATION, 2023–2029 (TON)
  • TABLE 163 MIDDLE EAST & AFRICA: BIORESORBABLE POLYMERS MARKET, BY TYPE, 2017–2022 (USD MILLION)
  • TABLE 164 MIDDLE EAST & AFRICA: BIORESORBABLE POLYMERS MARKET, BY TYPE, 2023–2029 (USD MILLION)
  • TABLE 165 MIDDLE EAST & AFRICA: BIORESORBABLE POLYMERS MARKET, BY TYPE, 2017–2022 (TON)
  • TABLE 166 MIDDLE EAST & AFRICA: BIORESORBABLE POLYMERS MARKET, BY TYPE,2023–2029 (TON)
  • TABLE 167 MIDDLE EAST & AFRICA: BIORESORBABLE POLYMERS MARKET, BY APPLICATION, 2017–2022 (USD MILLION)
  • TABLE 168 MIDDLE EAST & AFRICA: BIORESORBABLE POLYMERS MARKET, BY APPLICATION, 2023–2029 (USD MILLION)
  • TABLE 169 MIDDLE EAST & AFRICA: BIORESORBABLE POLYMERS MARKET, BY APPLICATION, 2017–2022 (TON)
  • TABLE 170 MIDDLE EAST & AFRICA: BIORESORBABLE POLYMERS MARKET, BY APPLICATION, 2023–2029 (TON)
  • TABLE 171 MIDDLE EAST & AFRICA: BIORESORBABLE POLYMERS MARKET, BY REGION, 2017–2022 (USD MILLION)
  • TABLE 172 MIDDLE EAST & AFRICA: BIORESORBABLE POLYMERS MARKET, BY REGION, 2023–2029 (USD MILLION)
  • TABLE 173 MIDDLE EAST & AFRICA: BIORESORBABLE POLYMERS MARKET, BY REGION, 2017–2022 (TON)
  • TABLE 174 MIDDLE EAST & AFRICA: BIORESORBABLE POLYMERS MARKET, BY REGION, 2023–2029 (TON)
  • TABLE 175 MIDDLE EAST: BIORESORBABLE POLYMERS MARKET, BY APPLICATION, 2017–2022 (USD MILLION)
  • TABLE 176 MIDDLE EAST: BIORESORBABLE POLYMERS MARKET, BY APPLICATION, 2023–2029 (USD MILLION)
  • TABLE 177 MIDDLE EAST: BIORESORBABLE POLYMERS MARKET, BY APPLICATION, 2017–2022 (TON)
  • TABLE 178 MIDDLE EAST: BIORESORBABLE POLYMERS MARKET, BY APPLICATION, 2023–2029 (TON)
  • TABLE 179 AFRICA: BIORESORBABLE POLYMERS MARKET, BY APPLICATION, 2017–2022 (USD MILLION)
  • TABLE 180 AFRICA: BIORESORBABLE POLYMERS MARKET, BY APPLICATION, 2023–2029 (USD MILLION)
  • TABLE 181 AFRICA: BIORESORBABLE POLYMERS MARKET, BY APPLICATION, 2017–2022 (TON)
  • TABLE 182 AFRICA: BIORESORBABLE POLYMERS MARKET, BY APPLICATION, 2023–2029 (TON)
  • TABLE 183 SOUTH AMERICA: BIORESORBABLE POLYMERS MARKET, BY TYPE, 2017–2022 (USD MILLION)
  • TABLE 184 SOUTH AMERICA: BIORESORBABLE POLYMERS MARKET, BY TYPE, 2023–2029 (USD MILLION)
  • TABLE 185 SOUTH AMERICA: BIORESORBABLE POLYMERS MARKET, BY TYPE, 2017–2022 (TON)
  • TABLE 186 SOUTH AMERICA: BIORESORBABLE POLYMERS MARKET, BY TYPE, 2023–2029 (TON)
  • TABLE 187 SOUTH AMERICA: BIORESORBABLE POLYMERS MARKET, BY APPLICATION, 2017–2022 (USD MILLION)
  • TABLE 188 SOUTH AMERICA: BIORESORBABLE POLYMERS MARKET, BY APPLICATION, 2023–2029 (USD MILLION)
  • TABLE 189 SOUTH AMERICA: BIORESORBABLE POLYMERS MARKET, BY APPLICATION, 2017–2022 (TON)
  • TABLE 190 SOUTH AMERICA: BIORESORBABLE POLYMERS MARKET, BY APPLICATION, 2023–2029 (TON)
  • TABLE 191 SOUTH AMERICA: BIORESORBABLE POLYMERS MARKET, BY COUNTRY, 2017–2022 (USD MILLION)
  • TABLE 192 SOUTH AMERICA: BIORESORBABLE POLYMERS MARKET, BY COUNTRY, 2023–2029 (USD MILLION)
  • TABLE 193 SOUTH AMERICA: BIORESORBABLE POLYMERS MARKET, BY COUNTRY, 2017–2022 (TON)
  • TABLE 194 SOUTH AMERICA: BIORESORBABLE POLYMERS MARKET, BY COUNTRY, 2023–2029 (TON)
  • TABLE 195 BRAZIL: BIORESORBABLE POLYMERS MARKET, BY APPLICATION, 2017–2022 (USD MILLION)
  • TABLE 196 BRAZIL: BIORESORBABLE POLYMERS MARKET, BY APPLICATION, 2023–2029 (USD MILLION)
  • TABLE 197 BRAZIL: BIORESORBABLE POLYMERS MARKET, BY APPLICATION, 2017–2022 (TON)
  • TABLE 198 BRAZIL: BIORESORBABLE POLYMERS MARKET, BY APPLICATION, 2023–2029 (TON)
  • TABLE 199 ARGENTINA: BIORESORBABLE POLYMERS MARKET, BY APPLICATION, 2017–2022 (USD MILLION)
  • TABLE 200 ARGENTINA: BIORESORBABLE POLYMERS MARKET, BY APPLICATION, 2023–2029 (USD MILLION)
  • TABLE 201 ARGENTINA: BIORESORBABLE POLYMERS MARKET, BY APPLICATION, 2017–2022 (TON)
  • TABLE 202 ARGENTINA: BIORESORBABLE POLYMERS MARKET, BY APPLICATION, 2023–2029 (TON)
  • TABLE 203 BIORESORBABLE POLYMERS MARKET: OVERVIEW OF MAJOR STRATEGIES ADOPTED BY KEY PLAYERS, 2019–2024
  • TABLE 204 BIORESORBABLE POLYMERS MARKET: DEGREE OF COMPETITION, 2023
  • TABLE 205 BIORESORBABLE POLYMERS MARKET: TYPE FOOTPRINT
  • TABLE 206 BIORESORBABLE POLYMERS MARKET: APPLICATION FOOTPRINT
  • TABLE 207 BIORESORBABLE POLYMERS MARKET: REGION FOOTPRINT
  • TABLE 208 BIORESORBABLE POLYMERS MARKET: DETAILED LIST OF KEY STARTUPS/SMES
  • TABLE 209 BIORESORBABLE POLYMERS MARKET: COMPETITIVE BENCHMARKING OF KEY STARTUPS/SMES
  • TABLE 210 BIORESORBABLE POLYMERS MARKET: PRODUCT LAUNCHES, JANUARY 2020– OCTOBER 2024
  • TABLE 211 BIORESORBABLE POLYMERS MARKET: DEALS, JANUARY 2020–OCTOBER 2024
  • TABLE 212 BIORESORBABLE POLYMERS MARKET: EXPANSIONS, JANUARY 2020–OCTOBER 2024
  • TABLE 213 CORBION: COMPANY OVERVIEW
  • TABLE 214 CORBION: PRODUCTS/SOLUTIONS/SERVICES OFFERED
  • TABLE 215 CORBION: DEALS, JANUARY 2020–OCTOBER 2024
  • TABLE 216 EVONIK INDUSTRIES AG: COMPANY OVERVIEW
  • TABLE 217 EVONIK INDUSTRIES AG: PRODUCTS/SOLUTIONS/SERVICES OFFERED
  • TABLE 218 EVONIK INDUSTRIES AG: EXPANSIONS, JANUARY 2020–OCTOBER 2024
  • TABLE 219 EVONIK INDUSTRIES AG: DEALS, JANUARY 2020–OCTOBER 2024
  • TABLE 220 FOSTER CORPORATION: COMPANY OVERVIEW
  • TABLE 221 FOSTER CORPORATION: PRODUCTS/SOLUTIONS/SERVICES OFFERED
  • TABLE 222 KLS MARTIN GROUP: COMPANY OVERVIEW
  • TABLE 223 KLS MARTIN GROUP: PRODUCTS/SOLUTIONS/SERVICES OFFERED
  • TABLE 224 DSM BIOMEDICAL: COMPANY OVERVIEW
  • TABLE 225 DSM BIOMEDICAL: PRODUCTS/SOLUTIONS/SERVICES OFFERED
  • TABLE 226 ASHLAND GLOBAL HOLDINGS INC.: COMPANY OVERVIEW
  • TABLE 227 ASHLAND GLOBAL HOLDINGS INC.: PRODUCTS/SOLUTIONS/SERVICES OFFERED
  • TABLE 228 ASHLAND GLOBAL HOLDINGS INC.: PRODUCT LAUNCHES, JANUARY 2020– OCTOBER 2024
  • TABLE 229 ASHLAND GLOBAL HOLDINGS INC.: EXPANSIONS, JANUARY 2020–OCTOBER 2024
  • TABLE 230 ZEUS COMPANY LLC: COMPANY OVERVIEW
  • TABLE 231 ZEUS COMPANY LLC: PRODUCTS/SOLUTIONS/SERVICES OFFERED
  • TABLE 232 ZEUS COMPANY LLC: PRODUCT LAUNCHES, JANUARY 2020–OCTOBER 2024
  • TABLE 233 SEQENS: COMPANY OVERVIEW
  • TABLE 234 SEQENS: PRODUCTS/SOLUTIONS/SERVICES OFFERED
  • TABLE 235 REVA MEDICAL, LLC: COMPANY OVERVIEW
  • TABLE 236 REVA MEDICAL, LLC: PRODUCTS/SOLUTIONS/SERVICES OFFERED
  • TABLE 237 POLY-MED INCORPORATED: COMPANY OVERVIEW
  • TABLE 238 POLY-MED INCORPORATED: PRODUCTS/SOLUTIONS/SERVICES OFFERED
  • TABLE 239 BEZWADA BIOMEDICAL, LLC: COMPANY OVERVIEW
  • TABLE 240 NOMISMA HEALTHCARE PVT. LTD.: COMPANY OVERVIEW
  • TABLE 241 BMG INC.: COMPANY OVERVIEW
  • TABLE 242 POLYSCIENCES, INC.: COMPANY OVERVIEW
  • TABLE 243 HUIZHOU FORYOU MEDICAL DEVICES CO., LTD.: COMPANY OVERVIEW
  • TABLE 244 MUSASHINO CHEMICAL LABORATORY, LTD.: COMPANY OVERVIEW
  • TABLE 245 HENAN XINGHAN BIOLOGICAL TECHNOLOGY CO., LTD.: COMPANY OVERVIEW
  • TABLE 246 POLY LACTIC ACID MARKET, BY REGION, 2019–2022 (USD MILLION)
  • TABLE 247 POLY LACTIC ACID MARKET, BY REGION, 2023–2028 (USD MILLION)
  • TABLE 248 EUROPE: POLY LACTIC ACID MARKET, BY COUNTRY, 2019–2022 (USD MILLION)
  • TABLE 249 EUROPE: POLY LACTIC ACID MARKET, BY COUNTRY, 2023–2028 (USD MILLION)
  • TABLE 250 NORTH AMERICA: POLY LACTIC ACID MARKET, BY COUNTRY, 2019–2022 (USD MILLION)
  • TABLE 251 NORTH AMERICA: POLY LACTIC ACID MARKET, BY COUNTRY, 2023–2028 (USD MILLION)
  • TABLE 252 ASIA PACIFIC: POLY LACTIC ACID MARKET, BY COUNTRY, 2019–2022 (USD MILLION)
  • TABLE 253 ASIA PACIFIC: POLY LACTIC ACID MARKET, BY COUNTRY, 2023–2028 (USD MILLION)
  • TABLE 254 SOUTH AMERICA: POLY LACTIC ACID MARKET, BY COUNTRY, 2019–2022 (USD MILLION)
  • TABLE 255 SOUTH AMERICA: POLY LACTIC ACID MARKET, BY COUNTRY, 2023–2028 (USD MILLION)
  • TABLE 256 MIDDLE EAST & AFRICA: POLY LACTIC ACID MARKET, BY COUNTRY, 2019–2022 (USD MILLION)
  • TABLE 257 MIDDLE EAST & AFRICA: POLY LACTIC ACID MARKET, BY COUNTRY, 2023–2028 (USD MILLION)
LIST OF FIGURES
 
  • FIGURE 1 BIORESORBABLE POLYMERS MARKET SEGMENTATION AND REGIONAL SCOPE
  • FIGURE 2 BIORESORBABLE POLYMERS MARKET: RESEARCH DESIGN
  • FIGURE 3 APPROACH FOR BASE MARKET CALCULATION AND VALIDATION
  • FIGURE 4 MARKET SIZE ESTIMATION METHODOLOGY: APPROACH 1 (TOP-DOWN)
  • FIGURE 5 MARKET SIZE ESTIMATION METHODOLOGY: APPROACH 2 (SUPPLY SIDE)
  • FIGURE 6 BIORESORBABLE POLYMERS MARKET: SUPPLY-SIDE FORECAST
  • FIGURE 7 MARKET GROWTH PROJECTIONS FROM DEMAND-SIDE DRIVERS AND OPPORTUNITIES
  • FIGURE 8 FACTOR ANALYSIS OF BIORESORBABLE POLYMERS MARKET
  • FIGURE 9 BIORESORBABLE POLYMERS MARKET: DATA TRIANGULATION
  • FIGURE 10 PLA TO BE LARGEST BIORESORBABLE POLYMER TYPE DURING FORECAST PERIOD
  • FIGURE 11 DRUG DELIVERY TO BE FASTEST-GROWING APPLICATION OF BIORESORBABLE POLYMERS DURING FORECAST PERIOD
  • FIGURE 12 NORTH AMERICA ACCOUNTED FOR LARGEST SHARE OF BIORESORBABLE POLYMERS MARKET IN 2023
  • FIGURE 13 HIGH MARKET GROWTH EXPECTED IN EMERGING ECONOMIES DURING FORECAST PERIOD
  • FIGURE 14 NORTH AMERICA TO BE LARGEST BIORESORBABLE POLYMERS MARKET DURING FORECAST PERIOD
  • FIGURE 15 US ACCOUNTED FOR LARGEST MARKET SHARE IN NORTH AMERICA
  • FIGURE 16 ORTHOPEDIC DEVICES SEGMENT TO DOMINATE BIORESORBABLE POLYMERS MARKET DURING FORECAST PERIOD
  • FIGURE 17 INDIA TO BE FASTEST-GROWING BIORESORBABLE POLYMERS MARKET DURING FORECAST PERIOD
  • FIGURE 18 DRIVERS, RESTRAINTS, OPPORTUNITIES, AND CHALLENGES IN BIORESORBABLE POLYMERS MARKET
  • FIGURE 19 PHARMACEUTICAL R&D EXPENDITURE IN EUROPE, US, JAPAN, AND CHINA, 2000–2022 (USD MILLION)
  • FIGURE 20 BIORESORBABLE POLYMERS MARKET: PORTER’S FIVE FORCES ANALYSIS
  • FIGURE 21 INFLUENCE OF STAKEHOLDERS ON BUYING PROCESS FOR TOP THREE TYPES
  • FIGURE 22 KEY BUYING CRITERIA, BY TOP THREE TYPES
  • FIGURE 23 BIORESORBABLE POLYMERS MARKET: SUPPLY CHAIN ANALYSIS
  • FIGURE 24 AVERAGE SELLING PRICE TREND OF BIORESORBABLE POLYMERS OFFERED BY KEY PLAYERS, BY APPLICATION, 2023 (USD/KG)
  • FIGURE 25 AVERAGE SELLING PRICE TREND OF BIORESORBABLE POLYMERS, BY REGION, 2021–2029 (USD/KG)
  • FIGURE 26 TRENDS/DISRUPTIONS IMPACTING CUSTOMER BUSINESS
  • FIGURE 27 BIORESORBABLE POLYMERS MARKET: ECOSYSTEM ANALYSIS
  • FIGURE 28 IMPORT DATA RELATED TO HS CODE 390770-COMPLIANT PRODUCTS, BY KEY COUNTRY, 2019–2023 (USD THOUSAND)
  • FIGURE 29 EXPORT DATA RELATED TO HS CODE 390770-COMPLIANT PRODUCTS, BY KEY COUNTRY, 2019–2023 (USD THOUSAND)
  • FIGURE 30 REGISTERED PATENTS RELATED TO BIORESORBABLE POLYMERS, 2014–2024
  • FIGURE 31 TOP PATENT OWNERS DURING LAST 10 YEARS, 2014–2024
  • FIGURE 32 LEGAL STATUS OF PATENTS FILED FOR BIORESORBABLE POLYMERS, 2014–2024
  • FIGURE 33 MAXIMUM PATENTS FILED IN US JURISDICTION, 2014–2024
  • FIGURE 34 PLGA TO BE FASTEST-GROWING SEGMENT DURING FORECAST PERIOD
  • FIGURE 35 ASIA PACIFIC TO BE FASTEST-GROWING BIORESORBABLE POLYMERS MARKET FOR PLA SEGMENT
  • FIGURE 36 NORTH AMERICA TO BE LARGEST PGA-BASED BIORESORBABLE POLYMERS MARKET DURING FORECAST PERIOD
  • FIGURE 37 ASIA PACIFIC TO BE FASTEST-GROWING PLGA-BASED BIORESORBABLE POLYMERS MARKET DURING FORECAST PERIOD
  • FIGURE 38 EUROPE TO BE SECOND-LARGEST MARKET FOR PCL-BASED BIORESORBABLE POLYMERS BETWEEN 2024 AND 2029
  • FIGURE 39 ASIA PACIFIC TO BE FASTEST-GROWING MARKET FOR OTHER BIORESORBABLE POLYMER TYPES DURING FORECAST PERIOD
  • FIGURE 40 ORTHOPEDIC DEVICES TO BE LARGEST APPLICATION OF BIORESORBABLE POLYMERS DURING FORECAST PERIOD
  • FIGURE 41 NORTH AMERICA TO BE LARGEST MARKET FOR BIORESORBABLE POLYMERS IN ORTHOPEDIC DEVICES APPLICATION
  • FIGURE 42 NORTH AMERICA TO BE LARGEST BIORESORBABLE POLYMERS MARKET IN DRUG DELIVERY APPLICATION
  • FIGURE 43 EUROPE TO BE SECOND-LARGEST BIORESORBABLE POLYMERS MARKET IN OTHER APPLICATIONS
  • FIGURE 44 ASIA PACIFIC TO BE FASTEST-GROWING BIORESORBABLE POLYMERS MARKET DURING FORECAST PERIOD
  • FIGURE 45 NORTH AMERICA: BIORESORBABLE POLYMERS MARKET SNAPSHOT
  • FIGURE 46 ASIA PACIFIC: BIORESORBABLE POLYMERS MARKET SNAPSHOT
  • FIGURE 47 EUROPE: BIORESORBABLE POLYMERS MARKET SNAPSHOT
  • FIGURE 48 BIORESORBABLE POLYMERS MARKET SHARE ANALYSIS, 2023
  • FIGURE 49 BIORESORBABLE POLYMERS MARKET: REVENUE ANALYSIS OF KEY PLAYERS (USD MILLION), 2019–2023
  • FIGURE 50 BIORESORBABLE POLYMERS MARKET: COMPANY EVALUATION MATRIX, KEY PLAYERS, 2023
  • FIGURE 51 BIORESORBABLE POLYMERS MARKET: COMPANY FOOTPRINT
  • FIGURE 52 BIORESORBABLE POLYMERS MARKET: COMPANY EVALUATION MATRIX, STARTUPS/SMES, 2023
  • FIGURE 53 BIORESORBABLE POLYMERS MARKET: BRAND/PRODUCT COMPARISON
  • FIGURE 54 BIORESORBABLE POLYMERS MARKET: EV/EBITDA OF KEY MANUFACTURERS
  • FIGURE 55 BIORESORBABLE POLYMERS MARKET: ENTERPRISE VALUATION OF KEY PLAYERS (USD BILLION)
  • FIGURE 56 CORBION: COMPANY SNAPSHOT
  • FIGURE 57 EVONIK INDUSTRIES AG: COMPANY SNAPSHOT
  • FIGURE 58 ASHLAND GLOBAL HOLDINGS INC.: COMPANY SNAPSHOT


The study involved four major activities in estimating the market size for bioresorbable polymers market. Exhaustive secondary research was done to collect information on the market, the peer market, and the parent market. The next step was to validate these findings, assumptions, and sizing with industry experts across the value chain through primary research. Both top-down and bottom-up approaches were employed to estimate the complete market size. After that, the market breakdown and data triangulation procedures were used to estimate the market size of the segments and subsegments.

Secondary Research

Secondary sources used in this study included annual reports, press releases, and investor presentations of companies; white papers; certified publications; articles from recognized authors; and gold standard & silver standard websites such as Factiva, ICIS, Bloomberg, and others. The findings of this study were verified through primary research by conducting extensive interviews with key officials such as CEOs, VPs, directors, and other executives. The breakdown of profiles of the primary interviewees is illustrated in the figure below:

Primary Research

The bioresorbable polymers market comprises several stakeholders, such as raw material suppliers, end-product manufacturers, and regulatory organizations in the supply chain. The demand side of this market is characterized from key opinion leaders in various applications for the bioresorbable polymers market. The supply side is characterized by advancements in technology and diverse application industries. Various primary sources from both the supply and demand sides of the market were interviewed to obtain qualitative and quantitative information.

The following is a breakdown of the primary respondents:

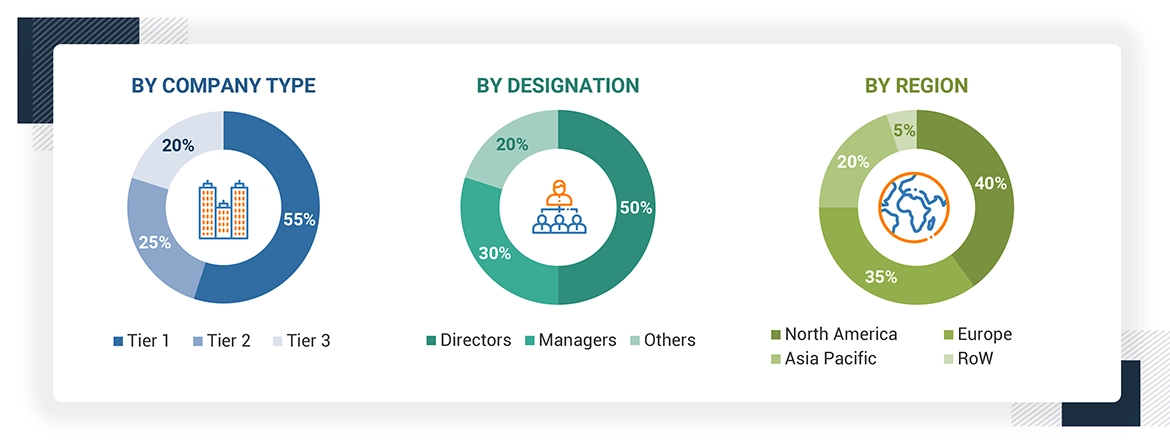
Note: Tier 1, Tier 2, and Tier 3 companies are classified based on their market revenue in 2022/ 2023, available in the public domain, product portfolios, and geographical presence.

Other designations include consultants and sales, marketing, and procurement managers.

To know about the assumptions considered for the study, download the pdf brochure

COMPANY NAME DESIGNATION
Evonik Industries AG Sales Manager
Ashland Global Holdings Inc. R&D Manager
KLS Martin Group Global R&D Head
DSM Biomedical Business Development Manager
Poly-Med Incorporated Regional Sales Manager

Market Size Estimation

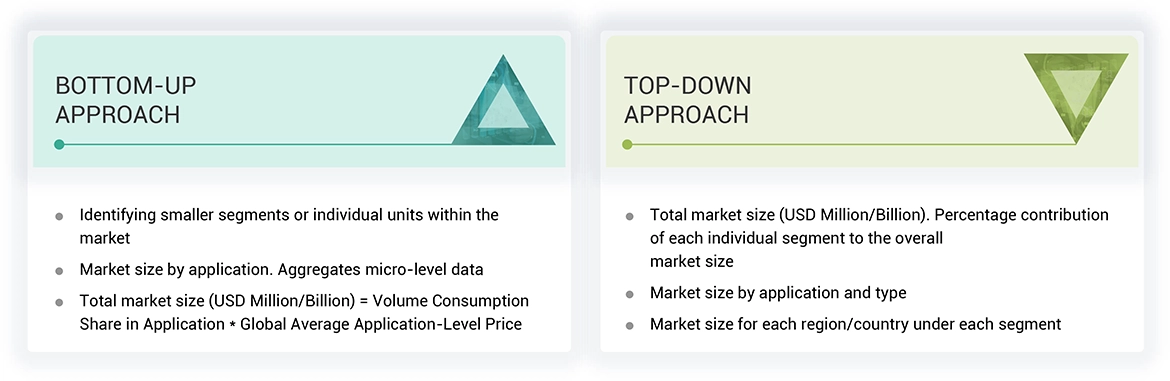
Both top-down and bottom-up approaches were used to estimate and validate the total size of the bioresorbable polymers market. These methods were also used extensively to estimate the size of various subsegments in the market. The research methodology used to estimate the market size includes the following:

  • The key players in the industry have been identified through extensive secondary research.
  • The supply chain of the industry has been determined through primary and secondary research.
  • All percentage shares, splits, and breakdowns have been determined using secondary sources and verified through primary sources.
  • All possible parameters that affect the markets covered in this research study have been accounted for, viewed in extensive detail, verified through primary research, and analyzed to obtain the final quantitative and qualitative data.

Data Triangulation

After arriving at the overall market size—using the market size estimation processes as explained above—the market was split into several segments and subsegments. To complete the overall market engineering process and arrive at the exact statistics of each market segment and subsegment, data triangulation, and market breakdown procedures were employed, wherever applicable. The data was triangulated by studying various factors and trends from both the demand and supply sides in the bioresorbable polymers industry.

Market Definition

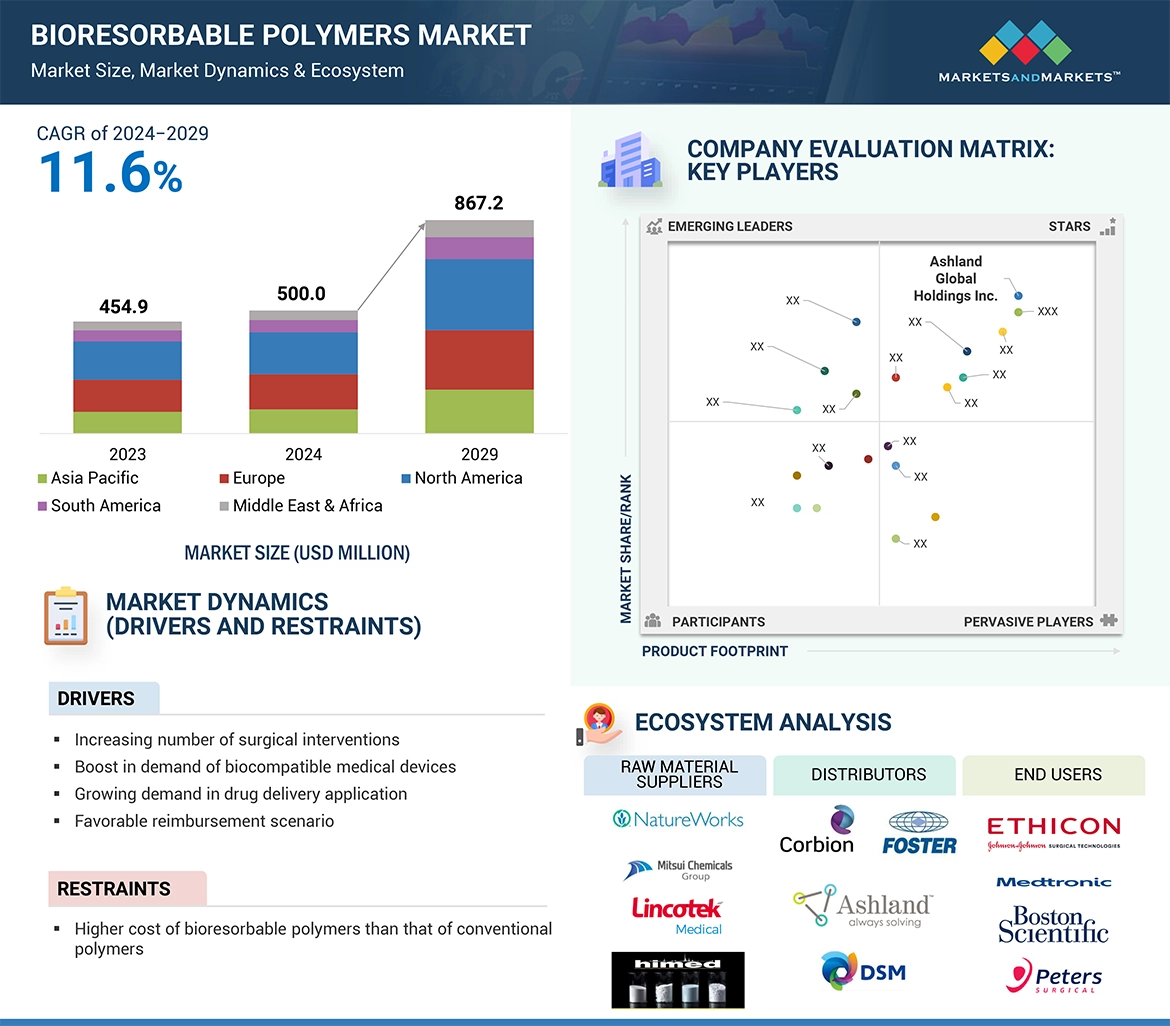
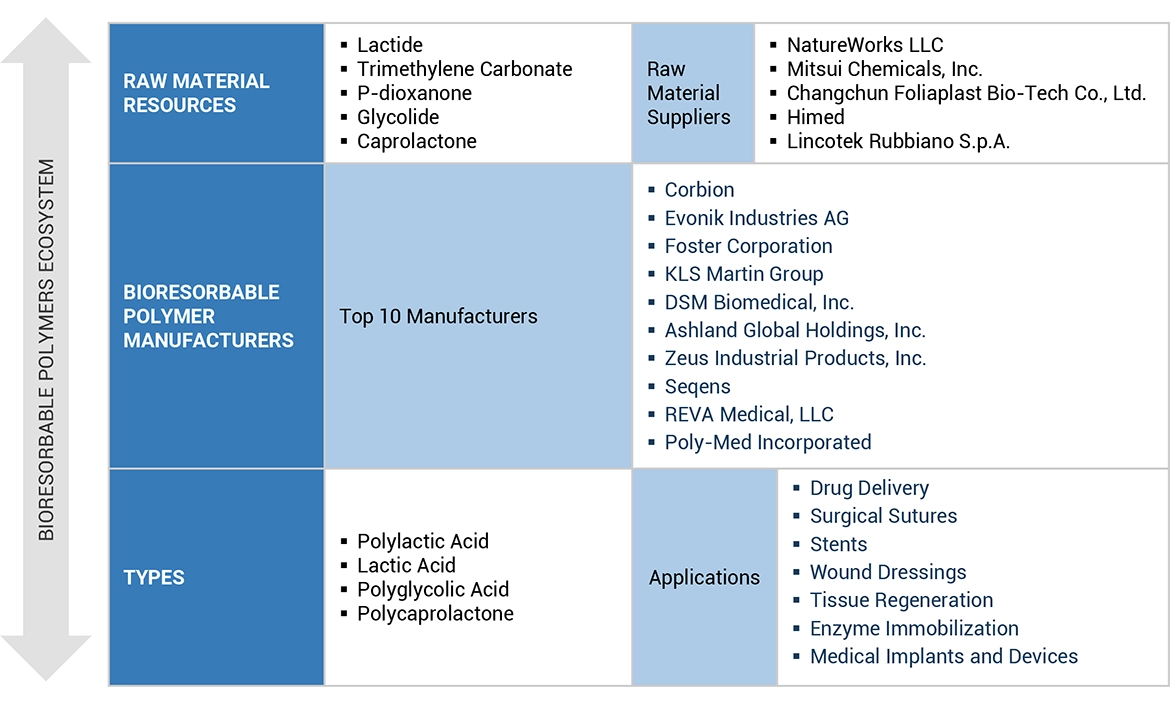
The bioresorbable polymers are the type of polymers. They are designed to naturally degrade and be absorbed within biological environments. These polymers are utilized in medical and healthcare sectors, where they are used to manufacture orthopedic devices and drug delivery systems. The demand of bioresorbable polymers influenced by the innovation in medical devices and the need for the eco-friendly alternatives to the permanent implants. The key components of the bioresorbable polymers are PLA, PGA, PLGA, and PCL.

Stakeholders

  • Bioresorbable polymers manufacturers
  • Bioresorbable polymers suppliers
  • Raw material suppliers
  • Application sector companies
  • Government bodies

Report Objectives

  • To define, describe, and forecast the bioresorbable polymers market in terms of value and volume
  • To provide detailed information regarding the drivers, opportunities, restraints, and challenges influencing market growth
  • To estimate and forecast the market size by type, application, and region
  • To forecast the size of the market for five main regions: Asia Pacific, Europe, North America, South America, and the Middle East & Africa, along with their key countries
  • To strategically analyze micromarkets1 with respect to their growth trends, prospects, and contribution to the overall market
  • To analyze opportunities in the market for stakeholders and provide a competitive landscape for market leaders
  • To analyze competitive developments, such as deals and expansions, in the market
  • To strategically profile key players and comprehensively analyze their growth strategies

Previous Versions of this Report

Bioresorbable Polymers Market by Type (Polylactic acid (PLA), Polyglycolic acid (PGA), Polylactic-co-glycolic acid (PLGA), Polycaprolactone(PCL)), application (orthopedic devices, drug delivery), and Region - Global Forecast to 2027

Report Code CH 4342
Published in Jan, 2023, By MarketsandMarkets™

Bioresorbable Polymers Market by Type(Polylactic Acid (PLA), Polyglycolic Acid (PGA), Poly(lactic-co-glycolic Acid) (PLGA), Polycaprolactone(PCL)), Application (Orthopedic Devices, Drug Delivery), and Region - Global Forecast to 2026

Report Code CH 4342
Published in Nov, 2021, By MarketsandMarkets™

Bioresorbable Polymers Market by Type(Polylactic Acid (PLA), Polyglycolic Acid (PGA), Poly(lactic-co-glycolic Acid) (PLGA), Polycaprolactone(PCL)), Application (Orthopedic Devices, Drug Delivery), and Region - Global Forecast to 2026

Report Code CH 4342
Published in May, 2016, By MarketsandMarkets™
"Our USP is "providing game-changing business opportunities reports with free customization" - so please feel free to provide us with your specific areas of interest / business challenges in much greater detail !!"

We appreciate your interest in this report. Once you fill out the form, you'll be immediately directed to an exclusive solution tailored to your needs. This high-value offering can help boost your revenue by 30% - a must-see opportunity for anyone looking to maximize growth.


By clicking the "Submit" button, you are agreeing to the Terms of Use and Privacy Policy.

Custom Market Research Services

We Will Customise The Research For You, In Case The Report Listed Above Does Not Meet With Your Requirements

Get 10% Free Customisation

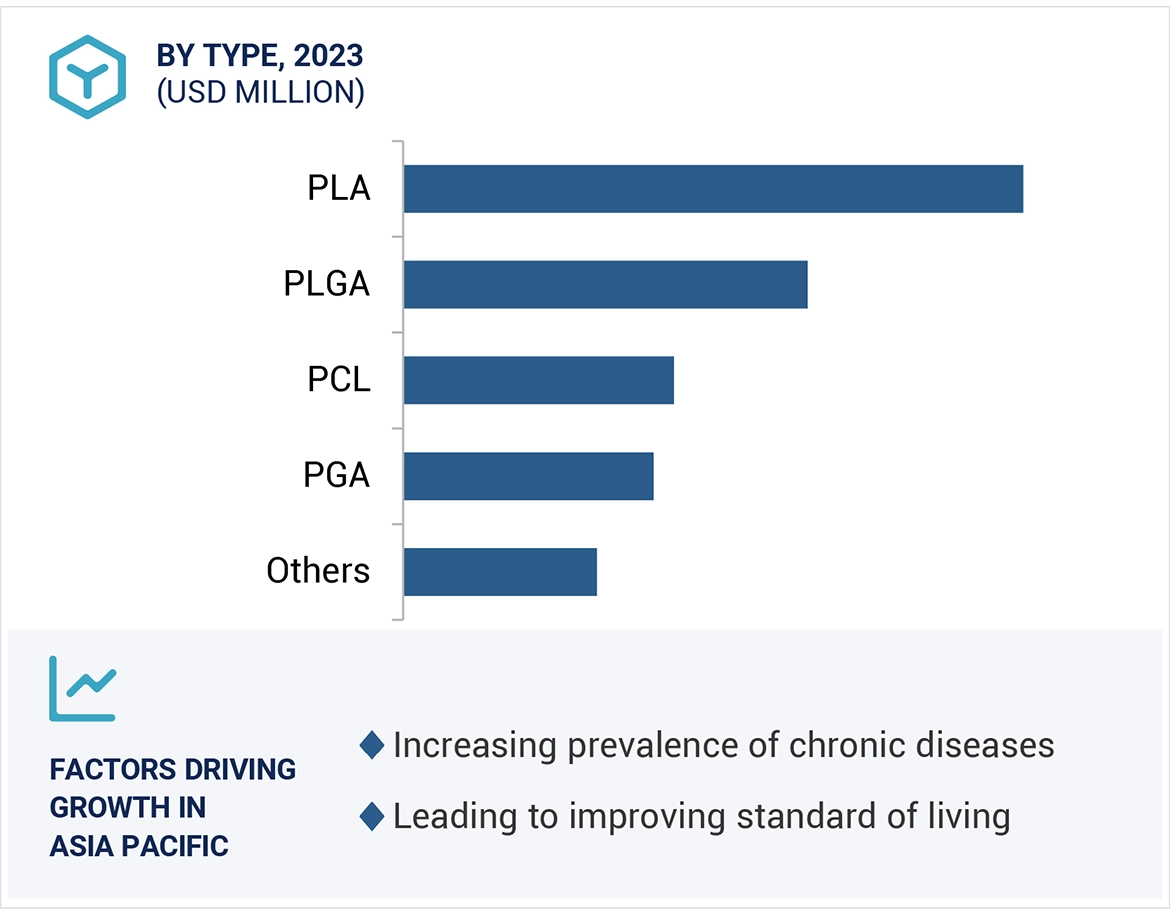
Growth opportunities and latent adjacency in Bioresorbable Polymers Market

DMCA.com Protection Status