The study involved major activities in estimating the current size of the power management system market. Exhaustive secondary research was done to collect information on the peer and parent markets. The next step was to validate these findings, assumptions, and sizing with industry experts across the value chain through primary research. Both top-down and bottom-up approaches were employed to estimate the complete market size. Thereafter, market breakdown and data triangulation were used to estimate the market size of the segments and subsegments.
Secondary Research
This research study on the pms market involved the use of extensive secondary sources, directories, and databases, such as Hoovers, Bloomberg, Businessweek, Factiva, International Energy Agency, and BP Statistical Review of World Energy, to identify and collect information useful for a technical, market-oriented, and commercial study of the global power management systems market. The other secondary sources included annual reports, press releases & investor presentations of companies, white papers, certified publications, articles by recognized authors, manufacturer associations, trade directories, and databases.
Primary Research
The power management system market comprises several stakeholders such as generator manufacturers, manufacturers of subcomponents of power management system, manufacturing technology providers, and technology support providers in the supply chain. The demand side of this market is characterized by the rising demand for uninterrupted power supply from end users. Moreover, the demand is also driven by the rising demand from data centers & IT facilities. The supply side is characterized by rising demand for contracts from the industrial sector, and mergers & acquisitions among big players. Various primary sources from both the supply and demand sides of the market were interviewed to obtain qualitative and quantitative information. Following is the breakdown of primary respondents:
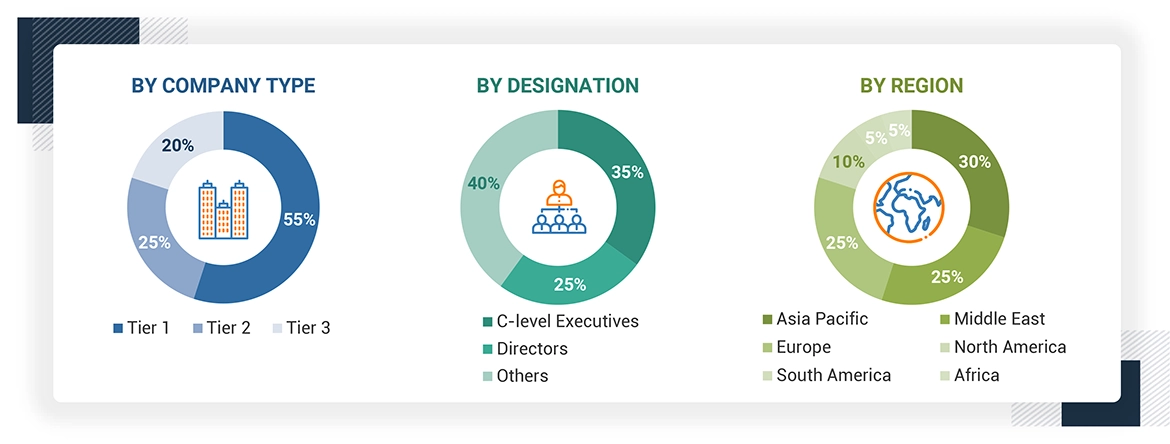
Note: “Others” includes marketing managers, sales managers, and product managers
To know about the assumptions considered for the study, download the pdf brochure
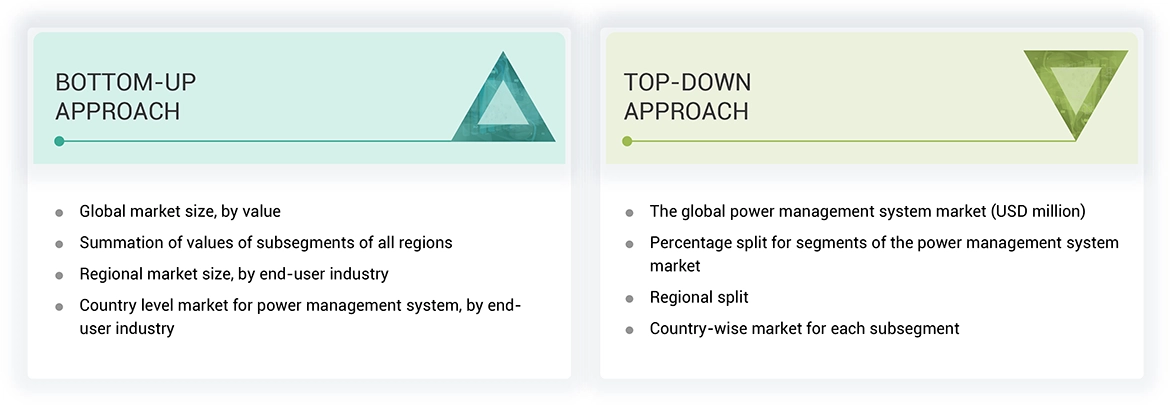
Market Size Estimation
Both top-down and bottom-up approaches were used to estimate and validate the total size of the pms market. These methods were also used extensively to estimate the size of various subsegments in the market. The research methodology used to estimate the market size includes the following:
-
The key players in the industry and market have been identified through extensive secondary research, and their market share in the respective regions have been determined through both primary and secondary research.
-
The industry’s value chain and market size, in terms of value, have been determined through primary and secondary research processes.
-
All percentage shares, splits, and breakdowns have been determined using secondary sources and verified through primary sources.
Power Management System Market Size: Top Down and Bottom-Up Approach
Data Triangulation
After arriving at the overall market size from the estimation process explained above, the total market has been split into several segments and subsegments. To complete the overall market engineering process and arrive at the exact statistics for all the segments and subsegments, the data triangulation and market breakdown processes have been employed, wherever applicable. The data has been triangulated by studying various factors and trends from both the demand- and supply sides. Along with this, the market has been validated using both the top-down and bottom-up approaches.
Market Definition
The Power Management System (PMS) market refers to the global industry that involves the development, manufacturing, and implementation of solutions and technologies for the efficient, reliable, and optimized management of electrical power.
Stakeholders
-
Government & research organizations
-
Institutional investors and investment banks
-
Investors/shareholders
-
Environmental research institutes
Report Objectives
-
To define, describe, segment, and forecast the power system market, in terms of value and volume, on the basis of type, end user industry, module, and region
-
To forecast the market size for five key regions: North America, South America, Europe, Asia Pacific, and Middle East & Africa, along with their key countries
-
To provide detailed information about the key drivers, restraints, opportunities, and challenges influencing the growth of the market
-
To strategically analyze the subsegments with respect to individual growth trends, prospects, and contributions of each segment to the overall market size
-
To analyze market opportunities for stakeholders and the competitive landscape of the market
-
To strategically profile the key players and comprehensively analyze their market shares and core competencies
-
To analyze competitive developments, such as sales contracts, agreements, investments, expansions, new product launches, mergers, partnerships, collaborations, and acquisitions, in the market
Available Customizations
With the given market data, MarketsandMarkets offers customizations as per the client’s specific needs. The following customization options are available for this report:
Geographic Analysis
-
Further breakdown of region or country-specific analysis
Company Information
-
Detailed analyses and profiling of additional market players (up to 5)


 LARGEST MARKET IN THE GLOBAL LEVEL
 US FASTEST-GROWING MARKET IN THE REGION


Growth opportunities and latent adjacency in Power Management System Market