Power System Simulator Market by Module (Load Flow, Short Circuit, Device Coordination Selectivity, Arc Flash), Offering (Hardware, Software, Services), End-User (Power Generation, T&D, O&G, Manufacturing, Metals), and Region - Global Forecast to 2022


[142 Pages Report] The global power system simulator market was valued at USD 785.3 Million in 2016 and is projected to reach USD 1180.6 Million by 2022, growing at a CAGR of 7.14%, from 2017 to 2022. The booming power sector and augmented power generation capacities, rising adoption of IoT and cloud platforms, and reduced overall project time and cost are driving the power system simulator market globally. The market has been segmented based on module, offering, end-user, and region.
The years considered for the study are as follows:
- Base Year: 2016
- Estimated Year: 2017
- Projected Year: 2022
- Forecast Period: 2017 to 2022
The base year considered for company profiles is 2016. Whenever information was unavailable for the base year, the prior year has been considered.
Objectives of the Study
- To define, describe, and forecast the power system simulator by module, offering, end-user, and region
- To provide detailed information regarding the major factors influencing the growth of the power system simulator market (drivers, restraints, opportunities, and industry-specific challenges)
- To strategically analyze the market with respect to individual growth trends, future projections, and the contribution of each segment to the market
- To track and analyze competitive developments such as contracts & agreements, new product launches, investments and expansions, and partnerships and collaborations in the market
- To profile key players and comprehensively analyze their market ranking and core competencies
Research Methodology
This research study involved the use of extensive secondary sources, directories, and databases, such as Hoover�s, Bloomberg Businessweek, Factiva, and OneSource, to identify and collect information useful for a technical, market-oriented, and commercial study of the power system simulator. Primary sources are mainly industry experts from the core and related industries, preferred suppliers, manufacturers, distributors, service providers, technology developers, standards and certification organizations of companies, and organizations related to all the segments of this industry�s value chain. The points given below explain the research methodology.
- Study of the annual revenue and market developments of major players that provide power system simulators
- Assessment of future trends and growth of end-users
- Assessment of the power system simulator with respect to the type of module used by different end-users
- Study of contracts and other developments related to the market by key players across different regions
- Finalization of overall market sizes by triangulating the supply-side data, which includes product developments, supply chain, and annual revenues of companies offering power system simulators across the globe
After arriving at the overall market size, the total market has been split into several segments and sub-segments. The figure given below illustrates the breakdown of primaries conducted during the research study, based on company type, designation, and region.
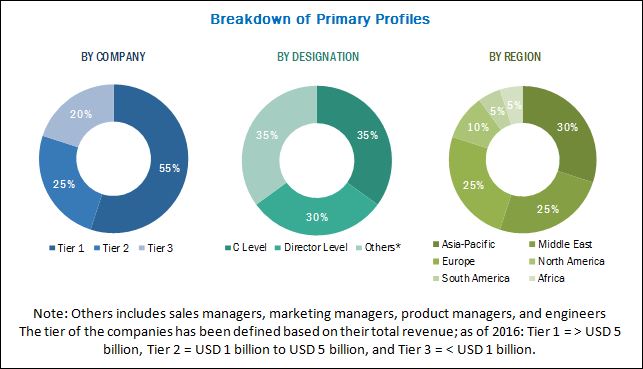
To know about the assumptions considered for the study, download the pdf brochure
Market Ecosystem:
The power system simulator market ecosystem comprises companies such as ABB (Switzerland), Schneider Electric (France), Siemens (Germany), GE (US), ETAP (US), RTDS Technologies (Canada), MathWorks (US), OPAL-RT (Canada), and Eaton (Ireland).
Target Audience:
The report�s target audience includes:
- Power system simulator companies
- Power system hardware providers
- Engineering, procurement, and construction companies in the transmission and distribution sector
- Government and research organizations
- Investment banks
- Power transmission and distribution companies
Scope of the Report:
- By Offering
- Hardware
- Software
- Services
- By Modules
- Load Flow
- Short Circuit
- Arc Flash
- Device Coordination Selectivity
- Harmonics
- Others
- By End-User
- Power
- Power Generation
- Transmission and Distribution
- Industrial
- Oil & Gas
- Manufacturing
- Metals and Mining
- Others
- Power
- By Region
- North America
- Europe
- Asia Pacific
- South America
- Middle East
- Africa
Available Customizations:
With the given market data, MarketsandMarkets offers customizations as per the client�s specific needs. The following customization options are available for the report:
Regional Analysis
- Further breakdown of region/country-specific analyses
Company Information
- Detailed analyses and profiling of additional market players (up to 5)
The global power system simulator market is estimated to be USD 836.1 Million in 2017 and is projected to reach USD 1,180.6 Million by 2022, growing at a CAGR of 7.14%, from 2017 to 2022. The booming power sector and augmented power generation capacities, rising adoption of IoT and cloud platforms, and reduced overall project time and cost are driving the market for power system simulators globally.
The power system simulator has been segmented based on offering into hardware, software, and services. The software segment is expected to be the largest due to the upgradation of existing software to the latest versions and upcoming technologies.
The power system simulator has been segmented based on module into load flow, short circuit, device coordination selectivity, arc flash, harmonics, and others. The others segment includes motor acceleration, sequence of operation, transient stability, and reliability assessment. The load flow module segment is estimated hold the largest share of the market during the forecast period. Upcoming power projects in economies such India, Indonesia, Malaysia, South Africa, and Qatar are expected to boost the demand for load flow modules during the forecast period.
The power system simulator has been segmented, by end-user, into power, industrial, and others. The others segment includes transportation, commercial, and institutional. The power segment is estimated to hold the largest market share by 2022. Increased investments in renewable energy sources such as solar and wind are expected to drive the power segment during the forecast period.
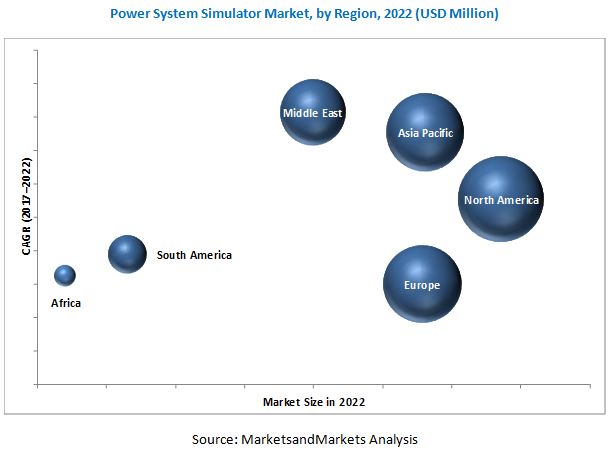
The power system simulator market has been analyzed with respect to 6 regions, namely, North America, Europe, Asia Pacific, South America, the Middle East, and Africa. North America is expected to dominate the power system simulator market during the forecast period. Increasing investments in the renewable energy and metals and mining markets and a positive outlook on the shale oil market are the key factors driving the power system simulator market in North America. The figure below shows the market sizes and CAGRs for the year 2022 in various regions.
The major factor restraining the growth of the market is the lack of data security. Increasing occurrences of viruses and cyber-attacks are leading to security concerns. Important information can be stolen by malicious viruses in computer systems, which can cause a major loss to industries. Some of the leading players in the power system simulator market include ABB (Switzerland), Schneider Electric (France), Siemens (Germany), GE (US), ETAP (US), RTDS Technologies (Canada), MathWorks (US), OPAL-RT (Canada), and Eaton (Ireland).
To speak to our analyst for a discussion on the above findings, click Speak to Analyst
 Exclusive indicates content/data unique to MarketsandMarkets and not available with any competitors.
Table of Contents
1 Introduction (Page No. - 14)
1.1 Objectives of the Study
1.2 Market Definition
1.3 Market Scope
1.3.1 Markets Covered
1.3.2 Years Considered for the Study
1.4 Currency
1.5 Stakeholders
2 Research Methodology (Page No. - 17)
2.1 Introduction
2.2 Research Data
2.2.1 Secondary Data
2.2.2 Primary Data
2.2.2.1 Key Data From Primary Sources
2.2.2.2 Key Industry Insights
2.2.2.3 Breakdown of Primary Interviews
2.3 Market Size Estimation
2.4 Market Breakdown & Data Triangulation
2.5 Research Assumptions
3 Executive Summary (Page No. - 25)
4 Premium Insights (Page No. - 30)
4.1 Attractive Opportunities in the Power System Simulator Market
4.2 Power System Simulator, By Country
4.3 North America Power System Simulator, By End-User & Country
4.4 Power System Simulator, By Offering
4.5 Power System Simulator, By Module
4.6 Power System Simulator, By End-User
5 Market Overview (Page No. - 35)
5.1 Introduction
5.2 New Technologies in Power Systems
5.3 Market Dynamics
5.4 Drivers
5.4.1 Reduction in Overall Project Time & Cost
5.4.2 Rising Adoption of IoT & Cloud Platforms
5.4.3 Booming Power Sector & Augmented Power Generation Capacities Worldwide
5.5 Restraints
5.5.1 Risk to Data Security
5.6 Opportunities
5.6.1 Growing Smart Manufacturing Capabilities Especially in Middle East
5.6.2 Development of Smart Cities
5.7 Challenges
5.7.1 Stagnant Growth of the Oil & Gas Industry
5.7.2 Slowdown in the Mining Industry in Asia Pacific, South America, & Africa
6 Power System Simulator Market, By Module (Page No. - 42)
6.1 Introduction
6.2 Load Flow
6.3 Short Circuit
6.4 Device Coordination Selectivity
6.5 Arc Flash
6.6 Harmonics
6.7 Others
7 Power System Simulator Market, By Offering (Page No. - 48)
7.1 Introduction
7.2 Hardware
7.3 Software
7.4 Services
8 Power System Simulator Market, By End-User (Page No. - 52)
8.1 Introduction
8.2 Power
8.3 Industrial
8.4 Others
9 Power System Simulator Market, By Region (Page No. - 59)
9.1 Introduction
9.2 North America
9.2.1 By Offering
9.2.2 By End-User
9.2.3 By Country
9.2.3.1 US
9.2.3.2 Canada
9.2.3.3 Mexico
9.3 Europe
9.3.1 By Offering
9.3.2 By End-User
9.3.3 By Country
9.3.3.1 Russia
9.3.3.2 UK
9.3.3.3 Germany
9.3.3.4 France
9.3.3.5 Norway
9.3.3.6 Rest of Europe
9.4 Asia Pacific
9.4.1 By Offering
9.4.2 By End-User
9.4.3 By Country
9.4.3.1 China
9.4.3.2 Japan
9.4.3.3 India
9.4.3.4 South Korea
9.4.3.5 Rest of Asia Pacific
9.5 Middle East
9.5.1 By Offering
9.5.2 By End-User
9.5.3 By Country
9.5.3.1 Saudi Arabia
9.5.3.2 UAE
9.5.3.3 Qatar
9.5.3.4 Kuwait
9.5.3.5 Rest of the Middle East
9.6 South America
9.6.1 By Offering
9.6.2 By End-User
9.6.3 By Country
9.6.3.1 Brazil
9.6.3.2 Colombia
9.6.3.3 Argentina
9.6.3.4 Rest of South America
9.7 Africa
9.7.1 By Offering
9.7.2 By End-User
9.7.3 By Country
9.7.3.1 South Africa
9.7.3.2 Nigeria
9.7.3.3 Egypt
9.7.3.4 Rest of Africa
10 Competitive Landscape (Page No. - 97)
10.1 Introduction
10.2 Ranking of Players and Industry Concentration, 2016
10.3 Competitive Scenario
10.3.1 Contracts & Agreements
10.3.2 New Product Launches
10.3.3 Investments & Expansions
10.3.4 Partnerships & Collaborations
10.3.5 Others
11 Company Profiles (Page No. - 102)
(Overview, Products Offered, Recent Developments, SWOT Analysis, MnM View)*
11.1 ABB
11.2 Schneider Electric
11.3 Siemens
11.4 Eaton
11.5 GE
11.6 ETAP
11.7 OSI
11.8 Mathworks
11.9 Opal-RT
11.10 Powerworld
11.11 Neplan
11.12 Rtds Technologies
*Details on Overview, Products Offered, Recent Developments, SWOT Analysis, MnM View Might Not Be Captured in Case of Unlisted Companies.
12 Appendix (Page No. - 134)
12.1 Insights of Industry Experts
12.2 Discussion Guide
12.3 Knowledge Store: Marketsandmarkets� Subscription Portal
12.4 Introducing RT: Real-Time Market Intelligence
12.5 Available Customizations
12.6 Related Reports
12.7 Author Details
List of Tables (73 Tables)
Table 1 Power System Simulator Market Snapshot
Table 2 Market Size, By Module, 2015�2022 (USD Million)
Table 3 Load Flow: Market Size, By End-User, 2015�2022 (USD Million)
Table 4 Short Circuit: Market Size, By End-User, 2015�2022 (USD Million)
Table 5 Device Coordination Selectivity: Market Size, By End-User, 2015�2022 (USD Million)
Table 6 Arc Flash: Market Size, By End-User, 2015�2022 (USD Million)
Table 7 Harmonics: Market Size, By End-User, 2015�2022 (USD Million)
Table 8 Others: Market Size, By End-User, 2015�2022 (USD Million)
Table 9 Power System Simulator Market Size, By Offering, 2015�2022 (USD Million)
Table 10 Hardware: Market Size, By Region, 2015�2022 (USD Million)
Table 11 Software: Market Size, By Region, 2015�2022 (USD Million)
Table 12 Services: Market Size, By Region, 2015�2022 (USD Million)
Table 13 Market Size, By End-User, 2015�2022 (USD Million)
Table 14 Market Size, By Power, 2015�2022 (USD Million)
Table 15 Power: Market, By Region, 2015�2022 (USD Million)
Table 16 Power: Market, By Module, 2015�2022 (USD Million)
Table 17 Market Size, By Industrial, 2015�2022 (USD Million)
Table 18 Industrial: Market Size, By Region, 2015�2022 (USD Million)
Table 19 Industrial: Market Size, By Module, 2015�2022 (USD Million)
Table 20 Others: Market Size, By Region, 2015�2022 (USD Million)
Table 21 Others: Market Size, By Module, 2015�2022 (USD Million)
Table 22 Market Size, By Region, 2015�2022 (USD Million)
Table 23 North America: Power System Simulator Market Size, By Offering, 2015�2022 (USD Million)
Table 24 North America: Market Size, By End-User, 2015�2022 (USD Million)
Table 25 North America: Market Size, By Country, 2015�2022 (USD Million)
Table 26 US: Market Size, By End-User, 2015�2022 (USD Million)
Table 27 Canada: Market Size, By End-User, 2015�2022 (USD Million)
Table 28 Mexico: Market Size, By End-User, 2015�2022 (USD Million)
Table 29 Europe: Power System Simulator Market Size, By Offering, 2015�2022 (USD Million)
Table 30 Europe: Market Size, By End-User, 2015�2022 (USD Million)
Table 31 Europe: Market Size, By Country, 2015�2022 (USD Million)
Table 32 Russia: Market Size, By End-User, 2015�2022 (USD Million)
Table 33 UK: Market Size, By End-User, 2015�2022 (USD Million)
Table 34 Germany: Market Size, By End-User, 2015�2022 (USD Million)
Table 35 France: Market Size, By End-User, 2015�2022 (USD Million)
Table 36 Norway: Market Size, By End-User, 2015�2022 (USD Million)
Table 37 Rest of Europe: Market Size, By End-User, 2015�2022 (USD Million)
Table 38 Asia Pacific: Power System Simulator Market Size, By Offering, 2015�2022 (USD Million)
Table 39 Asia Pacific: Market Size, By End-User, 2015�2022 (USD Million)
Table 40 Asia Pacific: Market, By Country, 2015�2022 (USD Million)
Table 41 China: Market Size, By End-User, 2015�2022 (USD Million)
Table 42 Japan: Market Size, By End-User, 2015�2022 (USD Million)
Table 43 India: Market Size, By End-User, 2015�2022 (USD Million)
Table 44 South Korea: Market Size, By End-User, 2015�2022 (USD Million)
Table 45 Rest of Asia Pacific: Market Size, By End-User, 2015�2022 (USD Million)
Table 46 Middle East: Power System Simulator Market Size, By Offering, 2015�2022 (USD Million)
Table 47 Middle East: Market Size, By End-User, 2015�2022 (USD Million)
Table 48 Middle East: Market Size, By Country, 2015�2022 (USD Million)
Table 49 Saudi Arabia: Market Size, By End-User, 2015�2022 (USD Million)
Table 50 UAE: Market Size, By End-User, 2015�2022 (USD Million)
Table 51 Qatar: Market Size, By End-User, 2015�2022 (USD Million)
Table 52 Kuwait: Market Size, By End-User, 2015�2022 (USD Million)
Table 53 Rest of the Middle East: Market Size, By End-User, 2015�2022 (USD Million)
Table 54 South America: Power System Simulator Market Size, By Offering, 2015�2022 (USD Million)
Table 55 South America: Market Size, By End-User, 2015�2022 (USD Million)
Table 56 South America: Market, By Country, 2015�2022 (USD Million)
Table 57 Brazil: Market Size, By End-User, 2015�2022 (USD Million)
Table 58 Colombia: Market Size, By End-User, 2015�2022 (USD Million)
Table 59 Argentina: Market Size, By End-User, 2015�2022 (USD Million)
Table 60 Rest of South America: Market Size, By End-User, 2015�2022 (USD Thousand)
Table 61 Africa: Market Size, By Offering, 2015�2022 (USD Million)
Table 62 Africa: Market Size, By End-User, 2015�2022 (USD Million)
Table 63 Africa: Market Size, By Country, 2015�2022 (USD Million)
Table 64 South Africa: Market Size, By End-User, 2015�2022 (USD Million)
Table 65 Nigeria: Market Size, By End-User, 2015�2022 (USD Thousand)
Table 66 Egypt: Market Size, By End-User, 2015�2022 (USD Thousand)
Table 67 Rest of Africa: Market Size, By End-User, 2015�2022 (USD Thousand)
Table 68 Market Developments Between 2014 & 2017
Table 69 Contracts & Agreements, 2014�2017
Table 70 New Product Launches, 2014�2017
Table 71 Investments & Expansions, 2015�2017
Table 72 Partnerships & Collaborations, 2014�2017
Table 73 Others, 2014�2017
List of Figures (47 Figures)
Figure 1 Markets Covered: Power System Simulator Market
Figure 2 Research Design
Figure 3 Breakdown of Primary Interviews: By Company, Designation, & Region
Figure 4 Market Size Estimation Methodology: Bottom-Up Approach
Figure 5 Market Size Estimation Methodology: Top-Down Approach
Figure 6 Data Triangulation Methodology
Figure 7 North America Dominated the Power System Simulator in 2016
Figure 8 The Software Segment is Expected to Lead the Power System Simulator During the Forecast Period
Figure 9 The Power Segment is Expected to Dominate the Power System Simulator Market During the Forecast Period
Figure 10 The Load Flow Segment is Expected to Dominate the Power System Simulator During the Forecast Period
Figure 11 Augmented Power Generation Capacities & Reduction in Project Cost & Time are Expected to Drive the Power System Simulator Market During the Forecast Period
Figure 12 India, South Africa, & Saudi Arabia are Expected to Grow at the Highest CAGR During the Forecast Period
Figure 13 The US & the Power Segment Led the Market in North America
Figure 14 The Software Segment is Expected to Hold the Largest Share During the Forecast Period
Figure 15 The Load Flow Segment is Estimated to Lead the Power System Simulator Market During the Forecast Period
Figure 16 The Power Segment is Estimated to Lead the Power System Simulator Market During the Forecast Period
Figure 17 Conceptual Architecture of Digital Twin
Figure 18 Power System Simulator Market: Drivers, Restraints, Opportunities, & Challenges
Figure 19 Vietnam, Qatar, & China Contribute Heavily to the Growth of Power Generation in Asia Pacific, Middle East, & Africa
Figure 20 Corporate Networks are Highly Prone to Cyber-Attacks
Figure 21 Declining Oil Prices Affect Infrastructural Investments, 2014�2017
Figure 22 US: Value Added By the Mining Sector
Figure 23 The Load Flow Segment is Expected to Lead the Power System Simulator
Figure 24 The Software Segment Led the Power System Simulator in 2016
Figure 25 The Power Segment Led the Power System Simulator in 2016
Figure 26 The Middle East is Expected to Grow at the Highest CAGR During the Forecast Period
Figure 27 North America Led the Power System Simulator in 2016
Figure 28 North America: Market Snapshot
Figure 29 US: Power System Simulator Market, By End-User, 2017�2022
Figure 30 Europe: Market Snapshot
Figure 31 Russia: Market, By End-User, 2017�2022
Figure 32 China: Market, By End-User, 2017�2022
Figure 33 Saudi Arabia: Market, By End-User, 2017�2022
Figure 34 Brazil: Market, By End-User, 2017�2022
Figure 35 South Africa: Market, By End-User, 2017�2022
Figure 36 Key Developments in the Power System Simulator, 2014�2017
Figure 37 Top 5 Players Hold 60% Share of the Power Simulation System Market�
Figure 38 ABB: Company Snapshot
Figure 39 ABB: SWOT Analysis
Figure 40 Schneider Electric: Company Snapshot
Figure 41 Schneider Electric: SWOT Analysis
Figure 42 Siemens: Company Snapshot
Figure 43 Siemens: SWOT Analysis
Figure 44 Eaton: Company Snapshot
Figure 45 Eaton: SWOT Analysis
Figure 46 GE: Company Snapshot
Figure 47 GE: SWOT Analysis


Growth opportunities and latent adjacency in Power System Simulator Market