Powertrain Sensor Market by Sensor Type for ICE Vehicle (Position, Pressure, Speed, Temperature), Sensor Type for EV (Position, Temperature, Current, Voltage), Propulsion, Powertrain Subsystem, Vehicle Type, EV Type, and Region - Global Forecast to 2027


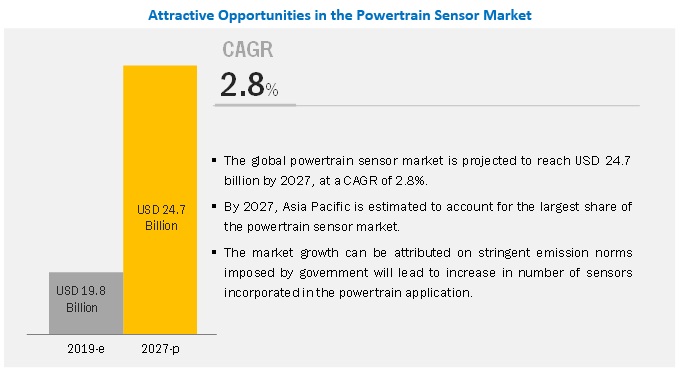
The global powertrain sensor market is projected to grow at a CAGR of 2.8% to reach USD 24.7 billion by 2027, from an estimated USD 19.8 billion in 2019. Increasing adoption of powertrain sensors required for better fuel economy and decrease in carbon emissions are the primary enablers for the growth of the market. However, decreasing price of powertrain sensors would restrain the growth of the market during the forecast period.
By powertrain subsystem: Engine subsystem is expected to be the largest segment
The engine powertrain subsystem segment is expected to be the largest market during the forecast period. Engine is the power generation subsystem of the powertrain. It converts chemical energy of the fuel into mechanical energy using various moving parts. These parts need to be monitored using a lot of sensors. Engine sensors include multiple pressure, position, speed, and temperature sensors. Moreover, OEMs across the globe are looking forward to modernization of engines. This would make vehicles more efficient and ensure lesser emissions. All these factors make the engine powertrain subsystem segment the largest for powertrain sensors.
By propulsion type: ICE propulsion segment is expected to dominate the powertrain sensor market
ICE propulsion is estimated to be the largest segment by propulsion type. Increasing adoption of HEVs and growing vehicle production equipped with traditional ICE drivetrains are the main factors contributing to the growth of this segment. Vehicles equipped with ICE propulsion are more popular among people across the globe. According to industry experts, the popularity of ICE propulsion will continue for the next decade. This also depends on government policies related to vehicle emissions.
By Vehicle Type: Heavy-duty vehicle segment is estimated to be the fastest during the forecast period
Heavy-duty vehicles include trucks and buses. Trucks and buses are being installed with advanced powertrain sensors with the upgrading of powertrains. Powertrains in heavy-duty vehicles have to be powerful enough to survive robust conditions. As a result of that, they are required to be installed with sensors that offer high operational efficiency. The market for heavy-duty vehicles in developing countries is flourishing day-by-day. These are a few of the factors contributing to the growth of the heavy-duty vehicle market for powertrain sensors.
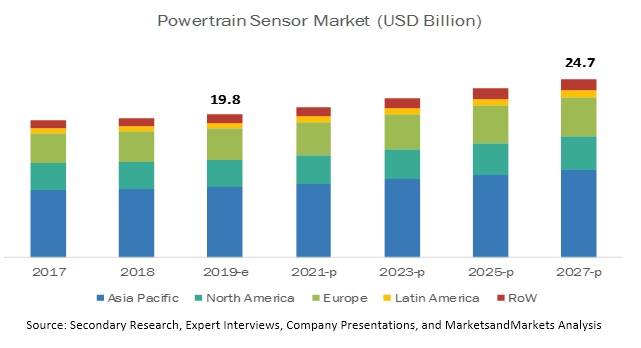
Asia Pacific is expected to account for the largest market size during the forecast period
The Asia Pacific market is estimated to be the largest during the forecast period. The region comprises some of the fastest developing economies of the world such as China and India. Also, Asia Pacific is the largest market for automotive as the growing purchasing power of consumers has triggered the demand for automobiles. Also, increasing sales of commercial vehicles and passenger cars in the region are driving the market. Many European and North American OEMs are entering the subcontinental markets and launching new vehicle models, considering the requirement of the demographics in the region. Hence, Asia Pacific is expected to show incremental growth during the forecast period.
Key Market Players
The major powertrain sensor market players include Bosch (Germany), Continental (Germany), Denso Corporation (Japan), Hella (Germany) Texas Instruments (US), and Aptiv (UK), among others. These companies have strong distribution networks at a global level. In addition, these companies offer an extensive product range. The key strategies adopted by these companies to sustain their market position are new product developments, collaborations, and contracts & agreements.
Scope of the Report:
|
Report Metric |
Details |
|
Market size available for years |
2017–2027 |
|
Base year considered |
2018 |
|
Forecast period |
2019–2027 |
|
Forecast units |
Value (USD) |
|
Segments covered |
Sensor type for ICE vehicle, sensor type for EV, propulsion type, powertrain subsystem, vehicle type, electric vehicle type, and region |
|
Geographies covered |
Asia Pacific, Europe, North America, Latin America, and Rest of the World |
|
Companies covered |
Bosch (Germany), Continental (Germany), Texas Instruments (US), Denso Corporation(Japan), Hella (Germany), Aptiv (UK), and others |
This research report categorizes the market based on application, hardware, deployment, vehicle type, and region.
Based on sensor type for ICE vehicle, the market has been segmented as follows:
- Position sensor
- Speed sensor
- Pressure sensor
- Temperature sensor
- Other sensors
Based on sensor type for EV, the market has been segmented as follows:
- Position sensor
- Temperature sensor
- Current sensor
- Voltage sensor
- Other sensors
Based on propulsion type, the market has been segmented as follows:
- ICE
- EV
Based on powertrain subsystem, the market has been segmented as follows:
- Engine
- Drivetrain
- Exhaust
Based on vehicle type, the market has been segmented as follows:
- Light-duty vehicle
- Heavy-duty vehicle
Based on electric vehicle type, the market has been segmented as follows:
- BEV
- HEV
- FCEV
- PHEV
Based on the region, the market has been segmented as follows:
-
Asia Pacific
- China
- India
- Japan
- South Korea
- Thailand
- Rest of Asia Pacific
-
Europe
- France
- Germany
- Russia
- Spain
- Turkey
- UK
- Rest of Europe
-
North America
- US
- Canada
- Mexico
-
Latin America
- Argentina
- Brazil
- Rest of Latin America
-
RoW
- Iran
- South Africa
- Rest of RoW
Recent Developments
- In October 2019, Melexis expanded its highly accurate pressure sensor portfolio with analog output sensor ICs. The MLX90817 and MLX90818 represent a significant step forward in terms of accuracy, size, and flexibility, and would make a significant contribution in ensuring that the engines of tomorrow are cleaner and more efficient than those of today.
- In August 2019, Continental expanded its Manesar plant in India to meet the requirements of safety technologies. The company is significantly increasing its capacity to produce speed sensors at its plant to meet the growing demand caused by recent safety and emission legislations in India.
- In May 2017, Denso developed the world’s first sensor to measure air/fuel ratio and NOx levels. The new sensor has been adopted for Toyota’s commercial diesel vehicles for countries outside Japan.
- In March 2017, In March 2017, Denso announced that it was using bio-polycarbonate (PC) made from starch and urethane resin extracted from castor oil in some of its products. Denso has been conducting R&D on plant-derived plastic materials based on plant molecular structures to reduce environmental impacts. Automotive exhaust gas sensors that measure the concentration of specific gases present in vehicle exhaust must have high heat resistance. Therefore, resins used in sensor control units have traditionally been expensive silicone-type resins. Denso’s newly developed urethane resin costs less than silicone resins and can withstand up to 150 °C, while significantly reducing the amount of gases produced when being melted and formed into shapes. This is the first such resin of its kind in the world.
- In February 2016, Continental introduced Urea Sensor for more efficient exhaust-gas aftertreatment in diesel engines. The sensors measure the level, quality, and temperature of the aqueous urea solution in the “AdBlue” tank, and ensure a lasting reduction in NOx emissions. By making an aqueous urea solution (“AdBlue” or urea solution) react with NOx in the engine exhaust, it chemically converts (“reduces”) NOx to nitrogen (N2) and water.
Critical Questions:
- How Tier I and Tier II are tuning powertrains to make the best fit for customized vehicles?
- How will the implementation of safety mandates and emission norms impact the overall market?
- What are powertrain sensor manufacturers doing to meet the requirements of smart powertrains?
- What could be the possible developments in electric vehicle powertrains? How could powertrain sensors be used in electric vehicles?
Frequently Asked Questions (FAQ):
What is the market size of the powertrain sensor market?
The powertrain sensor market is projected to grow to USD 24.7 billion by 2027 from USD 19.8 billion in 2019, at a CAGR of 2.8%.
Who are the top players in the powertrain sensor market? What are their organic & inorganic strategies?
Some of the key players in the automotive relay market are Bosch (Germany), Continental (Germany), Texas Instruments (US), Denso Corporation (Japan), Hella (Germany), Aptiv (UK). These companies have adopted strategies such as new product developments and collaborations to sustain their market position.
What are the main sensor that are used in the electric vehicle powertrain?
The passenger car segment is the fastest growing vehicle type in the side view camera system market. OEMs such as Lexus already launched vehicles with side view camera system in 2018. More such early adoptions by major automakers would further drive the passenger car segment.
What powertrain system comprises of maximum type of sensors?
In the ICE engine vehicles, engine sub-system of powertrain comprises of maximum number of sensors. Engine is the power generating unit of the vehicle. It has maximum number of moving parts as well as the parts which gets heated.
Which region is dominating the powertrain sensor market?
The Asia Pacific market is estimated to be the largest during the forecast period. The region comprises some of the fastest developing economies of the world such as China and India. Also, Asia Pacific is the largest market for automotive as the growing purchasing power of consumers has triggered the demand for automobiles. Also, increasing sales of commercial vehicles and passenger cars in the region are driving the market. .
To speak to our analyst for a discussion on the above findings, click Speak to Analyst
 Exclusive indicates content/data unique to MarketsandMarkets and not available with any competitors.
Table of Content
1 Introduction (Page No. - 20)
1.1 Objectives of the Study
1.2 Product Definition
1.2.1 Inclusions & Exclusions
1.3 Market Scope
1.3.1 Years Considered for the Study
1.4 Package Size
1.5 Limitations
1.6 Stakeholders
2 Research Methodology (Page No. - 23)
2.1 Research Data
2.2 Secondary Data
2.2.1 Key Secondary Sources
2.2.2 Key Data From Secondary Sources
2.3 Primary Data
2.3.1 Sampling Techniques & Data Collection Methods
2.3.2 Primary Participants
2.4 Market Size Estimation
2.4.1 Data Triangulation Approach
2.4.2 Bottom-Up Approach
2.5 Market Breakdown
2.6 Assumptions
2.7 Limitations
2.8 Risk Assessment & Ranges
3 Executive Summary (Page No. - 31)
4 Premium Insights (Page No. - 36)
4.1 Attractive Opportunities in the Powertrain Sensor Market
4.2 Market Share, By Region
4.3 Market, By Vehicle Type
4.4 Market, By Sensor Type for ICE Vehicle
4.5 Market, By Propulsion Type
4.6 Market, By Powertrain Subsystem
4.7 Market, By EV Type
5 Market Overview (Page No. - 40)
5.1 Introduction
5.2 Market Dynamics
5.2.1 Drivers
5.2.1.1 Increasing Awareness About Fuel Economy and Carbon Emissions Among People and Governments
5.2.1.2 Increasing Popularity of E-Mobility and Requirement of Sensors in Electric Powertrains
5.2.2 Restraints
5.2.2.1 Development of Control Units With Inbuilt Sensing Capabilities
5.2.2.2 Lack of Uniform Fabrication Process for Mems
5.2.3 Opportunities
5.2.3.1 Shifting Market and Revenue Pool Toward Developing Countries
5.2.4 Challenges
5.2.4.1 Integration Issues Between Oems, System Manufacturers, and Automobile Manufacturers
5.3 Powertrain Sensor Market, Scenarios (2017–2027)
5.3.1 Market: Most Likely Scenario
5.3.2 Market: Optimistic Scenario
5.3.3 Market: Pessimistic Scenario
5.4 Revenue Shift Driving the Market
5.5 Impact Analysis: Market
6 Industry Trends (Page No. - 47)
6.1 Powertrain Sensor Future Trend
6.1.1 Increasing Number of Sensors With Increased Technical Requirements in Modern Powertrain
6.2 Technology Overview
6.2.1 Sensor Technology
6.2.1.1 Types of Powertrain Sensors & Sensing Method
6.2.1.2 Piezo Resistive Silicon Strain Gauge
6.2.1.3 Thermistors
6.2.1.4 Potentiometer
6.3 Value Chain: Powertrain Sensor Market
6.4 Porter’s Five Forces
7 Powertrain Sensor Market, By Sensor Type for ICE Vehicle (Page No. - 50)
7.1 Introduction
7.1.1 Assumptions
7.1.2 Research Methodology for Sensor Type for ICE Vehicle Segment
7.2 Pressure Sensor
7.3 Temperature Sensor
7.4 Speed Sensor
7.5 Position Sensor
7.6 Other Sensors
7.7 Key Industry Insights
8 Powertrain Sensor Market, By Powertrain Subsystem (Page No. - 59)
8.1 Introduction
8.1.1 Assumptions
8.1.2 Research Methodology for Powertrain Subsystem Segment
8.2 Engine
8.2.1 Engine Coolant
8.2.2 Engine Oil Temperature
8.2.3 Engine Oil Pressure
8.2.4 Fuel Rail Pressure
8.2.5 Throttle Position
8.2.6 Camshaft Position
8.2.7 Crankshaft Position
8.2.8 Fuel Level
8.3 Transmission
8.3.1 Transmission Oil Temperature
8.3.2 Brake Vacuum Pressure
8.3.3 Transmission Input and Output Speed
8.3.4 Vehicle Speed
8.4 Exhaust
8.4.1 Manifold Air Temperature
8.4.2 Egr Position
8.4.3 Oxygen
8.4.4 Nox
8.4.5 Map
8.5 Key Industry Insights: Powertrain Subsystem Segment
9 Powertrain Sensor Market, By Propulsion Type (Page No. - 67)
9.1 Introduction
9.1.1 Research Methodology for Propulsion Segment
9.2 ICE Propulsion
9.3 EV Propulsion
9.4 Key Industry Insights: Propulsion Type Segment
10 Powertrain Sensor Market, By Vehicle Type (Page No. - 71)
10.1 Introduction
10.1.1 Assumptions
10.1.2 Research Methodology for Vehicle Segment
10.2 Light-Duty Vehicle (LDV)
10.3 Heavy-Duty Vehicle (HDV)
10.4 Key Industry Insights: Vehicle Type Segment
11 Powertrain Sensor Market, By Electric Vehicle Type (Page No. - 77)
11.1 Introduction
11.1.1 Assumptions
11.1.2 Research Methodology for Electric Vehicle Segment
11.2 BEV
11.3 PHEV
11.4 FCEV
11.5 Key Industry Insights: Electric Vehicle Type Segment
12 Powertrain Sensor Market, By Sensor Type for Electric Vehicle (Page No. - 83)
12.1 Introduction
12.1.1 Assumptions
12.1.2 Research Methodology for Sensor Type for Electric Vehicle Segment
12.2 Speed Sensor
12.3 Temperature Sensor
12.4 Pressure Sensor
12.5 Position Sensor
12.6 Current Sensor
12.7 Voltage Sensor
12.8 Other Sensors
12.9 Key Industry Insights: Sensor Type for Electric Vehicle Segment
13 Powertrain Sensor Market, By Region (Page No. - 90)
13.1 Introduction
13.1.1 Assumptions : Powertrain Sensor Market By Region
13.1.2 Research Methodology for Country-Wise Vehicle Type and Powertrain Subsystem Segments
13.2 Asia Pacific
13.2.1 China
13.2.1.1 Rise in Vehicle Production With Modern Body Control Functions to Drive the Chinese Market
13.2.2 India
13.2.2.1 Increasing Luxury Vehicle Sales to Drive the Indian Market
13.2.3 Japan
13.2.3.1 Significant Technology Adoption to Drive the Japanese Market
13.2.4 South Korea
13.2.4.1 Developments in Body Electronics and Reduction in Vehicle Body Weight to Drive the South Korean Market
13.2.5 Thailand
13.2.5.1 Thailand has the Largest Automotive Production Capacity Among Southeast Asian Countries
13.2.6 Rest of Asia Pacific
13.2.6.1 Increasing Sales of Premium Vehicles to Drive the Rest of Asia Pacific Market
13.3 Europe
13.3.1 Germany
13.3.1.1 Rising Adoption of Modern Technologies in Every Class of Light-Duty Vehicles to Drive the German Market
13.3.2 France
13.3.2.1 Rising Safety Concerns Among Vehicle Occupants to Drive the French Market
13.3.3 UK
13.3.3.1 Heavy Investments By Oems and Tier I and Ii Suppliers and Expected to Drive the UK Market
13.3.4 Spain
13.3.4.1 Increasing Production of D, E, and F Segment Light-Duty Vehicles to Drive the Spanish Market
13.3.5 Russia
13.3.5.1 Continuous Increase in Vehicle Sales to Drive the Russian Market
13.3.6 Turkey
13.3.6.1 Increasing Automotive Investments in Recent Years to Drive the Turkish Market
13.3.7 Rest of Europe
13.3.7.1 Continuous Growth of the Automotive Industry in Eastern Europe to Drive the Rest of European Market
13.4 North America
13.4.1 Canada
13.4.1.1 Increasing Use of Lcvs Equipped With Modern Electronic Architecture to Drive the Canadian Market
13.4.2 Mexico
13.4.2.1 Growth of Us-Mexico Trade to Drive the Mexican Market
13.4.3 US
13.4.3.1 Developments in the Field of Connected Cars and Nhtsa Mandates to Drive the US Market
13.5 Latin America
13.5.1 Brazil
13.5.1.1 Increasing Demand for Light-Duty Vehicles to Drive the Brazilian Market
13.5.2 Argentina
13.5.2.1 Increasing Sales of Luxury Vehicles to Drive the Argentinian Market
13.5.3 Rest of Latin America
13.5.3.1 Adoption of Modern Safety Technologies to Drive the Rest of Latin American Market
13.6 Rest of the World (RoW)
13.6.1 Iran
13.6.1.1 Increasing Sales of Luxury Vehicles to Drive the Iranian Market
13.6.2 South Africa
13.6.2.1 Increasing Demand for Light-Duty Vehicles to Drive the South African Market
13.6.3 Rest of RoW
13.6.3.1 Adoption of Modern Safety Technologies to Drive the Rest of RoW Market
13.7 Key Industry Insights
14 Competitive Landscape (Page No. - 130)
14.1 Overview
14.2 Powertrain Sensor: Market Ranking Analysis
14.3 Competitive Leadership Mapping
14.3.1 Visionary Leaders
14.3.2 Innovators
14.3.3 Dynamic Differentiators
14.3.4 Emerging Companies
14.4 Winners vs Tail-Enders
14.5 Competitive Scenario
14.5.1 New Product Developments/Launches
14.5.2 Expansions, 2018–2019
14.5.3 Agreements/Partnerships/Contracts, 2017–2019
15 Company Profiles (Page No. - 137)
(Business Overview, Products Offered, Recent Developments, SWOT Analysis & MnM View)*
15.1 Continental
15.2 Robert Bosch
15.3 Denso
15.4 Hella
15.5 Valeo
15.6 Mitsubishi Electric Corporation
15.7 Infineon Technologies
15.8 NXP Semiconductors
15.9 Texas Instruments
15.10 TE Connectivity
*Details on Business Overview, Products Offered, Recent Developments, SWOT Analysis & MnM View Might Not Be Captured in Case of Unlisted Companies.
15.11 Other Major Players
15.11.1 North America
15.11.1.1 Littlefuse
15.11.1.2 Sensata Technologies
15.11.1.3 Amphenol Technologies
15.11.1.4 Cts Corporation
15.11.1.5 Allegro Microsystems
15.11.2 Europe
15.11.2.1 Tdk–Micronas
15.11.2.2 Melexis
15.11.2.3 AMS AG
15.11.3 Asia Pacific
15.11.3.1 Semitec Electronics
15.11.3.2 Hyundai Kefico
16 Appendix (Page No. - 164)
16.1 Currency
16.2 Discussion Guide
16.3 Knowledge Store: Marketsandmarkets Subscription Portal
16.4 Available Customizations
16.5 Related Reports
16.6 Author Details
List of Tables (162 Tables)
Table 1 Inclusions & Exclusions for Powertrain Sensor Market
Table 2 Risk Assessment & Ranges
Table 3 Semiconductor Parameters According to Automotive Industry Requirements
Table 4 Market (Most Likely), By Region, 2017–2027 (USD Million)
Table 5 Market (Optimistic), By Region, 2017–2027 (USD Million)
Table 6 Market (Pessimistic), By Region, 2017–2027 (USD Million)
Table 7 Powertrain Sensor Types and Sensing Method
Table 8 Market, By Sensor Type for ICE Vehicle, 2017–2027 (Million Units)
Table 9 Market, By Sensor Type for ICE Vehicle, 2017–2027 (USD Million)
Table 10 Pressure Sensor: Market, By Region, 2017–2027 (Million Units)
Table 11 Pressure Sensor: Market, By Region, 2017–2027 (USD Million)
Table 12 Temperature Sensor: Market, By Region, 2017–2027 (Million Units)
Table 13 Temperature Sensor: Market, By Region, 2017–2027 (USD Million)
Table 14 Speed Sensor: Market, By Region, 2017–2027 (Million Units)
Table 15 Speed Sensor: Market, By Region, 2017–2027 (USD Million)
Table 16 Position Sensor: Market, By Region, 2017–2027 (Million Units)
Table 17 Position Sensor: Market, By Region, 2017–2027 (USD Million)
Table 18 Other Sensors: Market, By Region, 2017–2027 (Million Units)
Table 19 Other Sensors: Market, By Region, 2017–2027 (USD Million)
Table 20 Market, By Powertrain Subsystem, 2017–2027 (Million Units)
Table 21 Market, By Powertrain Subsystem, 2017–2027 (USD Million)
Table 22 Engine: Market, By Powertrain Sensor Type, 2017–2027 (Million Units)
Table 23 Engine: Market, By Powertrain Sensor Type, 2017–2027 (USD Million)
Table 24 Transmission: Market, By Powertrain Sensor Type, 2017–2027 (Million Units)
Table 25 Transmission: Market, By Powertrain Sensor Type, 2017–2027 (USD Million)
Table 26 Exhaust: Market, By Powertrain Sensor Type, 2017–2027 (Million Units)
Table 27 Exhaust: Market, By Powertrain Sensor Type, 2017–2027 (USD Million)
Table 28 ICE Propulsion: Market, By Region, 2017–2027 (Million Units)
Table 29 ICE Propulsion: Market, By Region, 2017–2027 (USD Million)
Table 30 EV Propulsion: Market, By Region, 2017–2027 (Million Units)
Table 31 EV Propulsion: Market, By Region, 2017–2027 (USD Million)
Table 32 Powertrain Sensor Market, By Vehicle Type, 2017–2027 (Million Units)
Table 33 Market, By Vehicle Type, 2017–2027 (USD Million)
Table 34 Light-Duty Vehicle: Market, By Region, 2017–2027 (Million Units)
Table 35 Light-Duty Vehicle: Market, By Region, 2017–2027 (USD Million)
Table 36 Heavy-Duty Vehicle: Market, By Region, 2017–2027 (Million Units)
Table 37 Heavy-Duty Vehicle: Market, By Region, 2017–2027 (USD Million)
Table 38 Market, By Electric Vehicle Type, 2017–2027 (Thousand Units)
Table 39 Market, By Electric Vehicle Type, 2017–2027 (USD Thousand)
Table 40 BEV: Market, By Region, 2017–2027 (Thousand Units)
Table 41 BEV: Market, By Region, 2017–2027 (USD Thousand)
Table 42 PHEV: Market, By Region, 2017–2027 (Thousand Units)
Table 43 PHEV: Market, By Region, 2017–2027 (USD Thousand)
Table 44 FCEV: Market, By Region, 2017–2027 (Thousand Units)
Table 45 FCEV: Market, By Region, 2017–2027 (USD Thousand)
Table 46 Market, By Sensor Type for Electric Vehicle, 2017–2027 (USD Thousand)
Table 47 Speed Sensor: Market, By Region, 2017–2027 (USD Thousand)
Table 48 Temperature Sensor: Market, By Region, 2017–2027 (USD Thousand)
Table 49 Pressure Sensor: Market, By Region, 2017–2027 (USD Thousand)
Table 50 Position Sensor: Market, By Region, 2017–2027 (USD Thousand)
Table 51 Current Sensor: Market, By Region, 2017–2027 (USD Thousand)
Table 52 Voltage Sensor: Market, By Region, 2017–2027 (USD Thousand)
Table 53 Other Sensors: Market, By Region, 2017–2027 (USD Thousand)
Table 54 Market, By Region, 2017–2027 (Million Units)
Table 55 Market, By Region, 2017–2027 (USD Million)
Table 56 Asia Pacific: Powertrain Sensor Market, By Country, 2017–2027 (Million Units)
Table 57 Asia Pacific: Market, By Country, 2017–2027 (USD Million)
Table 58 China: Market, By Sensor Type, 2017–2027 (USD Million)
Table 59 China: Market, By Vehicle Type, 2017–2027 (Million Units)
Table 60 China: Market, By Vehicle Type, 2017–2027 (USD Million)
Table 61 India: Market, By Sensor Type, 2017–2027 (USD Million)
Table 62 India: Market, By Vehicle Type, 2017–2027 (Million Units)
Table 63 India: Market, By Vehicle Type, 2017–2027 (USD Million)
Table 64 Japan: Market, By Sensor Type, 2017–2027 (USD Million)
Table 65 Japan: Market, By Vehicle Type, 2017–2027 (Million Units)
Table 66 Japan: Market, By Vehicle Type, 2017–2027 (USD Million)
Table 67 South Korea: Market, By Sensor Type, 2017–2027 (USD Million)
Table 68 South Korea: Market, By Vehicle Type, 2017–2027 (Million Units)
Table 69 South Korea: Market, By Vehicle Type, 2017–2027 (USD Million)
Table 70 Thailand: Market, By Sensor Type, 2017–2027 (USD Million)
Table 71 Thailand: Market, By Vehicle Type, 2017–2027 (Million Units)
Table 72 Thailand: Market, By Vehicle Type, 2017–2027 (USD Million)
Table 73 Rest of Asia Pacific: Market, By Sensor Type, 2017–2027 (USD Million)
Table 74 Rest of Asia Pacific: Market, By Vehicle Type, 2017–2027 (Million Units)
Table 75 Rest of Asia Pacific: Market, By Vehicle Type, 2017–2027 (USD Million)
Table 76 Europe: Market, By Country, 2017–2027 (Million Units)
Table 77 Europe: Market, By Country, 2017–2027 (USD Million)
Table 78 Germany: Market, By Sensor Type, 2017–2027 (USD Million)
Table 79 Germany: Market, By Vehicle Type, 2017–2027 (Million Units)
Table 80 Germany: Market, By Vehicle Type, 2017–2027 (USD Million)
Table 81 France: Market, By Sensor Type, 2017–2027 (USD Million)
Table 82 France: Market, By Vehicle Type, 2017–2027 (Million Units)
Table 83 France: Market, By Vehicle Type, 2017–2027 (USD Million)
Table 84 UK: Market, By Sensor Type, 2017–2027 (USD Million)
Table 85 UK: Market, By Vehicle Type, 2017–2027 (Million Units)
Table 86 UK: Market, By Vehicle Type, 2017–2027 (USD Million)
Table 87 Spain: Market, By Sensor Type, 2017–2027 (USD Million)
Table 88 Spain: Market, By Vehicle Type, 2017–2027 (Million Units)
Table 89 Spain: Market, By Vehicle Type, 2017–2027 (USD Million)
Table 90 Russia: Market, By Sensor Type, 2017–2027 (USD Million)
Table 91 Russia: Market, By Vehicle Type, 2017–2027 (Million Units)
Table 92 Russia: Market, By Vehicle Type, 2017–2027 (USD Million)
Table 93 Turkey: Market, By Sensor Type, 2017–2027 (USD Million)
Table 94 Turkey: Market, By Vehicle Type, 2017–2027 (Million Units)
Table 95 Turkey: Market, By Vehicle Type, 2017–2027 (USD Million)
Table 96 Rest of Europe: Market, By Sensor Type, 2017–2027 (USD Million)
Table 97 Rest of Europe: Market, By Vehicle Type, 2017–2027 (Million Units)
Table 98 Rest of Europe: Market, By Vehicle Type, 2017–2027 (USD Million)
Table 99 North America: Market, By Country, 2017–2027 (Million Units)
Table 100 North America: Market, By Country, 2017–2027 (USD Million)
Table 101 Canada: Market, By Sensor Type, 2017–2027 (USD Million)
Table 102 Canada: Market, By Vehicle Type, 2017–2027 (Million Units)
Table 103 Canada: Market, By Vehicle Type, 2017–2027 (USD Million)
Table 104 Mexico: Market, By Sensor Type, 2017–2027 (USD Million)
Table 105 Mexico: Market, By Vehicle Type, 2017–2027 (Million Units)
Table 106 Mexico: Market, By Vehicle Type, 2017–2027 (USD Million)
Table 107 US: Market, By Sensor Type, 2017–2027 (USD Million)
Table 108 US: Market, By Vehicle Type, 2017–2027 (Million Units)
Table 109 US: Market, By Vehicle Type, 2017–2027 (USD Million)
Table 110 Latin America: Market, By Country, 2017–2027 (Million Units)
Table 111 Latin America: Market, By Country, 2017–2027 (USD Million)
Table 112 Brazil: Market, By Sensor Type, 2017–2027 (USD Million)
Table 113 Brazil: Market, By Vehicle Type, 2017–2027 (Million Units)
Table 114 Brazil: Market, By Vehicle Type, 2017–2027 (USD Million)
Table 115 Argentina: Market, By Sensor Type, 2017–2027 (USD Million)
Table 116 Argentina: Market, By Vehicle Type, 2017–2027 (Million Units)
Table 117 Argentina: Market, By Vehicle Type, 2017–2027 (USD Million)
Table 118 Rest of Latin America: Market, By Sensor Type, 2017–2027 (USD Million)
Table 119 Rest of Latin America: Market, By Vehicle Type, 2017–2027 (Million Units)
Table 120 Rest of Latin America: Market, By Vehicle Type, 2017–2027 (USD Million)
Table 121 RoW: Market, By Country, 2017–2027 (Million Units)
Table 122 RoW: Market, By Country, 2017–2027 (USD Million)
Table 123 Iran: Market, By Sensor Type, 2017–2027 (USD Million)
Table 124 Iran: Market, By Vehicle Type, 2017–2027 (Million Units)
Table 125 Iran: Market, By Vehicle Type, 2017–2027 (USD Million)
Table 126 South Africa: Market, By Sensor Type, 2017–2027 (USD Million)
Table 127 South Africa: Market, By Vehicle Type, 2017–2027 (Million Units)
Table 128 South Africa: Market, By Vehicle Type, 2017–2027 (USD Million)
Table 129 Rest of RoW: Market, By Sensor Type, 2017–2027 (USD Million)
Table 130 Rest of RoW: Market, By Vehicle Type, 2017–2027 (Million Units)
Table 131 Rest of RoW: Powertrain Sensor Market, By Vehicle Type, 2017–2027 (USD Million)
Table 132 Winners vs. Tail-Enders
Table 133 Competitive Landscape: New Product Developments/Launches, 2017–2019
Table 134 Competitive Landscape: Expansions, 2018–2019
Table 135 Competitive Landscape: Agreements/Partnerships/Contracts, 2017–2019
Table 136 Continental: Key Financials
Table 137 Product Offerings : Continental
Table 138 Continental: Organic Growth Strategies (New Product Developments/ Expansions)
Table 139 Robert Bosch: Key Financials
Table 140 Product Offerings : Robert Bosch
Table 141 Robert Bosch: Organic Growth Strategy (New Product Developments/ Expansions)
Table 142 Robert Bosch: Inorganic Growth Strategy (Partnerships/Collaborations/ Joint Ventures/Mergers & Acquisitions)
Table 143 Denso: Key Financials
Table 144 Product Offerings : Denso Corporation
Table 145 Denso: Organic Growth Strategy (New Product Developments/Expansions)
Table 146 Hella: Key Financials
Table 147 Product Offerings: Hella
Table 148 Hella : Organic Growth Strategy (Expansion/New Product Development)
Table 149 Valeo: Key Financials
Table 150 Product Offerings : Valeo
Table 151 Infineon Technologies: Key Financials
Table 152 Product Offerings : Mitsubishi Electric Corporation
Table 153 Infineon Technologies: Key Financials
Table 154 Infineon: Organic Growth Strategy (Expansions/New Product Developments)
Table 155 NXP Semiconductors: Key Financials
Table 156 Product Offerings: NXP Semiconductors
Table 157 Texas Instruments : Key Financials
Table 158 Product Offerings: Texas Instruments
Table 159 TE Connectivity: Key Financials
Table 160 Product Offerings: TE Connectivity
Table 161 TE Connectivity: Organic Growth Strategy (Expansion/New Product Development)
Table 162 Currency Exchange Rates (W.R.T USD)
List of Figures (45 Figures)
Figure 1 Powertrain Sensor Market: Market Segmentation
Figure 2 Market: Research Design
Figure 3 Research Design Model
Figure 4 Breakdown of Primary Interviews
Figure 5 Bottom-Up Approach: Market
Figure 6 Data Triangulation
Figure 7 Revenue Shift Driving the Market Growth
Figure 8 Market: Market Dynamics
Figure 9 Impact Analysis: Market
Figure 10 Market, By Region, Growth Rate, 2019–2027
Figure 11 Market, By Sensor Type for ICE Vehicle, 2019 vs. 2027
Figure 12 Increasing Adoption of Modern Transmission is Expected to Boost the Market From 2019 to 2027
Figure 13 Latin America is Estimated to Be the Fastest Growing Region in Market From 2019 to 2027
Figure 14 Light-Duty Vehicle is Expected to Be the Largest Segment of Market By 2027 (USD Million)
Figure 15 Position Sensor is Expected to Be the Largest Segment of Market By 2027 (USD Billion)
Figure 16 EV Propulsion is Expected to Grow at the Highest CAGR in Market During the Forecast Period
Figure 17 Engine Subsystem is Expected to Dominate the Market By 2027
Figure 18 FCEV is Expected to Grow at the Highest CAGR During Forecast Period
Figure 19 Market Dynamics: Market
Figure 20 Impact Analysis: Market
Figure 21 Value Chain: Powertrain Sensor Market
Figure 22 Porter’s Five Forces: Market
Figure 23 Position Sensor Market to Dominate the Sensor Type Market for ICE Vehicle During the Forecast Period
Figure 24 Ldv Segment is Expected to Account for the Largest Market Share (USD Billion)
Figure 25 Market: Latin America is Estimated to Grow at the Fastest CAGR (2019–2027)
Figure 26 Asia Pacific: Market Snapshot
Figure 27 Europe: Market Snapshot
Figure 28 Powertrain Sensor: Market Ranking Analysis, 2019
Figure 29 Powertrain Sensor Manufacturers: Competitive Leadership Mapping (2018)
Figure 30 Companies Adopted New Product Development & Partnerships/ Agreements/Supply Contracts/Collaborations/Joint Ventures as the Key Growth Strategy, 2016–2019
Figure 31 Continental: Company Snapshot
Figure 32 Continental: SWOT Analysis
Figure 33 Robert Bosch: Company Snapshot
Figure 34 Robert Bosch: SWOT Analysis
Figure 35 Denso: Company Snapshot
Figure 36 Denso: SWOT Analysis
Figure 37 Hella: Company Snapshot
Figure 38 Hella: SWOT Analysis
Figure 39 Valeo: Company Snapshot
Figure 40 Valeo: SWOT Analysis
Figure 41 Mitsubishi Electric: Company Snapshot
Figure 42 Infineon: Company Snapshot
Figure 43 NXP Semiconductors: Company Snapshot
Figure 44 Texas Instruments: Company Snapshot
Figure 45 Te Connectivity: Company Snapshot
The study involved four major activities in estimating the market size for powertrain sensors. Exhaustive secondary research was done to collect information on the market, peer market, and parent market. The next step was to validate these findings, assumptions, and sizing with industry experts across value chains through primary research. Both top-down and bottom-up approaches were employed to estimate the overall market size. After that, market breakdown and data triangulation were used to estimate the market size of segments and subsegments.
Secondary Research
Various secondary sources have been used in the secondary research process to identify and collect information useful for an extensive commercial study of the global market. Secondary sources include company annual reports/presentations, press releases, industry association publications, India Electronics & Semiconductor Association, ARTEMIS Industry Association, European Automotive Research Partners Association (EARPA), International Organization of Motor Vehicle Manufacturers (OICA), American Association of Motor Vehicle Administrators (AAMVA), Automotive Component Manufacturers Association of India (ACMA), China Association Of Automobile Manufacturers (CAAM), automotive magazine articles, directories, technical handbooks, World Economic Outlook, trade websites, technical articles, and databases (MarkLines and Factiva).
Primary Research
Extensive primary research has been conducted after acquiring an understanding of the market scenario through secondary research. Several primary interviews have been conducted with market experts from the demand- and supply-side OEMs [(in terms of component supply), country-level government associations, and trade associations] and component manufacturers across five major regions-Asia Pacific, Europe, North America, Latin America, and the Rest of the World. Approximately 20% and 80% of primary interviews have been conducted from the demand and supply side, respectively. Primary data has been collected through questionnaires, emails, and telephonic interviews. In the canvassing of primaries, we have strived to cover various departments within organizations, such as sales, operations, and administration, to provide a holistic viewpoint in our report.
After interacting with industry experts, we have also conducted brief sessions with highly experienced independent consultants to reinforce the findings from our primaries. This, along with the in-house subject-matter expert’s opinions, has led us to the findings as described in the remainder of this report.
Following is the breakdown of primary respondents:
To know about the assumptions considered for the study, download the pdf brochure
Market Size Estimation
Both top-down and bottom-up approaches were used to estimate and validate the total size of the market. These methods were also used extensively to estimate the size of various subsegments in the market. The research methodology used to estimate the market size includes the following:
- Key players in the industry and markets have been identified through extensive secondary research
- The industry’s supply chain and market size, in terms of value, have been determined through primary and secondary research processes
- All percentage shares, splits, and breakdowns have been determined using secondary sources and verified through primary sources.
Data Triangulation
After arriving at the overall market size-using the market size estimation processes as explained above-the market was split into several segments and subsegments. To complete the overall market engineering process and arrive at the exact statistics of each market segment and subsegment, data triangulation and market breakdown procedures were employed, wherever applicable. The data was triangulated by studying various factors and trends from both the demand and supply sides.
Report Objectives
- To define, segment, analyze, and forecast the market size, in terms of value (USD million), and volume (thousand/million units) of the powertrain sensor market.
- To provide a detailed analysis of the numerous factors influencing the market (drivers, restraints, opportunities, and challenges).
- To define, describe, and project the market based on sensor type for ICE vehicle, sensor type for EV, propulsion type, powertrain subsystem, vehicle type, electric vehicle type, and region.
- To project the market in five key regions, namely, Asia Pacific, Europe, North America, Latin America, and the Rest of World (RoW).
- To analyze regional markets for growth trends, prospects, and their contribution to the overall market.
- To analyze the opportunities for stakeholders and provide details of the competitive landscape for the market leaders.
- To strategically shortlist and profile key players and comprehensively analyze their respective market share and core competencies.
- To analyze recent developments, alliances, joint ventures, product innovations, and mergers & acquisitions in the market.
Available Customizations
Detailed analysis of powertrain sensor market, Aftermarket
Company Information
- Profiling of Additional Market Players (Up to 3)


Growth opportunities and latent adjacency in Powertrain Sensor Market