Precision Viticulture Market by Technology (Guidance Systems, Remote Sensing, VRT), Application (Yield Monitoring, Field Mapping, Weather Tracking & Forecasting), Product/Service (Hardware, Software, Services) - Global Forecast to 2022


[171 Pages Report] The precision viticulture market was valued at USD 936.0 Million in 2016 and is projected to reach 1,546.6 Million by 2022, at a CAGR of 8.81% during the forecast period.
For More details on this research, Request Free Sample Report
The years considered for the study are as follows:
- Base year � 2016
- Estimated year � 2017
- Projected year � 2022
- Forecast period � 2017 to 2022
The objectives of the report
- Determining and projecting the size of the global market with respect to technology, application, product/service, and regional markets, over the period ranging from 2017 to 2022.
- Identifying attractive opportunities in the market by determining the largest and fastest-growing segments across regions.
- Analyzing the demand-side factors on the basis of the following:
- Impact of macroeconomic and microeconomic factors on the market
- Shifts in demand patterns across different subsegments and regions
Research Methodology:
- Major regions were identified, along with countries contributing the maximum share
- Secondary research was conducted to find the value of precision viticulture market for regions such as North America, Europe, Asia Pacific, South America, and RoW
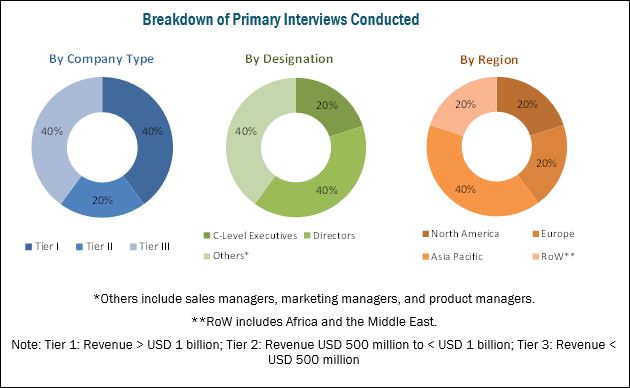
- The key players have been identified through secondary sources such as the US Department of Agriculture (USDA), the Food and Agriculture Organization (FAO), International Society of Precision Agriculture (ISPA), Society of Precision Agriculture Australia, and the Precision Agriculture Association NZ while their market share in respective regions was determined through both, primary and secondary research. The research methodology includes the study of annual and financial reports of top market players, as well as interviews with industry experts (such as CEOs, VPs, directors, and marketing executives) for key insights (both quantitative and qualitative) for the market.
To know about the assumptions considered for the study, download the pdf brochure
The various contributors involved in the value chain of the precision viticulture market include R&D institutes; software and hardware manufacturing companies such as John Deere (US), Trimble (US), Topcon (Japan), Deveron UAS (Canada); and government bodies & regulatory associations such as the US Department of Agriculture (USDA) and the Food and Agriculture Organization (FAO).
Target Audience:
The stakeholders for the report are as follows:
- Supply side: Software and hardware providers, suppliers, distributors, importers, exporters and service providers
- Demand-side: Vineyard maintenance personnel, turnkey contractors, software manufacturers, farmers, farmer�s organizations, and component suppliers
- Regulatory side: Concerned government authorities, commercial research & development (R&D) institutions, and other regulatory bodies
- Other related associations, research organizations, and industry bodies: The Food and Agriculture Organization (FAO), the US Food & Drug Administration (FDA), and the Society of Precision Agriculture
Scope of the Report:
This research report categorizes the precision viticulture market based on technology, application, product/service, and region.
Based on Technology, the market has been segmented as follows:
- Guidance systems
- Global positioning system (GPS)
- Geographic information system (GIS)
- Remote sensing
- Handheld
- Satellite sensing
- Variable rate technology
Based on Application, the market has been segmented as follows:
- Yield monitoring
- On-farm
- Off-farm
- Field mapping
- Boundary mapping
- Drainage mapping
- Crop scouting
- Weather tracking & forecasting
- Irrigation management
- Inventory management
- Farm labor management
- Financial management
- Others (demand forecasting, customer management, and profit center analysis)
Based on Product/Service, the market has been segmented as follows:
- Hardware
- Automation & control systems
- Sensing & monitoring devices
- Software
- Local/Web-based
- Cloud-based
- Services
- System integration and consulting
- Managed services
- Farm operation services
- Data services
- Analytics services
- Connectivity services
- Assisted professional services
- Supply chain professional services
- Climate information services
- Others (financial management and inventory management services)
- Maintenance & support
Based on Region, the market has been segmented as follows:
- North America
- Europe
- Asia Pacific
- South America
- RoW (the Middle East and Africa)
Available Customizations
With the given market data, MarketsandMarkets offers customizations according to the client-specific needs.
The following customization options are available for the report:
Product Analysis
- Product matrix, which gives a detailed comparison of the product portfolio of each company
Geographic Analysis
- Further breakdown of the Rest of Asia Pacific precision viticulture market
- Further breakdown of the Rest of European precision viticulture market
Application Breakdown
- Further breakdown of the open field applications of precision viticulture
Company Information
- Detailed analysis and profiling of additional market players (up to five)
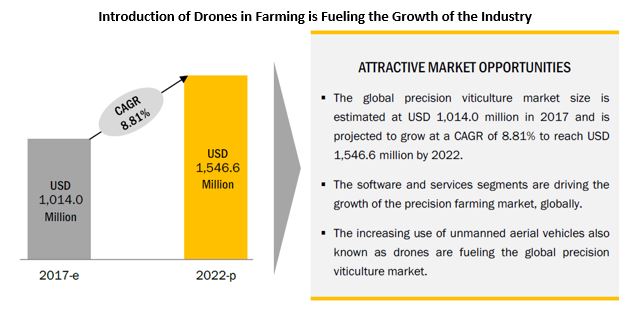
The precision viticulture market is projected to reach USD 1,546.6 Million by 2022 from USD 1,014.0 Million in 2017, growing at a CAGR of 8.81% during the forecast period. The availability of freeware geographical systems (GIS packages) with sophisticated functionality is expected to fuel the demand for precision viticulture technologies in the near future.
For More details on this research, Request Free Sample Report
Based on application, the market has been segmented into yield monitoring, crop scouting, field mapping, weather tracking & forecasting, irrigation management, inventory management, farm labor management, financial management, and others which include demand forecasting, customer management, and profit center analysis. The yield monitoring segment accounted for the largest market share of the global market in 2016. Yield monitoring provides winegrowers information about weather conditions, soil properties, and fertilizers which may affect the overall grain production. There are two approaches in yield monitoring, namely, on-farm yield monitoring and off-farm yield monitoring. On-farm yield monitoring is used to generate digital maps of vineyards, and the year-on-year trends could be used to improve farm management decisions and, ultimately, crop productivity. It also has various functions such as variety tracking, moisture tracking, and load tracking. The off-farm yield monitoring is generally applied for larger vineyards to reduce manpower and enable easy monitoring.
By technology, the precision viticulture market has been segmented into guidance systems, remote sensing, and variable rate technology. The guidance systems segment dominated the global market with the largest share in 2016. Guidance systems include global positioning system (GPS) and geographic information system (GIS). GPS is essential for most site-specific practices wherein a specific action is recorded and positioned to use the information for future treatments. This information is provided in real-time which means that the information is provided continuously even while being in motion. Whereas the GIS could be used to assess the present field information and provide alternative management by combining and manipulating data layers to make effective decisions.
Based on product/service, the market has been segmented into hardware, software, and services. The hardware segment accounted for the largest market share in 2016. The hardware segment is categorized into two types, namely, automation & control system and sensing & monitoring devices. Global positioning system (GPS)/global navigation satellite system (GNSS) devices accounted for the largest share of all the automation & control systems as GPS receivers are among the most widely used devices in many applications such as monitoring, mapping, and variable rate application (VRA). These devices are expected to grow at an average rate owing to their wide adoption in precision farming.
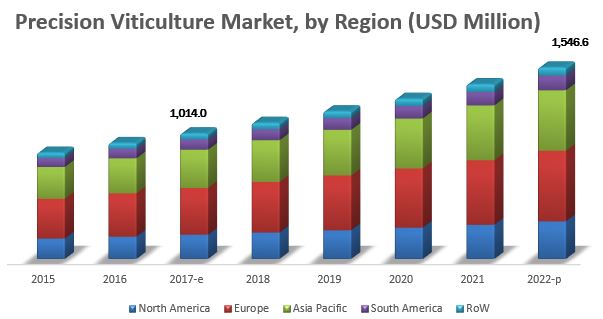
Asia Pacific accounted for the largest share in the global market, in terms of value, in 2016, owing to the increasing awareness about precision viticulture practices. The wide acceptance and availability of guidance systems, especially in countries such as Australia & New Zealand, China, and India along with its growth potential is the major driver contributing to the penetration of the market in the Asia Pacific precision viticulture industry. The use of innovative precision viticulture technologies such as VitiCanopy monitors the growth and health of the vineyard, along with the use of new yield monitoring solutions such as HarvestMaster Sensor System HM570, Canlink Grape Yield Monitor 3000GRM, and Advanced Technology and Viticulture (ATV), are which drive the growth of the market in the region.
The key players in global precision viticulture market include John Deere (US), Trimble (US), Topcon (Japan), Deveron UAS (Canada), and TeeJet Technologies (US). Other players in the market include Groupe ICV (France), Tracmap (New Zealand), QuantisLabs (Hungary), Terranis (France), Ateknea Solutions (Spain), AHA Viticulture (Australia), and AG Leader Technology (US).
To speak to our analyst for a discussion on the above findings, click Speak to Analyst
 Exclusive indicates content/data unique to MarketsandMarkets and not available with any competitors.
TABLE OF CONTENTS
1 INTRODUCTION (Page No. - 16)
1.1 OBJECTIVES OF THE STUDY
1.2 MARKET DEFINITION
1.3 STUDY SCOPE
FIGURE 1 MARKET SEGMENTATION
FIGURE 2 PRECISION VITICULTURE MARKET, REGIONAL SCOPE
1.4 PERIODIZATION CONSIDERED FOR THE STUDY
1.5 CURRENCY CONSIDERED
TABLE 1 CURRENCY CONVERSION
1.6 STAKEHOLDERS
2 RESEARCH METHODOLOGY (Page No. - 20)
2.1 RESEARCH DATA
FIGURE 3 MARKET FOR PRECISION VITICULTURE: RESEARCH DESIGN
2.1.1 SECONDARY DATA
2.1.2 PRIMARY DATA
2.1.2.1 Key industry insights
2.1.2.2 Breakdown of primaries
FIGURE 4 BREAKDOWN OF PRIMARY INTERVIEWS: BY COMPANY TYPE, DESIGNATION, AND REGION
2.2 MARKET SIZE ESTIMATION
FIGURE 5 MARKET SIZE ESTIMATION: BOTTOM-UP APPROACH
FIGURE 6 MARKET SIZE ESTIMATION METHODOLOGY: TOP-DOWN APPROACH
2.3 DATA TRIANGULATION
FIGURE 7 DATA TRIANGULATION
2.4 RESEARCH ASSUMPTIONS & LIMITATIONS
2.4.1 ASSUMPTIONS
2.4.2 LIMITATIONS
3 EXECUTIVE SUMMARY (Page No. - 28)
FIGURE 8 PRECISION VITICULTURE MARKET SNAPSHOT, 2017 VS. 2022
FIGURE 9 MARKET FOR PRECISION VITICULTURE, BY APPLICATION, 2017 VS. 2022
FIGURE 10 MARKET SHARE (VALUE), GEOGRAPHICAL OVERVIEW, 2016
4 PREMIUM INSIGHTS (Page No. - 32)
4.1 ATTRACTIVE GROWTH OPPORTUNITIES IN GLOBAL MARKET
FIGURE 11 INTRODUCTION OF DRONES IN FARMING IS FUELING THE GROWTH OF THE INDUSTRY
4.2 EUROPE: MARKET FOR PRECISION VITICULTURE, BY TECHNOLOGY & COUNTRY
FIGURE 12 SPAIN AND GUIDANCE SYSTEMS WERE THE LARGEST IN THEIR RESPECTIVE SEGMENTS OF THE GLOBAL MARKET
4.3 MARKET FOR PRECISION VITICULTURE, BY PRODUCT/SERVICE
FIGURE 13 HARDWARE SEGMENT TO DOMINATE THE MARKET DURING THE FORECAST PERIOD
4.4 MARKET FOR PRECISION VITICULTURE, BY YIELD MONITORING
FIGURE 14 ON-FARM DOMINATED THE YIELD MONITORING APPLICATION ACROSS ALL REGIONS IN 2016
4.5 MARKET FOR PRECISION VITICULTURE, BY APPLICATION
FIGURE 15 YIELD MONITORING SEGMENT TO DOMINATE THE GLOBAL MARKET BETWEEN 2017 TO 2022
4.6 MARKET FOR PRECISION VITICULTURE, BY REGION
FIGURE 16 EUROPE ACCOUNTS FOR THE LARGEST SHARE IN GLOBAL MARKET
5 MARKET OVERVIEW (Page No. - 38)
5.1 INTRODUCTION
5.2 MARKET DYNAMICS
FIGURE 17 MARKET DYNAMICS
5.2.1 DRIVERS
5.2.1.1 Increase in focus on farm efficiency and productivity
5.2.1.2 Increase in demand for high-quality grapes
FIGURE 18 AREA UNDER VINES DESTINED FOR THE PRODUCTION OF WINE, TABLE, AND DRIED GRAPES, 2012�2016
FIGURE 19 TREND OF GLOBAL GRAPE PRODUCTION, 2006�2016
5.2.1.3 Growth in adoption of new technologies in farming for maximum profitability and production
5.2.1.4 Government support for the adoption of modern viticulture techniques
5.2.1.5 Rise in need for monitoring grape quality
5.2.2 RESTRAINTS
5.2.2.1 High initial capital investments
5.2.2.2 Lack of technical knowledge
5.2.2.3 Dependence on conventional vineyard management practices
5.2.3 OPPORTUNITIES
5.2.3.1 Integration of smartphones with agricultural hardware and software applications
TABLE 2 VINEYARD MANAGEMENT SOFTWARE AND APPS FOR PRECISION FARMING
5.2.3.2 Increase in usage of unmanned aerial vehicles (UAVs)/drones in precision viticulture
5.2.4 CHALLENGES
5.2.4.1 Management of data for productive decision making
5.2.4.2 Lack of standardization in the precision viticulture industry
6 PRECISION VITICULTURE MARKET, BY TECHNOLOGY (Page No. - 45)
6.1 INTRODUCTION
FIGURE 20 GUIDANCE SYSTEMS SEGMENT TO FORM THE LARGEST MARKET BY 2022
TABLE 3 MARKET SIZE FOR PRECISION VITICULTURE, BY TECHNOLOGY, 2015�2022 (USD MILLION)
6.2 GUIDANCE SYSTEMS
TABLE 4 GUIDANCE SYSTEMS: MARKET SIZE FOR PRECISION VITICULTURE, BY REGION, 2015�2022 (USD MILLION)
TABLE 5 MARKET SIZE FOR PRECISION VITICULTURE, BY GUIDANCE SYSTEMS, 2015�2022 (USD MILLION)
6.2.1 GLOBAL POSITIONING SYSTEM (GPS)
6.2.2 GEOGRAPHICAL INFORMATION SYSTEM (GIS)
6.3 REMOTE SENSING
TABLE 6 REMOTE SENSING: MARKET SIZE FOR PRECISION VITICULTURE, BY REGION, 2015�2022 (USD MILLION)
TABLE 7 MARKET SIZE FOR PRECISION VITICULTURE, BY REMOTE SENSING, 2015�2022 (USD MILLION)
6.3.1 HANDHELD SENSING
6.3.2 SATELLITE SENSING
6.4 VARIABLE RATE TECHNOLOGY
TABLE 8 VARIABLE RATE TECHNOLOGY: MARKET SIZE FOR PRECISION VITICULTURE, BY REGION, 2015�2022 (USD MILLION)
TABLE 9 MARKET SIZE FOR PRECISION VITICULTURE, BY VARIABLE RATE TECHNOLOGY, 2015�2022 (USD MILLION)
6.4.1 MAP-BASED
6.4.2 SENSOR-BASED
7 PRECISION VITICULTURE MARKET, BY APPLICATION (Page No. - 54)
7.1 INTRODUCTION
FIGURE 21 YIELD MONITORING IS PROJECTED TO BE THE LARGEST SEGMENT DURING THE FORECAST PERIOD
TABLE 10 MARKET SIZE FOR PRECISION VITICULTURE, BY APPLICATION, 2015�2022 (USD MILLION)
7.2 YIELD MONITORING
TABLE 11 BENEFITS OF YIELD MONITORING
TABLE 12 YIELD MONITORING: MARKET SIZE FOR PRECISION VITICULTURE, BY REGION, 2015�2022 (USD MILLION)
TABLE 13 MARKET SIZE FOR PRECISION VITICULTURE, BY YIELD MONITORING, 2015�2022 (USD MILLION)
7.2.1 ON-FARM YIELD MONITORING
7.2.2 OFF-FARM YIELD MONITORING
7.3 FIELD MAPPING
TABLE 14 FIELD MAPPING: MARKET SIZE FOR PRECISION VITICULTURE, BY REGION, 2015�2022 (USD MILLION)
TABLE 15 MARKET SIZE FOR PRECISION VITICULTURE, BY FIELD MAPPING, 2015�2022 (USD MILLION)
7.3.1 BOUNDARY MAPPING
7.3.2 DRAINAGE MAPPING
7.4 CROP SCOUTING
TABLE 16 CROP SCOUTING: PRECISION VITICULTURE MARKET SIZE, BY REGION, 2015�2022 (USD MILLION)
7.5 WEATHER TRACKING & FORECASTING
TABLE 17 WEATHER TRACKING & FORECASTING: MARKET SIZE FOR PRECISION VITICULTURE, BY REGION, 2015�2022 (USD MILLION)
7.6 IRRIGATION MANAGEMENT
TABLE 18 IRRIGATION MANAGEMENT: PRECISION VITICULTURE MARKET SIZE, BY REGION, 2015�2022 (USD MILLION)
7.7 INVENTORY MANAGEMENT
TABLE 19 INVENTORY MANAGEMENT: MARKET SIZE FOR PRECISION VITICULTURE, BY REGION, 2015�2022 (USD MILLION)
7.8 FARM LABOR MANAGEMENT
TABLE 20 FARM LABOR MANAGEMENT: MARKET SIZE FOR PRECISION VITICULTURE, BY REGION, 2015�2022 (USD MILLION)
7.9 FINANCIAL MANAGEMENT
TABLE 21 FINANCIAL MANAGEMENT: MARKET SIZE FOR PRECISION VITICULTURE, BY REGION, 2015�2022 (USD MILLION)
7.10 OTHER APPLICATIONS
TABLE 22 OTHER APPLICATIONS: MARKET SIZE FOR PRECISION VITICULTURE, BY REGION, 2015�2022 (USD MILLION)
8 PRECISION VITICULTURE MARKET, BY PRODUCT/SERVICE (Page No. - 66)
8.1 INTRODUCTION
FIGURE 22 PRECISION VITICULTURE MARKET SIZE, BY PRODUCT/SERVICE, 2017 VS. 2022 (USD MILLION)
TABLE 23 MARKET SIZE FOR PRECISION VITICULTURE, BY PRODUCT/SERVICE, 2015�2022 (USD MILLION)
8.2 HARDWARE
TABLE 24 PRECISION VITICULTURE HARDWARE MARKET SIZE, BY REGION, 2015�2022 (USD MILLION)
TABLE 25 MARKET SIZE FOR PRECISION VITICULTURE, BY HARDWARE, 2015�2022 (USD MILLION)
8.2.1 AUTOMATION & CONTROL SYSTEMS
8.2.2 SENSING & MONITORING DEVICES
8.3 SOFTWARE
TABLE 26 PRECISION VITICULTURE SOFTWARE MARKET SIZE, BY REGION, 2015�2022 (USD MILLION)
TABLE 27 MARKET SIZE FOR PRECISION VITICULTURE, BY SOFTWARE, 2015�2022 (USD MILLION)
8.3.1 LOCAL/WEB-BASED
8.3.2 CLOUD-BASED
8.4 SERVICES
TABLE 28 PRECISION VITICULTURE SERVICES MARKET SIZE, BY REGION, 2015�2022 (USD MILLION)
TABLE 29 PRECISION VITICULTURE MARKET SIZE, BY SERVICE, 2015�2022 (USD MILLION)
8.4.1 SYSTEM INTEGRATION AND CONSULTING
8.4.2 MANAGED SERVICES
TABLE 30 MARKET SIZE FOR PRECISION VITICULTURE, BY MANAGED SERVICES, 2015�2022 (USD MILLION)
8.4.2.1 Farm Operation Services
8.4.2.2 Data Services
8.4.3 CONNECTIVITY SERVICES
8.4.4 ASSISTED PROFESSIONAL SERVICES
8.4.4.1 Supply Chain Profession Services
8.4.4.2 Climate Information Services
8.4.4.3 Others
8.4.5 MAINTENANCE & SUPPORT
9 PRECISION VITICULTURE MARKET, BY REGION (Page No. - 76)
9.1 INTRODUCTION
FIGURE 23 EUROPE TO DOMINATE THE PRECISION VITICULTURE MARKET BY 2022
TABLE 31 MARKET SIZE FOR PRECISION VITICULTURE, BY REGION, 2015�2022 (USD MILLION)
FIGURE 24 AUSTRALIA & NEW ZEALAND TO BE THE MOST ATTRACTIVE MARKET FOR PRECISION VITICULTURE (2017�2022)
9.2 NORTH AMERICA
TABLE 32 NORTH AMERICA: PRECISION VITICULTURE MARKET SIZE, BY COUNTRY, 2015�2022 (USD MILLION)
TABLE 33 NORTH AMERICA: MARKET SIZE FOR PRECISION VITICULTURE, BY TECHNOLOGY, 2015�2022 (USD MILLION)
TABLE 34 NORTH AMERICA: MARKET SIZE FOR PRECISION VITICULTURE, BY GUIDANCE SYSTEMS, 2015�2022 (USD MILLION)
TABLE 35 NORTH AMERICA: MARKET SIZE FOR PRECISION VITICULTURE, BY REMOTE SENSING, 2015�2022 (USD MILLION)
TABLE 36 NORTH AMERICA: MARKET SIZE FOR PRECISION VITICULTURE, BY VARIABLE RATE TECHNOLOGY, 2015�2022 (USD MILLION)
TABLE 37 NORTH AMERICA: MARKET SIZE FOR PRECISION VITICULTURE, BY APPLICATION, 2015�2022 (USD MILLION)
TABLE 38 NORTH AMERICA: MARKET SIZE FOR PRECISION VITICULTURE, BY YIELD MONITORING, 2015�2022 (USD MILLION)
TABLE 39 NORTH AMERICA: MARKET SIZE FOR PRECISION VITICULTURE, BY FIELD MAPPING, 2015�2022 (USD MILLION)
TABLE 40 NORTH AMERICA: MARKET SIZE FOR PRECISION VITICULTURE, BY PRODUCT/SERVICE, 2015�2022 (USD MILLION)
TABLE 41 NORTH AMERICA: MARKET SIZE FOR PRECISION VITICULTURE, BY HARDWARE, 2015�2022 (USD MILLION)
TABLE 42 NORTH AMERICA: MARKET SIZE FOR PRECISION VITICULTURE, BY SOFTWARE, 2015�2022 (USD MILLION)
TABLE 43 NORTH AMERICA: MARKET SIZE FOR PRECISION VITICULTURE, BY SERVICE, 2015�2022 (USD MILLION)
TABLE 44 NORTH AMERICA: MARKET SIZE FOR PRECISION VITICULTURE, BY MANAGED SERVICE, 2015�2022 (USD MILLION)
9.2.1 US
9.2.2 CANADA
9.2.3 MEXICO
9.3 EUROPE
FIGURE 25 EUROPEAN PRECISION VITICULTURE MARKET SNAPSHOT
TABLE 45 EUROPE: MARKET SIZE FOR PRECISION VITICULTURE, BY COUNTRY, 2015�2022 (USD MILLION)
TABLE 46 EUROPE: MARKET SIZE FOR PRECISION VITICULTURE, BY TECHNOLOGY, 2015�2022 (USD MILLION)
TABLE 47 EUROPE: MARKET SIZE FOR PRECISION VITICULTURE, BY GUIDANCE SYSTEMS, 2015�2022 (USD MILLION)
TABLE 48 EUROPE: MARKET SIZE FOR PRECISION VITICULTURE, BY REMOTE SENSING, 2015�2022 (USD MILLION)
TABLE 49 EUROPE: MARKET SIZE FOR PRECISION VITICULTURE, BY VARIABLE RATE TECHNOLOGY, 2015�2022 (USD MILLION)
TABLE 50 EUROPE: MARKET SIZE FOR PRECISION VITICULTURE, BY APPLICATION, 2015�2022 (USD MILLION)
TABLE 51 EUROPE: MARKET SIZE FOR PRECISION VITICULTURE, BY YIELD MONITORING, 2015�2022 (USD MILLION)
TABLE 52 EUROPE: MARKET SIZE FOR PRECISION VITICULTURE, BY FIELD MAPPING, 2015�2022 (USD MILLION)
TABLE 53 EUROPE: MARKET SIZE FOR PRECISION VITICULTURE, BY PRODUCT/SERVICE, 2015�2022 (USD MILLION)
TABLE 54 EUROPE: MARKET SIZE FOR PRECISION VITICULTURE, BY HARDWARE, 2015�2022 (USD MILLION)
TABLE 55 EUROPE: MARKET SIZE FOR PRECISION VITICULTURE, BY SOFTWARE, 2015�2022 (USD MILLION)
TABLE 56 EUROPE: MARKET SIZE FOR PRECISION VITICULTURE, BY SERVICE, 2015�2022 (USD MILLION)
TABLE 57 EUROPE: MARKET SIZE FOR PRECISION VITICULTURE, BY MANAGED SERVICES, 2015�2022 (USD MILLION)
9.3.1 SPAIN
9.3.2 FRANCE
9.3.3 ITALY
9.3.4 PORTUGAL
9.3.5 REST OF EUROPE
9.4 ASIA PACIFIC
FIGURE 26 OVERVIEW OF THE PRECISION VITICULTURE MARKET IN ASIA PACIFIC
TABLE 58 ASIA PACIFIC: PRECISION VITICULTURE MARKET SIZE, BY COUNTRY, 2015�2022 (USD MILLION)
TABLE 59 ASIA PACIFIC: MARKET SIZE FOR PRECISION VITICULTURE, BY TECHNOLOGY, 2015�2022 (USD MILLION)
TABLE 60 ASIA PACIFIC: MARKET SIZE FOR PRECISION VITICULTURE, BY GUIDANCE SYSTEMS, 2015�2022 (USD MILLION)
TABLE 61 ASIA PACIFIC: MARKET SIZE FOR PRECISION VITICULTURE, BY REMOTE SENSING, 2015�2022 (USD MILLION)
TABLE 62 ASIA PACIFIC: MARKET SIZE FOR PRECISION VITICULTURE, BY VARIABLE RATE TECHNOLOGY, 2015�2022 (USD MILLION)
TABLE 63 ASIA PACIFIC: MARKET SIZE FOR PRECISION VITICULTURE, BY APPLICATION, 2015�2022 (USD MILLION)
TABLE 64 ASIA PACIFIC: MARKET SIZE FOR PRECISION VITICULTURE, BY YIELD MONITORING, 2015�2022 (USD MILLION)
TABLE 65 ASIA PACIFIC: MARKET SIZE FOR PRECISION VITICULTURE, BY FIELD MAPPING, 2015�2022 (USD MILLION)
TABLE 66 ASIA PACIFIC: MARKET SIZE FOR PRECISION VITICULTURE, BY PRODUCT/SERVICE, 2015�2022 (USD MILLION)
TABLE 67 ASIA PACIFIC: MARKET SIZE FOR PRECISION VITICULTURE, BY HARDWARE, 2015�2022 (USD MILLION)
TABLE 68 ASIA PACIFIC: MARKET SIZE FOR PRECISION VITICULTURE, BY SOFTWARE, 2015�2022 (USD MILLION)
TABLE 69 ASIA PACIFIC:MARKET SIZE FOR PRECISION VITICULTURE, BY SERVICES, 2015�2022 (USD MILLION)
TABLE 70 ASIA PACIFIC: MARKET SIZE FOR PRECISION VITICULTURE, BY MANAGED SERVICES, 2015�2022 (USD MILLION)
9.4.1 CHINA
9.4.2 INDIA
9.4.3 JAPAN
9.4.4 AUSTRALIA & NEW ZEALAND
9.4.5 REST OF ASIA PACIFIC
9.5 SOUTH AMERICA
TABLE 71 SOUTH AMERICA: PRECISION VITICULTURE MARKET SIZE, BY COUNTRY, 2015�2022 (USD MILLION)
TABLE 72 SOUTH AMERICA: MARKET SIZE FOR PRECISION VITICULTURE, BY TECHNOLOGY, 2015�2022 (USD MILLION)
TABLE 73 SOUTH AMERICA: MARKET SIZE FOR PRECISION VITICULTURE, BY GUIDANCE SYSTEMS, 2015�2022 (USD MILLION)
TABLE 74 SOUTH AMERICA: MARKET SIZE FOR PRECISION VITICULTURE, BY REMOTE SENSING, 2015�2022 (USD MILLION)
TABLE 75 SOUTH AMERICA: MARKET SIZE FOR PRECISION VITICULTURE, BY VARIABLE RATE TECHNOLOGY, 2015�2022 (USD MILLION)
TABLE 76 SOUTH AMERICA: MARKET SIZE FOR PRECISION VITICULTURE, BY APPLICATION, 2015�2022 (USD MILLION)
TABLE 77 SOUTH AMERICA: MARKET SIZE FOR PRECISION VITICULTURE, BY YIELD MONITORING, 2015�2022 (USD MILLION)
TABLE 78 SOUTH AMERICA: MARKET SIZE FOR PRECISION VITICULTURE, BY FIELD MAPPING, 2015�2022 (USD MILLION)
TABLE 79 SOUTH AMERICA: MARKET SIZE FOR PRECISION VITICULTURE, BY PRODUCT/SERVICE, 2015�2022 (USD MILLION)
TABLE 80 SOUTH AMERICA: MARKET SIZE FOR PRECISION VITICULTURE, BY HARDWARE, 2015�2022 (USD MILLION)
TABLE 81 SOUTH AMERICA: MARKET SIZE FOR PRECISION VITICULTURE, BY SOFTWARE, 2015�2022 (USD MILLION)
TABLE 82 SOUTH AMERICA: MARKET SIZE FOR PRECISION VITICULTURE, BY SERVICE, 2015�2022 (USD MILLION)
TABLE 83 SOUTH AMERICA: MARKET SIZE FOR PRECISION VITICULTURE, BY MANAGED SERVICE, 2015�2022 (USD MILLION)
9.5.1 BRAZIL
9.5.2 ARGENTINA
9.5.3 REST OF SOUTH AMERICA
9.6 REST OF THE WORLD (ROW)
TABLE 84 ROW: PRECISION VITICULTURE MARKET SIZE, BY REGION, 2015�2022 (USD MILLION)
TABLE 85 ROW: MARKET SIZE FOR PRECISION VITICULTURE, BY TECHNOLOGY, 2015�2022 (USD MILLION)
TABLE 86 ROW: MARKET SIZE FOR PRECISION VITICULTURE, BY GUIDANCE SYSTEMS, 2015�2022 (USD MILLION)
TABLE 87 ROW: MARKET SIZE FOR PRECISION VITICULTURE, BY REMOTE SENSING, 2015�2022 (USD MILLION)
TABLE 88 ROW: MARKET SIZE FOR PRECISION VITICULTURE, BY VARIABLE RATE TECHNOLOGY, 2015�2022 (USD MILLION)
TABLE 89 ROW: MARKET SIZE FOR PRECISION VITICULTURE, BY APPLICATION, 2015�2022 (USD MILLION)
TABLE 90 ROW: MARKET SIZE FOR PRECISION VITICULTURE, BY YIELD MONITORING, 2015�2022 (USD MILLION)
TABLE 91 ROW: MARKET SIZE FOR PRECISION VITICULTURE, BY FIELD MAPPING, 2015�2022 (USD MILLION)
TABLE 92 ROW: MARKET SIZE FOR PRECISION VITICULTURE, BY P, 2015�2022 (USD MILLION)
TABLE 93 ROW: MARKET SIZE FOR PRECISION VITICULTURE, BY HARDWARE, 2015�2022 (USD MILLION)
TABLE 94 ROW: MARKET SIZE FOR PRECISION VITICULTURE, BY SOFTWARE, 2015�2022 (USD MILLION)
TABLE 95 ROW: MARKET SIZE FOR PRECISION VITICULTURE, BY SERVICE, 2015�2022 (USD MILLION)
TABLE 96 ROW: MARKET SIZE FOR PRECISION VITICULTURE, BY MANAGED SERVICE, 2015�2022 (USD MILLION)
9.6.1 AFRICA
9.6.2 MIDDLE EAST
10 COMPETITIVE LANDSCAPE (Page No. - 117)
10.1 OVERVIEW
FIGURE 27 COMPANIES ADOPTED NEW PRODUCT DEVELOPMENT/LAUNCHES AND PRODUCT ENHANCEMENT AS THEIR KEY GROWTH STRATEGIES FROM 2015 TO 2018
10.2 MARKET RANKING, BY KEY PLAYER
FIGURE 28 MARKET RANKING OF PRECISION VITICULTURE INDUSTRY PLAYERS
10.3 COMPETITIVE SCENARIO
FIGURE 29 PRECISION VITICULTURE MARKET EVALUATION FRAMEWORK
10.3.1 ACQUISITIONS
10.3.2 NEW PRODUCT DEVELOPMENT/LAUNCHES & PRODUCT ENHANCEMENTS
10.3.3 EXPANSIONS
10.3.4 PARTNERSHIPS, AGREEMENTS, AND CONTRACTS
11 COMPANY PROFILES (Page No. - 124)
(Business overview, Products offered, Recent developments, SWOT analysis & MnM View)*
11.1 JOHN DEERE
FIGURE 30 JOHN DEERE: COMPANY SNAPSHOT
FIGURE 31 JOHN DEERE: SWOT ANALYSIS
11.2 TRIMBLE
FIGURE 32 TRIMBLE: COMPANY SNAPSHOT
FIGURE 33 TRIMBLE: SWOT ANALYSIS
11.3 TOPCON
FIGURE 34 TOPCON: COMPANY SNAPSHOT
FIGURE 35 TOPCON: SWOT ANALYSIS
11.4 DEVERON UAS
FIGURE 36 DEVERON UAS: SWOT ANALYSIS
11.5 TEEJET TECHNOLOGIES
FIGURE 37 TEEJET TECHNOLOGIES: SWOT ANALYSIS
11.6 ABACO GROUP
11.7 GROUPE ICV
11.8 TRACMAP
11.9 QUANTISLABS
11.10 TERRANIS
11.11 ATEKNEA SOLUTIONS
11.12 AHA VITICULTURE
11.13 AG LEADER TECHNOLOGY
*Details on Business overview, Products offered, Recent developments, SWOT analysis & MnM View might not be captured in case of unlisted companies.
12 APPENDIX (Page No. - 163)
12.1 DISCUSSION GUIDE
12.2 KNOWLEDGE STORE: MARKETSANDMARKETS� SUBSCRIPTION PORTAL
12.3 INTRODUCING RT: REAL-TIME MARKET INTELLIGENCE
12.4 AVAILABLE CUSTOMIZATIONS
12.5 RELATED REPORTS
12.6 AUTHOR DETAILS


Growth opportunities and latent adjacency in Precision Viticulture Market