Protective Gloves Market by Material (Latex, Nitrile, Neoprene, Leather), Type (Re-Usable, Disposable), Application (Chemical, Mechanical, Biological), End-Use Industry (Healthcare, Manufacturing, Food & Beverage, Oil & Gas) - Global Forecast to 2022


The protective gloves market is projected to reach USD 11.26 Billion by 2022, at a CAGR of 6.4%. In this report, 2016 is considered as the base year and the forecast period is from 2017 to 2022. Asia Pacific is the fastest-growing market for protective glove due to the high production and usage of protective gloves in the healthcare, manufacturing, food & beverage, oil & gas, construction, and transportation industries. Stringent health & safety standards in these end-use industries drive the growth of the protective gloves market.
Objectives of the Protective Gloves Market Study
- To define, describe, and analyze the global protective gloves market on the basis of material, type, application, end-use industry, and region
- To forecast and analyze the market size (in terms of value) and submarkets in five regions, namely, Asia Pacific, Europe, North America, South America, and the Middle East & Africa
- To forecast and analyze the market at the country-level for each region
- To strategically analyze each submarket with respect to individual growth trends and its contribution to the global protective glove market
- To analyze opportunities in the market for stakeholders by identifying high growth segments of the global protective gloves market
- To identify significant trends and factors driving or inhibiting the growth of the market and submarkets
- To analyze competitive developments, such as expansions, new product developments, agreements, and collaborations in the global protective gloves market
- To strategically profile key market players and comprehensively analyze their growth strategies
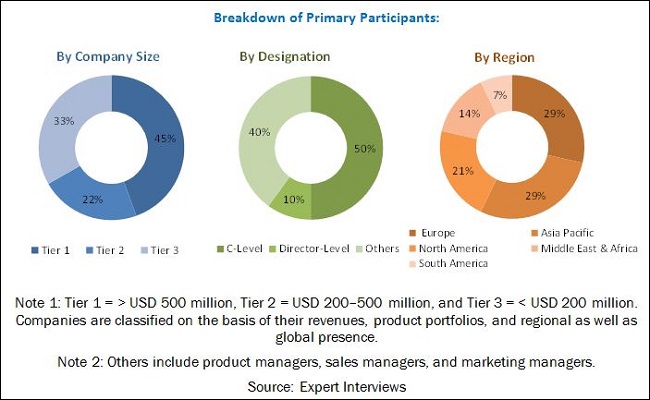
This technical, market-oriented, and commercial research study of the global protective gloves market involves the extensive use of secondary sources, directories, and databases (such as Hoovers, Bloomberg BusinessWeek, and Factiva) to identify and collect information. The primary sources mainly include several industry experts from core and related industries and preferred suppliers, manufacturers, distributors, service providers, and organizations related to all segments of the industry’s supply chain. After arriving at the overall market size, the total market has been split into several segments. The figure below illustrates the breakdown of the primary interviews based on company type, designation, and region conducted during the research study:
To know about the assumptions considered for the study, download the pdf brochure
Key Players in Protective Gloves Market Industry
Key manufacturers of protective gloves include Ansell Limited (US), Top Glove Corporation Bhd (Malaysia), Honeywell International Inc. (US), Supermax Corporation Berhad (Malaysia), 3M Company (US), Hartalega Holdings Berhad (Malaysia), W.W. Grainger, Inc. (US), Kimberly-Clark Corporation (US), and Protective Industrial Products, Inc. (US).
Target Audiences for the Protective Gloves Market Report
- Protective Gloves Manufacturers
- Protective Glove Suppliers
- Raw Material Suppliers
- Investment Banks
- Government Bodies
Protective Gloves Market Report Scope
This report categorizes the global protective gloves market on the basis of material, type, application, end-use industry, and region.
Protective Gloves Market, by Material:
- Latex
- Nitrile
- Neoprene
- Leather
- Vinyl
- Others
Protective Glove Market, by Type:
- Re-usable
- Disposable
Protective Gloves Market, by Application:
- Chemical
- Mechanical
- Biological
- Thermal
- Others
Protective Gloves Market, by End-use Industry:
- Healthcare
- Manufacturing
- Food & Beverage
- Oil & Gas
- Construction
- Transportation
- Others
Protective Gloves Market, By Region:
- Asia Pacific
- Europe
- North America
- Middle East & Africa
- South America
Protective Gloves Market Report Available Customizations
With the given market data, MarketsandMarkets offers customizations according to the company’s specific needs. The following customization options are available for the report:
Protective Gloves Market Regional Analysis
- Further breakdown of a region with respect to a particular country, application, material, type, end-use industry
Protective Gloves Market Country Information
- Additional country information (up to three)
Protective Gloves Market Company Information
- Detailed analysis and profiles of additional market players (up to five)
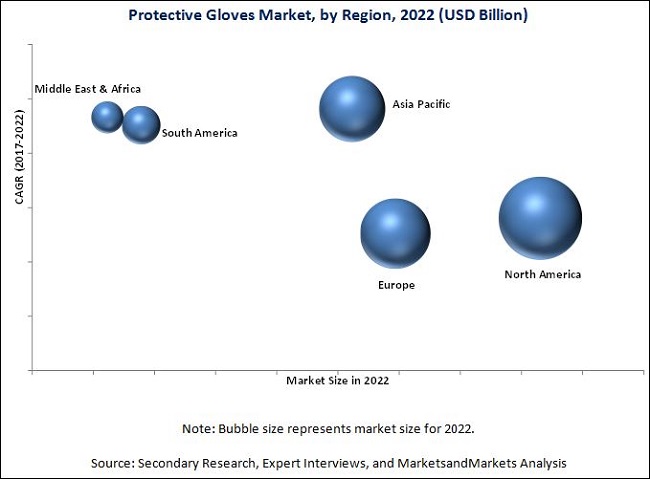
The global protective gloves market is estimated to be USD 8.69 Billion in 2017 and is projected to reach USD 11.26 Billion by 2022, at a CAGR of 6.4% during the forecast period. The increasing demand for disposable healthcare gloves and strict regulations pertaining to safety and protection drive the growth of the global protective glove market.
On the basis of material, the global protective gloves market has been segmented into latex, nitrile, neoprene, leather, vinyl, and others. The latex segment is expected to lead the market during the forecast period, followed by the nitrile segment. The latex segment is also projected to grow at the highest CAGR between 2017 and 2022, owing to the increasing usage of latex gloves in healthcare, food & beverage, oil & gas, and other industries.
Based on type, the global protective glove market has been segmented into re-usable and disposable. The disposable segment is projected to grow at a higher CAGR as disposable gloves are considered to be more comfortable, softer, and cheaper than re-usable protective gloves.
Based on application, the global protective gloves market has been segmented into chemical, mechanical, biological, thermal, and others. The chemical segment is the largest application segment of the market. The chemical protective glove provide protection against alkali, organic & inorganic acids, hydrocarbons, and other harmful chemicals.
Based on end-use industry, the global protective gloves market has been segmented into healthcare, food & beverage, manufacturing, oil & gas, construction, transportation, and others. The healthcare industry has a huge demand for disposable gloves. The rising medical standards are also expected to further drive the demand for protective glove in the healthcare industry during the forecast period.
On the basis of region, the global protective gloves market has been classified into Asia Pacific, Europe, North America, Middle East & Africa, and South America. The North Americas region is the largest market for protective glove. The North America protective gloves market is largely driven by the increased awareness about safety as well as regulations that mandate the use of protective glove in various industries.
Key Players in Protective Gloves Market Industry
Major factors restraining the growth of the global protective gloves market include the high concern for skin allergies and increasing automation, which reduces manpower, in several industries. Some of the key players operating in the global protective glove market are Ansell Limited (US), Top Glove Corporation Berhad (Malaysia), Honeywell International Inc. (US), Supermax Corporation Berhad (Malaysia), 3M Company (US), Hartalega Holdings Berhad (Malaysia), W.W. Grainger, Inc. (US), Kimberly-Clark Corporation (US), and Protective Industrial Products, Inc. (US), among others.
To speak to our analyst for a discussion on the above findings, click Speak to Analyst
 Exclusive indicates content/data unique to MarketsandMarkets and not available with any competitors.
Table of Contents
1 Introduction (Page No. - 15)
1.1 Objectives of the Study
1.2 Market Definition
1.3 Market Scope
1.3.1 Years Considered for the Study
1.4 Currency
1.5 Limitations
1.6 Stakeholders
2 Research Methodology (Page No. - 19)
2.1 Research Data
2.1.1 Secondary Data
2.1.1.1 Key Data From Secondary Sources
2.1.2 Primary Data
2.1.2.1 Key Data From Primary Sources
2.1.2.2 Key Industry Insights
2.1.2.3 Breakdown of Primary Interviews
2.2 Market Size Estimation
2.2.1 Bottom-Up Approach
2.2.2 Top-Down Approach
2.3 Data Triangulation
2.4 Research Assumptions
3 Executive Summary (Page No. - 27)
4 Premium Insights (Page No. - 31)
4.1 Significant Opportunities in Protective Gloves Market, 2017–2022
4.2 Protective Glove Market, By Region
4.3 Protective Gloves Market in North America, By Country and Material
4.4 Protective Glove Market Size, By End-Use Industry and Region
5 Market Overview (Page No. - 33)
5.1 Introduction
5.2 Market Dynamics
5.2.1 Drivers
5.2.1.1 Stringent Government Regulations
5.2.1.2 Increasing Demand for Disposable Protective Gloves in Healthcare Industry
5.2.1.3 Growing Awareness of Industrial Safety and Hygiene
5.2.2 Restraints
5.2.2.1 High Concern About Skin Allergies
5.2.2.2 Increased Automation in End-Use Industries
5.2.3 Opportunities
5.2.3.1 High Growth Opportunities for Disposable Gloves in Emerging Markets
5.2.3.2 Increasing Manufacturing Industries in Asia Pacific
5.2.4 Challenges
5.2.4.1 Multi-Functional Protective Gloves at Low Cost
5.3 Porter’s Five Forces Analysis
5.3.1 Threat of New Entrants
5.3.2 Threat of Substitutes
5.3.3 Bargaining Power of Suppliers
5.3.4 Bargaining Power of Buyers
5.3.5 Intensity of Competitive Rivalry
5.4 Industry Outlook
5.4.1 Manufacturing Industry
5.4.2 Transportation Industry
5.4.3 Construction Industry
5.4.3.1 Trends and Forecast of Construction Industry in North America
5.4.3.2 Trends and Forecast of Construction Industry in Europe
5.4.3.3 Trends and Forecast of Construction Industry in Asia Pacific
5.4.3.4 Trends and Forecast of Construction Industry in Middle East & Africa
5.4.3.5 Trends and Forecast of Construction Industry in South America
6 Protective Gloves Market, By Material (Page No. - 50)
6.1 Introduction
6.2 Latex
6.3 Nitrile
6.4 Neoprene
6.5 Leather
6.6 Vinyl
6.7 Others
6.7.1 Butyl
6.7.2 Polyethylene
6.7.3 Aluminized
6.7.4 Cryogenic
7 Protective Gloves Market, By Type (Page No. - 59)
7.1 Introduction
7.2 Reusable
7.3 Disposable
8 Protective Gloves Market, By Application (Page No. - 63)
8.1 Introduction
8.2 Chemical
8.3 Mechanical
8.4 Biological
8.5 Thermal
8.6 Others
8.6.1 Visibility
8.6.2 Anti-Static
9 Protective Gloves Market, By End-Use Industry (Page No. - 72)
9.1 Introduction
9.1.1 Revenue Pocket Matrix, By End-Use Industry
9.2 Healthcare
9.3 Manufacturing
9.4 Food & Beverage
9.5 Transportation
9.6 Construction
9.7 Oil & Gas
9.8 Others
9.8.1 Sports
9.8.2 Firefighting
9.8.3 Military
9.8.4 Mining
10 Protective Glove Market, By Region (Page No. - 83)
10.1 Introduction
10.2 North America
10.2.1 U.S.
10.2.2 Canada
10.2.3 Mexico
10.3 Europe
10.3.1 Germany
10.3.2 U.K.
10.3.3 France
10.3.4 Italy
10.3.5 Spain
10.3.6 Poland
10.3.7 Rest of Europe
10.4 Asia Pacific
10.4.1 China
10.4.2 Japan
10.4.3 India
10.4.4 South Korea
10.4.5 Australia & New Zealand
10.4.6 Indonesia
10.4.7 Thailand
10.4.8 Malaysia
10.4.9 Rest of Asia Pacific
10.5 South America
10.5.1 Brazil
10.5.2 Colombia
10.5.3 Argentina
10.5.4 Venezuela
10.5.5 Rest of South America
10.6 Middle East & Africa
10.6.1 Saudi Arabia
10.6.2 Iran
10.6.3 Iraq
10.6.4 South Africa
10.6.5 UAE
10.6.6 Rest of Middle East & Africa
11 Competitive Landscape (Page No. - 119)
11.1 Introduction
11.1.1 Dynamic Differentiators
11.1.2 Innovators
11.1.3 Visionary Leaders
11.1.4 Emerging Companies
11.2 Competitive Benchmarking
11.2.1 Strength of Product Portfolio (25 Companies)
11.2.2 Business Strategy Excellence (25 Companies)
11.3 Market Share Analysis
11.3.1 Ansell Limited (U.S.)
11.3.2 Top Glove Corporation BHD (Malaysia)
11.3.3 Honeywell International Inc.(U.S.)
12 Company Profiles (Page No. - 124)
(Business Overview, Products Offered, Scorecard of Product Offering, Scorecard of Business Strategy, and New Product Launch)
12.1 Ansell Limited
12.2 Top Glove Corporation BHD
12.3 Honeywell International Inc.
12.4 Hartalega Holdings Berhad
12.5 Kossan Rubber Industries BHD
12.6 W.W. Grainger, Inc.
12.7 Supermax Corporation Berhad
12.8 3M Company
12.9 Kimberly-Clark Corporation
12.10 Protective Industrial Products, Inc.
12.11 Other Key Market Players
12.11.1 Delta Plus Group S.A. (France)
12.11.2 Ergodyne (A Division of Tenacious Holdings, Inc.) (U.S.)
12.11.3 MCR Safety Inc. (U.S.)
12.11.4 Boss Gloves (U.S.)
12.11.5 Saf-T-Gard International, Inc. (U.S.)
12.11.6 Radians, Inc. (U.S.)
12.11.7 Lakeland Industries, Inc. (U.S.)
12.11.8 Globus (Shetland) Ltd. (U.K.)
12.11.9 PAN Taiwan Enterprise Co., Ltd. (Taiwan)
12.11.10 Dynamic Safety Europe B.V. (Netherlands)
12.11.11 Lindstrom Group (Finland)
12.11.12 Comfort Rubber Gloves Industries Sdn. BHD. (Malaysia)
12.11.13 Cordova Safety Products (U.S.)
12.11.14 Superior Glove Works Ltd. (U.S.)
12.11.15 Midas Safety Inc. (Canada)
*Details Might Not Be Captured in Case of Unlisted Companies.
13 Appendix (Page No. - 151)
13.1 Insights From Industry Experts
13.2 Discussion Guide
13.3 Knowledge Store: Marketsandmarkets’ Subscription Portal
13.4 Introducing RT: Real Time Market Intelligence
13.5 Available Customizations
13.6 Related Reports
13.7 Author Details
List of Tables (73 Tables)
Table 1 Direct and Hidden Costs of Workplace Accidents
Table 2 Vehicles in Use, By Country, 2011–2015 (Thousand Unit)
Table 3 Contribution of Construction Industry to GDP of North America, 2014–2021 (USD Billion)
Table 4 Contribution of Construction Industry to GDP of Europe, 2014–2021 (USD Billion)
Table 5 Contribution of Construction Industry to GDP of Asia Pacific, 2014–2021 (USD Billion)
Table 6 Contribution of Construction Industry to GDP of Middle East & Africa, 2014–2021 (USD Billion)
Table 7 Contribution of Construction Industry to GDP of South America, 2014–2021 (USD Billion)
Table 8 Protective Gloves Market Size, By Material, 2015–2022 (USD Million)
Table 9 Latex-Based Protective Glove Market Size, By Region, 2015–2022 (USD Million)
Table 10 Nitrile-Based Protective Gloves Market Size, By Region, 2015–2022 (USD Million)
Table 11 Neoprene-Based Protective Glove Market Size, By Region, 2015–2022 (USD Million)
Table 12 Leather-Based Protective Gloves Market Size, By Region, 2015–2022 (USD Million)
Table 13 Vinyl-Based Protective Glove Market Size, By Region, 2015–2022 (USD Million)
Table 14 Other Materials-Based Protective Gloves Market Size, By Region, 2015–2022 (USD Million)
Table 15 Protective Gloves Market Size, By Type, 2015–2022 (USD Million)
Table 16 Reusable Protective Glove Market Size, By Region, 2015–2022 (USD Million)
Table 17 Disposable Protective Gloves Market Size, By Region, 2015–2022 (USD Million)
Table 18 Protective Glove Market Size, By Application, 2015–2022 (USD Million)
Table 19 Types of Materials Used in Protective Gloves for Chemical Application
Table 20 Protective Gloves Market Size in Chemical Application, By Region, 2015–2022 (USD Million)
Table 21 Protective Glove Market Size in Mechanical Application, By Region, 2015–2022 (USD Million)
Table 22 Protective Gloves Market Size in Biological Application, By Region, 2015–2022 (USD Million)
Table 23 Protective Glove Market Size in Thermal Application, By Region, 2015–2022 (USD Million)
Table 24 Protective Gloves Market Size in Other Applications, By Region, 2015–2022 (USD Million)
Table 25 Protective Glove Market Size, By End-Use Industry, 2015–2022 (USD Million)
Table 26 Protective Gloves Market Size in Healthcare End-Use Industry, By Region, 2015–2022 (USD Million)
Table 27 Protective Glove Market Size in Manufacturing End-Use Industry, By Region, 2015–2022 (USD Million)
Table 28 Protective Gloves Market Size in Food & Beverage Industry, By Region, 2015–2022 (USD Million)
Table 29 Protective Glove Market Size in Transportation End-Use Industry, By Region, 2015–2022 (USD Million)
Table 30 Protective Gloves Market Size in Construction End-Use Industry, By Region, 2015–2022 (USD Million)
Table 31 Protective Glove Market Size in Oil & Gas End-Use Industry, By Region, 2015–2022 (USD Million)
Table 32 Protective Gloves Market Size in Other End-Use Industries, By Region, 2015–2022 (USD Million)
Table 33 Protective Glove Market Size, By Region, 2015–2022 (USD Million)
Table 34 North America: Protective Gloves Market Size, By Country, 2015–2022 (USD Million)
Table 35 North America: Market Size, By Material, 2015–2022 (USD Million)
Table 36 North America: Market Size, By Type, 2015–2022 (USD Million)
Table 37 North America: Market Size, By Application, 2015–2022 (USD Million)
Table 38 North America: Market Size, By End-Use Industry, 2015–2022 (USD Million)
Table 39 U.S.: Protective Gloves Market Size, By End-Use Industry, 2015–2022 (USD Million)
Table 40 Canada: Protective Glove Market Size, By End-Use Industry, 2015–2022 (USD Million)
Table 41 Mexico: Protective Gloves Market Size, By End-Use Industry, 2015–2022 (USD Million)
Table 42 Europe: Protective Gloves Market Size, By Country, 2015–2022 (USD Million)
Table 43 Europe: Market Size, By Material, 2015–2022 (USD Million)
Table 44 Europe: Market Size, By Type, 2015–2022 (USD Million)
Table 45 Europe: Market Size, By Application, 2015–2022 (USD Million)
Table 46 Europe: Market Size, By End-Use Industry, 2015–2022 (USD Million)
Table 47 Germany: Protective Glove Market Size, By End-Use Industry, 2015–2022 (USD Million)
Table 48 U.K.: Protective Gloves Market Size, By End-Use Industry, 2015–2022 (USD Million)
Table 49 France: Protective Glove Market Size, By End-Use Industry, 2015–2022 (USD Million)
Table 50 Asia Pacific: Protective Gloves Market Size, By Country, 2015–2022 (USD Million)
Table 51 Asia Pacific: Market Size, By Material, 2015–2022 (USD Million)
Table 52 Asia Pacific: Market Size, By Type, 2015–2022 (USD Million)
Table 53 Asia Pacific: Market Size, By Application, 2015–2022 (USD Million)
Table 54 Asia Pacific: Market Size, By End-Use Industry, 2015–2022 (USD Million)
Table 55 China: Protective Glove Market Size, By End-Use Industry, 2015–2022 (USD Million)
Table 56 Japan: Protective Gloves Market Size, By End-Use Industry, 2015–2022 (USD Million)
Table 57 India: Protective Glove Market Size, By End-Use Industry, 2015–2022 (USD Million)
Table 58 South America: Protective Gloves Market Size, By Country, 2015–2022 (USD Million)
Table 59 South America: Market Size, By Material, 2015–2022 (USD Million)
Table 60 South America: Market Size, By Type, 2015–2022 (USD Million)
Table 61 South America: Market Size, By Application, 2015–2022 (USD Million)
Table 62 South America: Market Size, By End-Use Industry, 2015–2022 (USD Million)
Table 63 Brazil: Protective Gloves Market Size, By End-Use Industry, 2015–2022 (USD Million)
Table 64 Colombia: Protective Glove Market Size, By End-Use Industry, 2015–2022 (USD Million)
Table 65 Argentina: Protective Gloves Market Size, By End-Use Industry, 2015–2022 (USD Million)
Table 66 Middle East & Africa: Protective Glove Market Size, By Country, 2015–2022 (USD Million)
Table 67 Middle East & Africa: Market Size, By Material, 2015–2022 (USD Million)
Table 68 Middle East & Africa: Market Size, By Type, 2015–2022 (USD Million)
Table 69 Middle East & Africa: Market Size, By Application, 2015–2022 (USD Million)
Table 70 Middle East & Africa: Market Size, By End-Use Industry, 2015–2022 (USD Million)
Table 71 Saudi Arabia: Protective Gloves Market Size, By End-Use Industry, 2015–2022 (USD Million)
Table 72 Iran: Protective Glove Market Size, By End-Use Industry, 2015–2022 (USD Million)
Table 73 Iraq: Protective Gloves Market Size, By End-Use Industry, 2015–2022 (USD Million)
List of Figures (78 Figures)
Figure 1 Protective Gloves: Market Segmentation
Figure 2 Protective Glove Market: Research Design
Figure 3 Market Size Estimation: Bottom-Up Approach
Figure 4 Market Size Estimation: Top-Down Approach
Figure 5 Protective Gloves Market: Data Triangulation
Figure 6 Latex Material to Lead the Protective Glove Market Between 2017 and 2022
Figure 7 Disposable Protective Gloves is Projected to Register the Highest CAGR Between 2017 and 2022
Figure 8 Chemical Application to Lead the Protective Glove Market Between 2017 and 2022
Figure 9 Healthcare End-Use Industry to Lead the Protective Gloves Market Between 2017 and 2022
Figure 10 Asia Pacific is Projected to Register the Highest CAGR Between 2017 and 2022
Figure 11 Protective Gloves Market to Witness High Growth Between 2017 and 2022
Figure 12 North America to Be the Key Protective Gloves Market Between 2017 and 2022
Figure 13 U.S. Dominated the North America Market in 2016
Figure 14 Healthcare End-Use Industry Accounted for the Largest Market Share
Figure 15 Overview of Factors Governing Protective Glove Market
Figure 16 Porter’s Five Forces Analysis
Figure 17 Manufacturing Industry Growth Rate, 2015
Figure 18 Asia Pacific Produced the Highest Number of Vehicles in 2015
Figure 19 U.S. Dominates Construction Industry of North America, 2016 vs 2021
Figure 20 U.K. to Lead Construction Industry in Europe, 2016 vs 2021
Figure 21 China Dominates Construction Industry in Asia Pacific, 2016 vs 2021
Figure 22 Saudi Arabia has the Largest Construction Industry in Middle East & Africa, 2016 vs 2021
Figure 23 Brazil Dominates Construction Industry in South America, 2016 vs 2021.
Figure 24 Latex-Based Protective Gloves to Lead the Market Between 2017 and 2022
Figure 25 North America to Be the Largest Latex-Based Protective Glove Market Between 2017 and 2022
Figure 26 Asia Pacific to Be the Fastest-Growing Nitrile-Based Protective Gloves Market Between 2017 and 2022
Figure 27 Europe to Be the Second-Largest Neoprene-Based Protective Glove Market Between 2017 and 2022
Figure 28 North America to Be the Largest Leather-Based Protective Gloves Market Between 2017 and 2022
Figure 29 Middle East & Africa to Be the Fastest-Growing Vinyl-Based Protective Glove Market Between 2017 and 2022
Figure 30 North America to Be the Largest Other Materials-Based Protective Gloves Market Between 2017 and 2022
Figure 31 Reusable Protective Gloves to Lead the Market Between 2017 and 2022
Figure 32 North America to Be the Largest Reusable Protective Glove Market Between 2017 and 2022
Figure 33 Asia Pacific to Be the Fastest-Growing Disposable Protective Gloves Market Between 2017 and 2022
Figure 34 Chemical Application to Lead the Protective Glove Market Between 2017 and 2022
Figure 35 North America to Lead the Protective Gloves Market in Chemical Application During the Forecast Period
Figure 36 Asia Pacific to Be the Fastest-Growing Protective Glove Market in Mechanical Application Between 2017 and 2022
Figure 37 High Growth in Healthcare Industry to Drive the North America Protective Gloves Market in Biological Application Between 2017 and 2022
Figure 38 Europe is Expected to Be the Second-Largest Protective Glove Market in Thermal Application During the Forecast Period
Figure 39 North America to Lead the Protective Gloves Market in Other Applications Between 2017 and 2022
Figure 40 Healthcare Industry to Lead the Protective Glove Market During the Forecast Period
Figure 41 Healthcare is the Largest End-Use Industry
Figure 42 North America to Be the Largest Protective Gloves Market in Healthcare End-Use Industry During the Forecast Period
Figure 43 Asia Pacific is Expected to Be the Fastest-Growing Protective Glove Market in Manufacturing Industry During the Forecast Period
Figure 44 Europe is Expected to Be the Second-Largest Protective Gloves Market in Food & Beverage End-Use Industry During the Forecast Period
Figure 45 North America to Be Largest Protective Glove Market in Transportation End-Use Industry During the Forecast Period
Figure 46 Middle East & Africa to Be the Fastest-Growing Protective Gloves Market in Construction Industry During the Forecast Period
Figure 47 North America is Expected to Lead the Protective Glove Market in Oil & Gas End-Use Industry During the Forecast Period
Figure 48 North America to Lead the Protective Gloves Market in Other End-Use Industries During the Forecast Period
Figure 49 Regional Snapshot: India to Register Highest CAGR During the Forecast Period
Figure 50 North America Snapshot: U.S. Dominated Protective Glove Market, 2016
Figure 51 Europe Snapshot: Germany to Lead Protective Gloves Market
Figure 52 Protective Gloves Market Size in Italy, 2015–2022
Figure 53 Protective Glove Market Size in Spain, 2015–2022
Figure 54 Market Size in Poland, 2015–2022
Figure 55 Market Size in Rest of Europe, 2015–2022
Figure 56 Asia Pacific Market Snapshot: China to Dominate Protective Gloves Market
Figure 57 Protective Gloves Market Size in South Korea, 2015–2022
Figure 58 Protective Glove Market Size in Australia & New Zealand, 2015–2022
Figure 59 Market Size in Indonesia, 2015–2022
Figure 60 Market Size in Thailand, 2015–2022
Figure 61 Market Size in Malaysia, 2015–2022
Figure 62 Market Size in Rest of Asia Pacific, 2015–2022
Figure 63 Protective Gloves Market Size in Venezuela, 2015–2022
Figure 64 Protective Glove Market Size in Rest of South America, 2015–2022
Figure 65 Market Size in South Africa, 2015–2022
Figure 66 Market Size in UAE, 2015–2022
Figure 67 Market Size in Rest of Middle East & Africa, 2015–2022
Figure 68 Competitive Leadership Mapping, 2016
Figure 69 Market Share Analysis of Protective Gloves, 2016
Figure 70 Ansell Limited: Company Snapshot
Figure 71 Top Glove Corporation BHD: Company Snapshot
Figure 72 Honeywell International Inc.: Company Snapshot
Figure 73 Hartalega Holdings Berhad: Company Snapshot
Figure 74 Kossan Rubber Industries BHD: Company Snapshot
Figure 75 W.W. Grainger, Inc.: Company Snapshot
Figure 76 Supermax Corporation Berhad: Company Snapshot
Figure 77 3M Company: Company Snapshot
Figure 78 Kimberly-Clark Corporation: Company Snapshot


Growth opportunities and latent adjacency in Protective Gloves Market