
Protein A Resin Market Size, Growth, Share & Trends Analysis

Protein A Resin Market by Product (Bulk Resin, Lab-scale Columns), Source (Recombinant Protein A), Matrix Type (Agarose-Based Protein A), Application (Monoclonal Antibody Purification, FC-Fusion Protein Purification) & End User - Global Forecast to 2030


OVERVIEW
Source: Secondary Research, Interviews with Experts, MarketsandMarkets Analysis
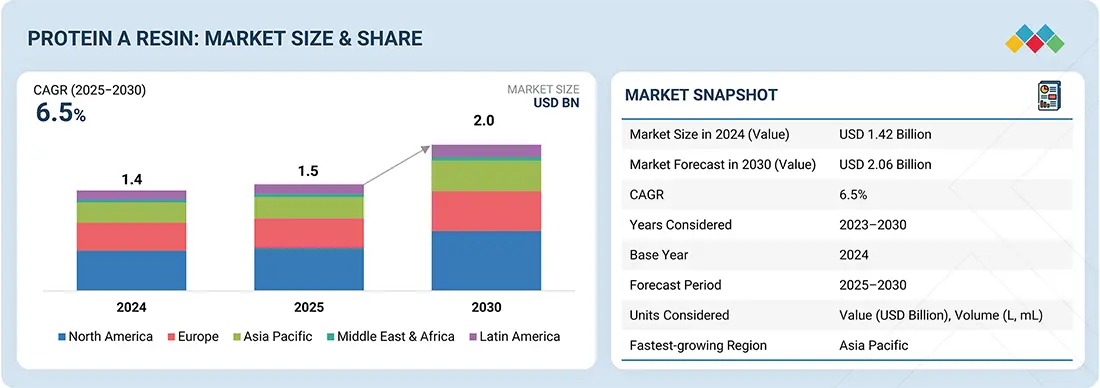
The global Protein A resin market is projected to expand strongly, driven by the sustained growth of monoclonal antibodies, Fc-fusion proteins, and biosimilars manufacturing capacities. Its global market size is anticipated to grow from just over USD 1.5 billion in 2025 to more than USD 2.06 billion by 2030, reflecting a CAGR of 6.5%. A significant share of this growth is expected to come from outsourced biomanufacturing capacity additions by CDMOs/CMOs, which increasingly rely on robust, pre-validated chromatography platforms. Recombinant alkaline-tolerant Protein A resins dominate, owing to their superior binding capacity, stability, and lifecycle economics compared with natural ligands. The market is also being reshaped by heightened focus on supply-chain security, pre-packed columns for faster clinical scale-up, and resin performance that supports continuous chromatography and process intensification.
KEY TAKEAWAYS
- The North America Protein A Resin market accounted for a 40.0% revenue share in 2024
- By product, the bulk resin is expected to register the highest CAGR of 7.1%
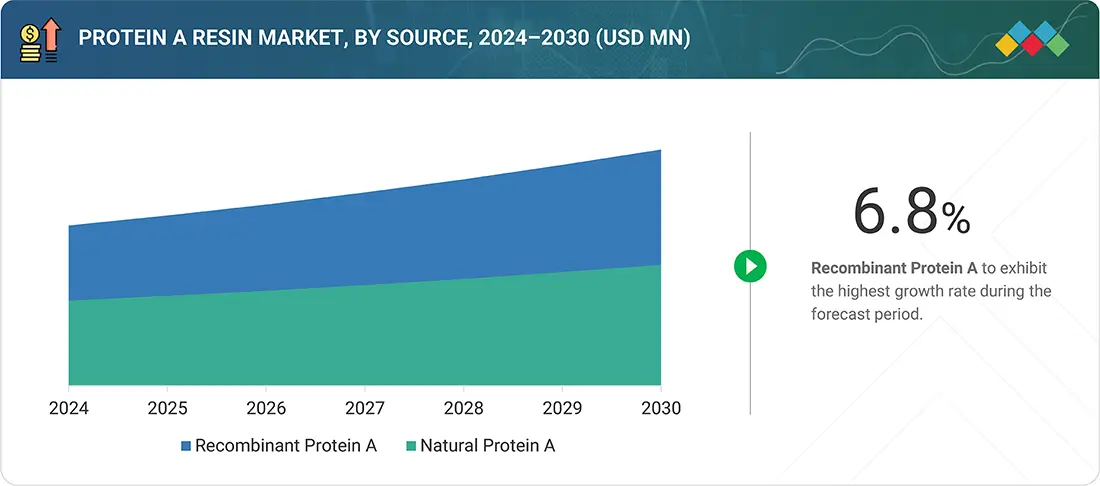
- By source,the recombinant protein A resins segment is expected to register the highest CAGR of 6.8%
- By matrix type, the agarose-based protein A resins segment accounted for a 63.6% share of the protein A resin market in 2024.
- By end user, the pharmaceutical and biopharmaceutical companies segment held a 52.6% share of the protein A resin market in 2024.
- By Application, the mAb purification segment is expected to register the highest CAGR of 6.8%.
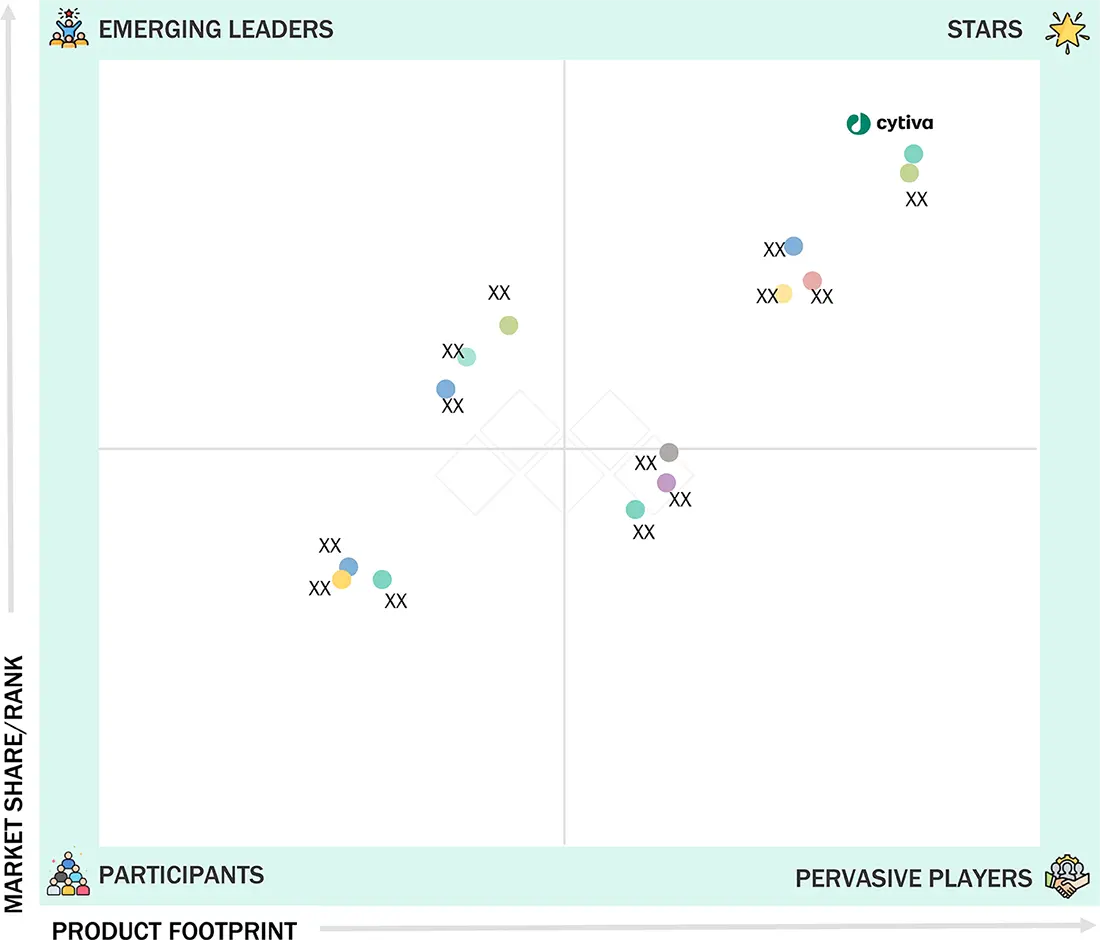
- Companies Danaher (US), Merck KGaA (Germany), and Ecolab (US) were identified as some of the star players in the protein A resin market (global), given their strong market share and product footprint
- Companies Suzhou Nanomicro Technology Co., Ltd. (China), Sunresin New Material Co., Ltd. (China), and Geno Technology, Inc. (US), among others, have distinguished themselves among startups and SMEs by securing strong footholds in specialized niche areas, underscoring their potential as emerging market leaders.
The Protein A resin market is transitioning from a volume-driven consumables market to a value-driven, lifecycle-economics market. Purchasers are prioritizing dynamic binding capacity at short residence times, resin stability under NaOH cleaning, and validated resin lifetimes that extend beyond 200 cycles. Moreover, the adoption of pre-packed columns is accelerating among CDMOs and multi-product facilities to reduce repacking failures and validation time. Continuous processing technologies such as periodic counter-current chromatography (PCC) are slowly gaining traction, pushing resin suppliers to qualify products for new operating conditions. Therefore, pharmaceutical and biopharmaceutical companies with strong capital expenditure patterns are shifting toward single-use technologies (SUT), favouring pre-packed columns and membrane resins to reduce cleaning and turnaround times. Regional growth hotspots in Asia Pacific, especially India, South Korea, and China, are shaping procurement towards cost-optimized resins, while North America and Europe emphasize resin lifetime, regulatory dossiers, and dual-sourcing. Overall, the market is consolidating around suppliers that can deliver alkaline-stable, high-capacity chemistries at scale with reliable, multi-site supply.
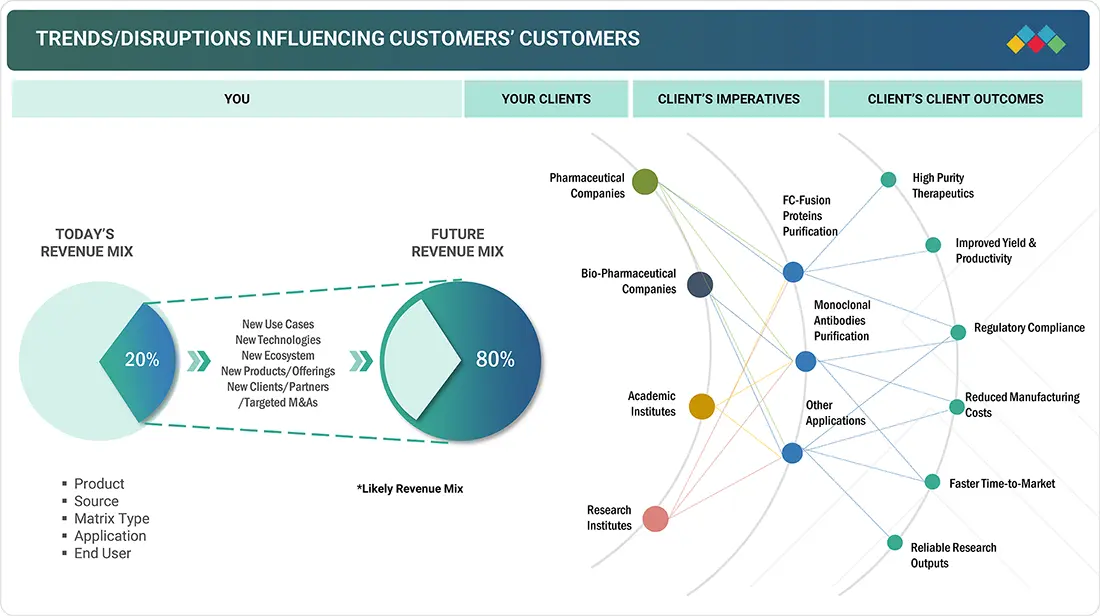
TRENDS & DISRUPTIONS IMPACTING CUSTOMERS' CUSTOMERS
The Protein A resin market is being reshaped by several disruptive forces that directly impact the strategies of pharmaceutical innovators, biosimilar developers, and CDMOs. The expansion of global biologics pipelines, especially monoclonal antibodies, bispecifics, and Fc-fusion proteins, is creating sustained demand for scalable, high-performance affinity resins. Customers face increasing pressure to accelerate clinical timelines while maintaining product purity, making resin quality, alkali stability, and binding capacity central to their business outcomes. The growing reliance on outsourced biomanufacturing (CDMOs/CMOs) is redefining procurement priorities. These organizations require validated, pre-packed Protein A columns that can be rapidly deployed across multi-product facilities, reducing downtime from column packing failures and ensuring consistent performance. This shift is disrupting the traditional bulk resin supply model and rewards vendors who can deliver both resin and pre-packed formats with strong documentation packages. The push toward process intensification and continuous chromatography is altering downstream workflows. Technologies such as periodic counter-current chromatography (PCC) and multi-column capture are designed to maximize resin utilization, allowing fewer Liters of Protein A to deliver higher output. This reduces customer cost per gram but simultaneously challenges resin suppliers to provide products validated under new operating conditions, including short residence times and high linear velocities.
Source: Secondary Research, Interviews with Experts, MarketsandMarkets Analysis
MARKET DYNAMICS
Level
-
Growing pipeline of Monoclonal Antibody (mAbs)

Level
-
High cost of resins

Level
-
Growth in bispecific antibodies and antibody-drug conjugates

Level
-
Quality consistency challenges in scaling manufacturing

Source: Secondary Research, Interviews with Experts, MarketsandMarkets Analysis
Driver: Growing pipeline of Monoclonal Antibody (mAbs)
Protein A resins are indispensable in capturing IgG monoclonal antibodies and remain the benchmark technology for Fc-containing molecule purification. The steady rise in USFDA & EMA approvals of new monoclonal antibodies and the surge in biosimilar launches directly translate to greater resin demand, especially for commercial scale. For instance, the data for the US FDA 2024 indicates that nearly 13 monoclonal antibodies received approval in 2024, the highest number to date, and a new record. As patents for major monoclonal antibodies (mAb) like Humira, Avastin, and Herceptin are nearing expiration, the production of biosimilars will likely increase, boosting the demand for protein A resin. Therefore, expanding the pipeline of bispecific and fusion proteins also relies heavily on Protein A for initial capture, amplifying consumption volumes. Together, these trends ensure sustained resin usage across innovator and biosimilar production platforms.
Restraint: High cost of resins
Despite their advantages, Protein A resins are significantly more expensive than alternative chromatography media. The cost per litre of Protein A resin is substantially higher than that of ion-exchange or mixed-mode resins, limiting its adoption in highly cost-sensitive settings and emerging markets. Smaller players and biosimilar developers often negotiate aggressively for long-term supply contracts or seek cost-optimized alkaline-tolerant variants. Price pressures may also encourage exploration of alternative ligands or membrane-based affinity solutions, although Protein A continues to dominate due to its superior selectivity.
Opportunity: Growth in bispecific antibodies and antibody-drug conjugates
The continued development of bispecific antibodies and antibody-drug conjugates (ADCs) opens significant opportunities for Protein A resin suppliers. These modalities still require Protein A in primary capture, but with even tighter quality, extractables/leachables, and ligand leakage specifications. Suppliers that can provide resins with low HCP co-elution, low ligand leaching, and validated virus clearance compatibility will be well-positioned. As new antibody formats move from clinical development to large-scale commercial production, manufacturers are encouraged to expand their purification capacity. This expansion will increase resin usage and create a demand for advanced protein A resins. Therefore, this segment also rewards vendors that offer flexible formats—prepacked columns for clinical development and bulk resin for late-stage/commercial manufacturing.
Challenge: Quality consistency challenges in scaling manufacturing
A major challenge with using protein A resin is ensuring resin quality and performance consistency commercially. Maintaining reproducible binding capacity, pressure-flow properties, and leachables profiles across multiple large-scale manufacturing lots is critical. As biologics production expands into high-volume geographies such as the Asia Pacific, supply reliability, regulatory dossiers, and lot-to-lot consistency are under closer scrutiny. Any deviation in resin quality can directly affect downstream process validation and regulatory approval timelines.
protein A resin market: COMMERCIAL USE CASES ACROSS INDUSTRIES
| COMPANY | USE CASE DESCRIPTION | BENEFITS |
|---|---|---|
 |
MabSelect PrismA resin for high-titer mAb and Fc-fusion protein purification at commercial scale | Reduction in cost-of-goods via higher binding capacity and longer resin lifetime |
|
|
ProSep Ultra Plus resin enabling continuous multi-column chromatography | Increased productivity with less resin and buffer consumption in large-scale manufacturing |
|
|
Praesto Protein A resins co-developed with Repligen for large-scale biologics | Robust alkali stability and scalability, lowering overall purification costs |
|
|
CaptivA HF Protein A resin designed as a cost-effective alternative | High binding capacity at lower price point, optimizing economics for biopharma |
Logos and trademarks shown above are the property of their respective owners. Their use here is for informational and illustrative purposes only.
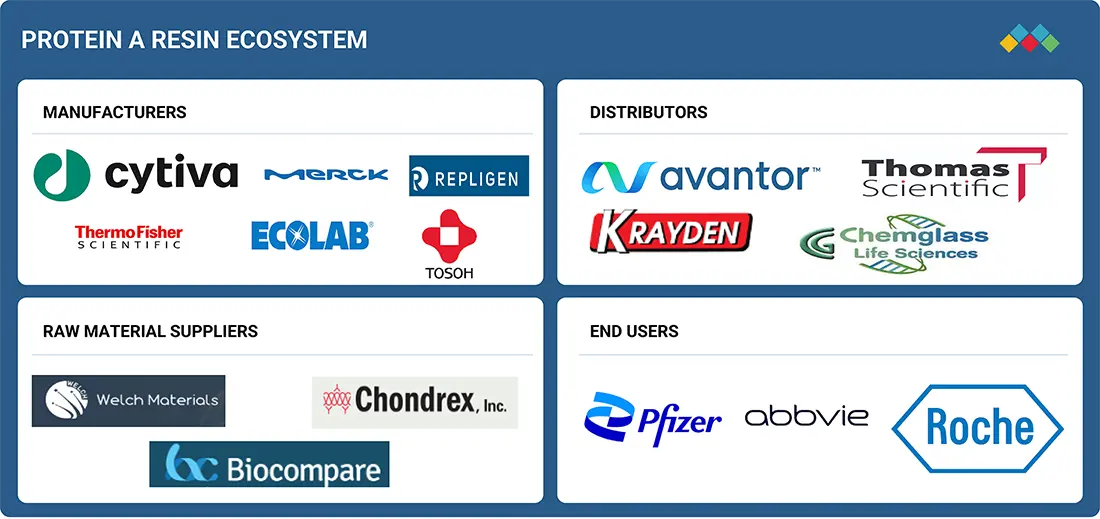
MARKET ECOSYSTEM
The Protein A resin ecosystem spans resin manufacturers (Cytiva/Danaher, Repligen, Thermo Fisher, Merck Millipore, Tosoh Bioscience, Purolite/Ecolab, Astrea, Bio-Works), raw material suppliers, distributors, CDMOs, and end users. Manufacturers differentiate on resin capacity, alkaline tolerance, pre-packed column availability, and regulatory documentation. CDMOs and large biopharma dominate purchasing volume, focusing on validated supply and lifecycle economics. Biosimilar producers are highly price-sensitive, pushing the adoption of cost-optimized alkaline-stable variants. Emerging suppliers from China and India are beginning to challenge incumbents with lower-cost offerings, but global innovators continue to rely on established vendors with proven regulatory track records.
Logos and trademarks shown above are the property of their respective owners. Their use here is for informational and illustrative purposes only.
MARKET SEGMENTS
Source: Secondary Research, Interviews with Experts, MarketsandMarkets Analysis
Protein A Resin market, By Source
Based on the source of extraction, the market is segmented into recombinant and natural. Recombinant alkaline-stable Protein A resins are the undisputed market leaders, replacing natural Protein A resins in most applications. High-capacity agarose resins dominate, with polymeric backbones gaining share for high-flow, short-residence applications. Using systems like E. coli or yeast to produce them allows for scalable manufacturing with uniform quality from batch to batch, which is important for biopharmaceutical applications. However, cost-optimized variants cater to biosimilar production, while niche innovations target PCC/continuous chromatography compatibility and ultra-low ligand leakage.
Protein A Resin Market, By Application
The protein A resin market is segmented by application into monoclonal antibody (mAb) purification, FC-fusion protein purification, and other uses. Monoclonal antibody capture is the primary driver, accounting for the bulk of resin consumption. Fc-fusion proteins and bispecifics are gaining share due to their dependence on Protein A affinity capture. ADCs bring heightened requirements for resin purity, ligand leakage, and regulatory compliance. Clinical-stage programs increasingly rely on pre-packed columns to reduce tech-transfer complexity, while commercial operations prioritize lifecycle cost and validated robustness.
Protein A Resin Market, By Product
Based on product, the protein A resin market is segmented into bulk resin, pre-packed columns, lab-scale columns, and other types. Bulk resins have become the most widely used format in end-use industries, particularly among large biopharmaceutical manufacturers and CDMOs. This popularity is due to their cost-effectiveness, operational flexibility, and scalability. Unlike pre-packed formats, bulk resin is the industry standard for high-volume purification processes performed in stainless-steel column setups. Although it requires in-house packing and validation, bulk resin offers a much lower cost per cycle and per gram of purified monoclonal antibody. For large-scale manufacturers, this cost advantage outweighs the added operational complexities.
REGION
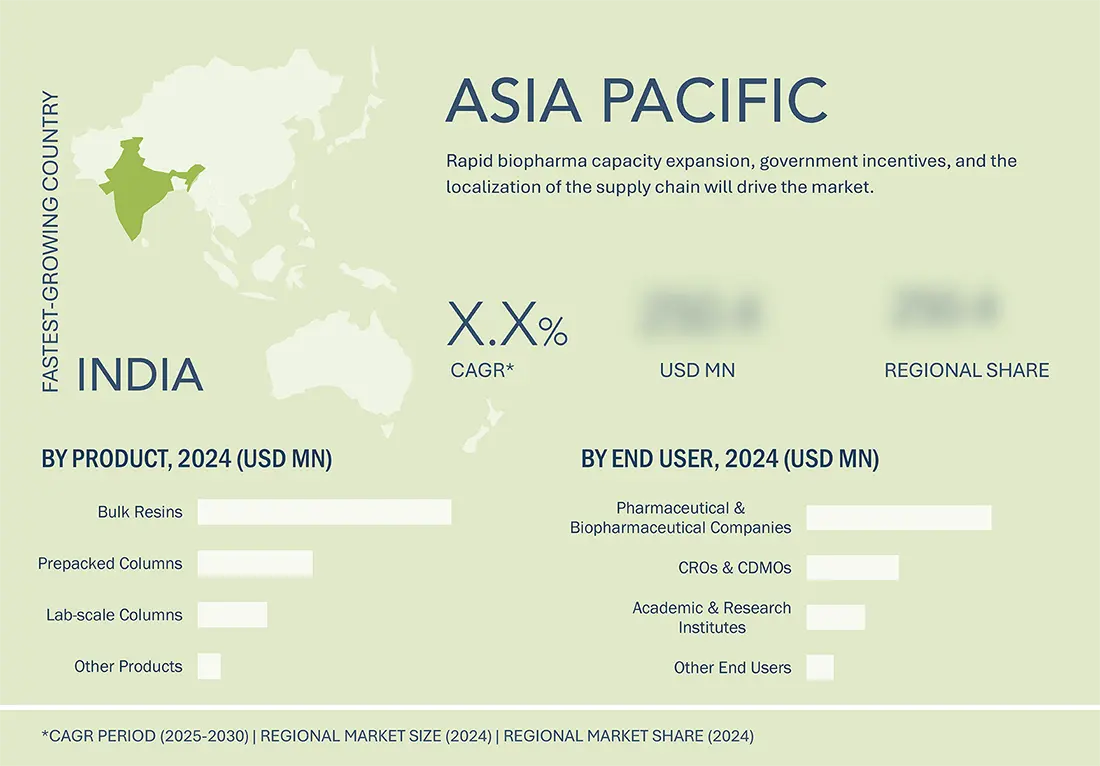
Asia-Pacific to be fastest-growing region in global Protein A Resins market during forecast period
Asia Pacific is the fastest-growing region, projected at a double-digit CAGR through 2030, fuelled by biosimilar approvals, CDMO expansions, and government support for local biologics manufacturing in India, China, and South Korea. While North America and Europe remain mature markets, growth is driven by process intensification, continuous chromatography adoption, and resin lifecycle extension strategies. Latin America and the Middle East remain nascent but are attracting investments in small-scale biosimilar facilities, likely to become opportunistic demand clusters for cost-optimized resins. The growing demand for affordable biologic therapies in the Asia Pacific patient population is encouraging local production, which in turn raises the need for protein A resins. The availability of cost-effective manufacturing environments and an increase in contract development and manufacturing organizations (CDMOs) also help to drive the rapid growth in this market. As a result, the Asia Pacific is the fastest-growing regional segment in the protein A resin market.
protein A resin market: COMPANY EVALUATION MATRIX
In the Protein A resin market matrix, Cytiva remains the market leader, anchored by its MabSelect PrismA line with high alkaline stability and global availability. Thermo Fisher/Purolite has gained momentum with Praesto resins, often chosen by CDMOs for high capacity and robust supply. Merck Millipore’s Eshmuno A series emphasizes strong regulatory support and lifecycle consistency, appealing to global innovators. Tosoh and Astrea have carved niches with differentiated ligands and formats, while Bio-Works and regional suppliers are scaling up with competitive, lower-cost alternatives. The competitive landscape is intensifying as new entrants focus on performance differentiation (e.g., higher cycle lifetime, PCC compatibility) and as established players expand through pre-packed offerings and global distribution.
Source: Secondary Research, Interviews with Experts, MarketsandMarkets Analysis
KEY MARKET PLAYERS
MARKET SCOPE
| REPORT METRIC | DETAILS |
|---|---|
| Market Size in 2024 (Value) | USD 1.42 Billion |
| Market Forecast in 2030 (value) | USD 2.06 Billion |
| Growth Rate | CAGR of 6.5% from 2025–2030 |
| Years Considered | 2023–2030 |
| Base Year | 2024 |
| Forecast Period | 2025–2030 |
| Units Considered | Value (USD Billion), Volume (L, mL) |
| Report Coverage | Revenue forecast, company ranking, competitive landscape, growth factors, and trends |
| Segments Covered |
|
| Regions Covered | North America, Asia Pacific, Europe, the Middle East & Africa, and Latin America |
WHAT IS IN IT FOR YOU: protein A resin market REPORT CONTENT GUIDE
DELIVERED CUSTOMIZATIONS
We have successfully delivered the following deep-dive customizations:
| CLIENT REQUEST | CUSTOMIZATION DELIVERED | VALUE ADDS |
|---|---|---|
| Biopharmaceutical Companies |
|
|
RECENT DEVELOPMENTS
- APR 2025 : Danaher, through its subsidiary Cytiva, introduced MabSelect SuRe?70 and MabSelect PrismA?X Protein?A resins designed for clinical- and commercial-scale mAb purification.
- Feb 2025 : Thermo Fisher Scientific Inc. acquired Solventum bioprocess filtration business to strengthen its end-to-end downstream purification offerings, complementing its chromatography lines, including Protein A resins.
- June 2025 : Repligen Corporation and Ecolab jointly introduced DurA?Cycle Protein?A Resin, designed for large-scale mAb manufacturing with improved cleaning resistance and cost savings.
Table of Contents
 Exclusive indicates content/data unique to MarketsandMarkets and not available with any competitors.
Methodology
This study balanced primary and secondary research for the protein A resin market by analyzing various market variables affecting small, medium, and large businesses. The next step involved conducting primary research with industry experts along the value chain to validate the findings, assumptions, and market sizing. Multiple methodologies, including both top-down and bottom-up approaches, were employed to estimate the overall market size.
The study encompasses significant market segments, evolving trends, regulatory frameworks, and competitive dynamics. It also examines leading market players and the strategies they employ in this sector. In conclusion, the total market size was estimated using a combination of top-down and bottom-up approaches and data triangulation to finalize the market size. Primary research was conducted throughout the study to validate and test each hypothesis.
Secondary Research
During the study, secondary research utilized various sources, including directories and databases like Bloomberg Businessweek, D&B Hoovers, and Factiva. Additional materials included white papers, annual reports, SEC filings, and investor presentations. This research approach was adopted to collect and analyze data that provides comprehensive, technical, and market-focused insights into the protein A resin market. The findings offer insights into key players and market segmentation based on recent industry trends and significant developments within the market. A database comprising leading industry figures was also created as part of this secondary research.
Primary Research
Primary research involved activities designed to gather both qualitative and quantitative data. A variety of individuals from both the supply and demand sides were questioned during this phase. On the supply side, key figures such as CEOs, vice presidents, directors of marketing and sales, directors of technology and innovation, and other important leaders were interviewed by industry experts. On the demand side, primary sources included academic institutions and research organizations. This research aimed to validate market segmentation, identify prominent market participants, and gain insights into significant industry trends and market dynamics through a real-world primary study.
A breakdown of the primary respondents is provided below:

To know about the assumptions considered for the study, download the pdf brochure
Market Size Estimation
This report offers an analysis of the global protein A resin market size by examining the revenue shares of major companies. Key players with significant market shares were identified through secondary research, and their revenue from protein A resin sales was calculated and verified through primary research. The secondary research included an analysis of annual and financial reports from leading market participants. Meanwhile, the primary research involved detailed interviews with key industry leaders, such as directors, CEOs, and marketing executives.
To calculate the global market value, segmental revenues were determined based on the revenue mapping of service and product providers. The process involved the following steps:
- Generating a list of key players that operate in the protein A resin market at the regional or global levels
- Mapping the products of manufacturers of protein A resin and related product lines at the regional level
- Mapping the revenues of listed players from protein A resin and related products
- Mapping the revenues of major players to cover at least ~90% of the global market share as of 2024
- Extrapolating the mapped revenues of players to arrive at the global market value for the respective segment
- Summing up the market value for all segments and subsegments to achieve the actual value of the global protein A resin market

Data Triangulation
After estimating the overall market size, the protein A resin market was divided into segments and subsegments. The entire market analysis process was completed using data triangulation and market segmentation techniques to gather accurate statistics for all segments and subsegments. This triangulation involved examining various trends and factors from both the demand and supply sides. Additionally, the protein A resin market data were verified and validated through both top-down and bottom-up approaches.
Market Definition
Protein A resin is a high-affinity chromatography medium used for the one-step purification of monoclonal antibody products and immunoglobulins from cell culture media. The resin is essential for the purification process, ensuring strict purity levels during the purification of therapeutic antibodies.
Stakeholders
- Pharmaceutical Companies
- Biopharmaceutical Companies
- CROs
- CDMOs
- Protein A resin manufacturers
- Protein A resin suppliers and distributors
- Market Research and Consulting Firms
- Academic & research institutes
- Regulatory authorities and industry associations
- Venture capitalists and investment firms
- Research Labs
Report Objectives
- To define, describe, and forecast the size of the protein A resin market based on product, source, matrix type, application, end user, and region
- To provide detailed information regarding the major factors influencing the growth potential of the global protein A resin market (drivers, restraints, opportunities, challenges, and trends)
- To analyze the micromarkets with respect to individual growth trends, prospects, and contributions to the global protein A resin market
- To analyze key growth opportunities in the global protein A resin market for key stakeholders and provide details of the competitive landscape for market leaders
- To forecast the size of market segments and/or subsegments with respect to five major regions: North America, Europe, Asia Pacific, Latin America, and the Middle East & Africa
- To profile the key players in the protein A resin market and comprehensively analyze their market shares and core competencies
- To track and analyze the competitive developments undertaken in the global protein A resin market, such as product launches, agreements, expansions, and mergers & acquisitions
Key Questions Addressed by the Report
What is the expected addressable market value of the global protein A resin market over a 5-year period?
The global protein A resin market is projected to reach USD 2.0 billion by 2030 from USD 1.5 billion in 2025, growing at a CAGR of 6.5% during the forecast period.
Which segment, based on matrix type, is expected to show the largest share within the protein A resin market?
Based on the matrix, the agarose-based protein A resin segment held the largest protein A resin market share in 2024. This is because proteins have a greater ability to bind with ligands than other matrices.
What are some of the strategies adopted by the top market players to penetrate emerging regions?
The major players in the market use partnerships, expansions, acquisitions, and collaborations as important growth tactics.
What are the major factors expected to limit the growth of the protein A resin market?
Concerns regarding scaling up the production due to high variation in results might restrict the market growth in the long term.
Are there any challenges the protein A resin end users face?
Limited resin reusability and fouling concerns limit the reuse of resins for a prolonged period.
Need a Tailored Report?
Customize this report to your needs
Get 10% FREE Customization
Customize This ReportPersonalize This Research
- Triangulate with your Own Data
- Get Data as per your Format and Definition
- Gain a Deeper Dive on a Specific Application, Geography, Customer or Competitor
- Any level of Personalization
Let Us Help You
- What are the Known and Unknown Adjacencies Impacting the Protein A Resin Market
- What will your New Revenue Sources be?
- Who will be your Top Customer; what will make them switch?
- Defend your Market Share or Win Competitors
- Get a Scorecard for Target Partners

Custom Market Research Services
We Will Customise The Research For You, In Case The Report Listed Above Does Not Meet With Your Requirements
Get 10% Free CustomisationTESTIMONIALS

JAYANT RAJPUROHIT
Director of Market Insights, Data and Analytics
SFI Health,
Leading Pharmaceutical Companywww.sfihealth.com/

We at SFI Health approached MarketsandMarkets for an Opportunity Assessment on "Incidence and Prevalence of Focus Indications" as we wanted to know the most attractive HCPs like Physician, Functional MD, Naturopath and Pharmacist. The project was critical for us to ensure our focus on the right target which would enable sustainable growth and profitability for SFI Health. The business insights provided exceeded our expectations and we were extremely impressed. The team at MarketsandMarkets is highly professional and detail oriented and very well understood our business needs. MarketsandMarkets offers a unique combination of expertise and dedicated engagement model. We identified 2 new products to be launched in coming months, based on the research findings provided by MarketsandMarkets. We are happy with the services and would strongly recommend MarketsandMarkets to my peers in the industry.

BEATRIZ DE LA CALLE
Head of Commercial Analytics
Qualicaps,
Leading Pharmaceutical Companywww.qualicaps.com/

We partnered with MarketsandMarkets for an assessment study on hard empty capsules. The team was extremely professional in understanding our business requirements and we received timely responses to all our queries. The market intelligence and the recommendations has met our business requirements. We were extremely impressed to see the final study results; it really exceeded our expectations. The market intelligence offered by MarketsandMarkets, and clarity on next steps will help us achieve our business objective for the Year 2021. We are happy with the services and would strongly recommend MarketsandMarkets to my peers in the industry.

Bob Williams,
Senior Director Business Development & Innovation
Bracco Diagnostics Inc.,
Italian Multinational in life sciences sector and a World Leader in imaging diagnosticsimaging.bracco.com/us-en
We were pleased with targeted insights that MarketsandMarkets identified from a custom study on the 'Radiation Dose Management Solutions Market'. Your team identified and characterized the market participants as well as underlying trends accurately. This study was useful to Bracco in formulating business strategies for our dose monitoring product lines and we thank MarketsandMarkets for the job well done.
Cody Coonradt,
Market Development and Strategy Manager
3M Health Information Systems,
Leader in Health care Coding, Payment & Analytics Solutions.www.3m.com/3M/en_US/health-information-systems-us
The value for our organization comes from three things: depth of research, specificity of segments and being easy to work with. As important as the first two are, the third can't be underestimated. MarketsandMarkets, maybe more than any other research vendor, wants to know what is top of mind for our team and what big questions we are grappling to answer.
Their customer first approach and high value engagement model, have given us great analysis and excellent value for money
Growth opportunities and latent adjacency in Protein A Resin Market


Olive
Feb, 2023
What are the top 2 use cases of protein A resin market in near future?.