Radiotherapy Market by Type (Product, Service), Technology (LINAC, Stereotactic LINAC, Particle Therapy, Cobalt-60 Teletherapy), Procedure (IMRT, IGRT, 3D-CRT, LDR, HDR), Application (Prostate, Breast, Lung), End User (Hospital) & Region - Global Forecasts to 2027
Updated on : February 15, 2023
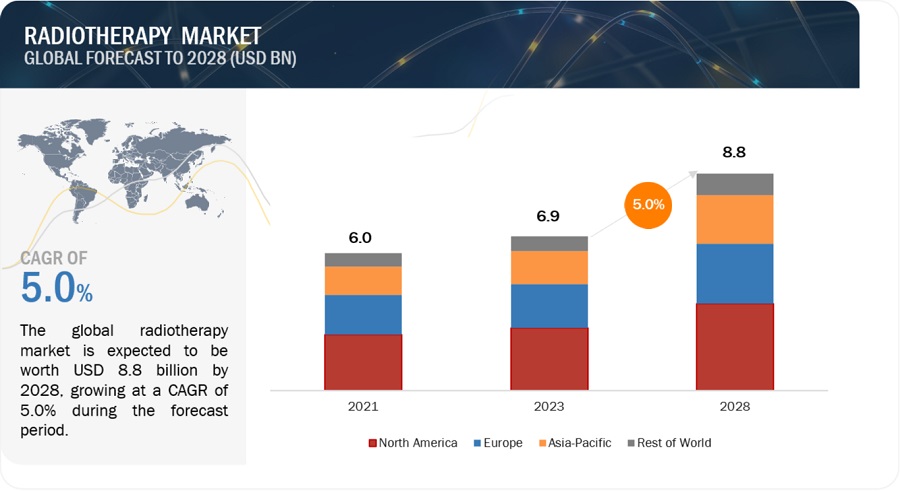
The global radiotherapy market in terms of revenue was estimated to be worth $6.3 billion in 2022 and is poised to reach $8.1 billion by 2027, growing at a CAGR of 5.1% from 2022 to 2027.
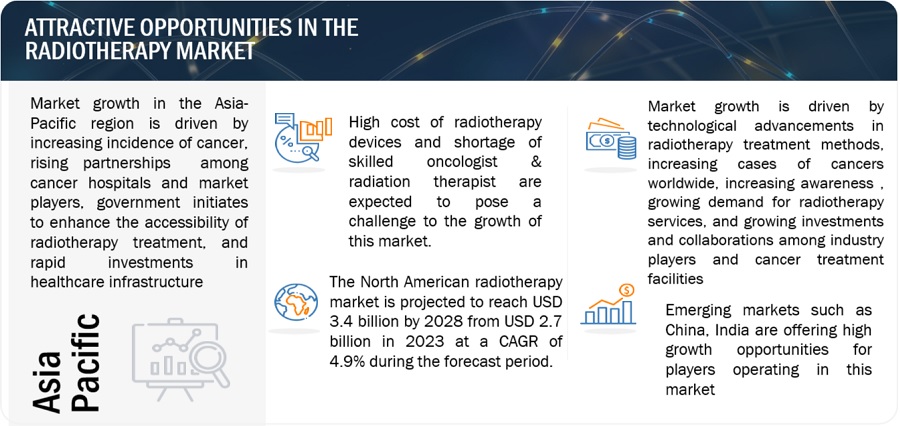
Technological advancements in radiotherapy and the rising incidence of cancer are the major factors driving the growth of this market. Additionally, growing awareness of the benefits of radiotherapy and the increasing use of particle therapy for cancer treatment are other factors driving the growth of this market. However, inadequate healthcare infrastructure, especially in emerging countries and shortage of skilled oncologists and radiologists hinders the growth of this market. In addition to this, high cost of radiotherapy devices, and high complexities associated with radiotherapy treatment are the factors expected to restrain the growth of this market during the forecast period.
To know about the assumptions considered for the study, Request for Free Sample Report
Radiotherapy Market Dynamics
Drivers: Awareness initiatives on the benefits of radiotherapy
Driven by the benefits of radiotherapy procedures, many initiatives, such as conferences and symposia, have been organized in recent years. In such events, a greater emphasis is laid on spreading awareness about the advantages and treatment benefits offered by radiotherapy for a wide range of cancers. For instance, the 6th Cancer World Congress is scheduled to be held in September 2022 in Portugal. The theme of the 6th Cancer World Congress 2022 is “Personalized Cancer Diagnosis and Therapy.” The 5th Global Cancer Summit - 2022 (GCS-2022) was held in May 2022 Virtually by BioGenesis Health Cluster, Bangalore and Global Cancer Foundation with the theme "Living with cancer in the 21st century.
Several events related to radiotherapy are being organized to spread awareness and impart training for radiotherapy procedures among oncologists and radiographers. Such events play an integral role in raising awareness about the available radiotherapy procedures and their benefits, which is expected to boost the demand and adoption of radiotherapy devices
Restraints: Shortage of skilled oncologists and radiologists
The global market is witnessing continuous technological innovations and advancements to make the devices and techniques more accurate and specific. However, radiotherapy is a clinical modality wherein high standards can only be achieved and maintained by full-time specialists. The implementation of advanced radiotherapy is thus expected to be hampered by the shortage of trained personnel and the lack of technical expertise. Many cancer patients miss out on effective and advanced radiotherapy procedures due to the shortage of skilled and trained personnel. Also, the impact of this factor is higher in developing and underdeveloped countries.
According to the American Society of Clinical Oncologists (ASCO), there were 13,146 oncologists engaged in active patient care in the United States in 2021. Some cities are flush with oncologists; however, 32 million Americans live in a county with no oncologists. ASCO projects a shortage of more than 2,200 oncologists by 2025. This shortage of oncologists and radiologists in several countries worldwide is expected to affect the adoption of oncology procedures.
Opportunities: Increasing public-private investments in cancer research
Increasing public-private investments and funding for cancer research to bring in advancements in the diagnosis and treatment of cancer is one of the major factors supporting the growth of the global market. For instance, in July 2021, Leo Cancer Care (UK) raised USD 25.3 million in funding from investors worldwide, taking an active interest in the business’s plan to develop good radiotherapy solutions. The investors included Yu Galaxy, WARF, Alumni Ventures, Junson Capital, Serra Ventures, and industry players CHC, Cosylab, Toret Devices, and Radiation Business Solutions. Similarly, in August 2020, the Australian Government opened an application for funding of USD 45.5 million to develop regional radiation treatment centers for local cancer patients in rural and regional areas of New South Wales, Queensland, Victoria, and South Australia. Such investments from public and private sources are expected to offer potential growth opportunities for market players in the coming years
Challenges: Difficulties in visualizing tumors during radiotherapy procedures
One of the major challenges faced during radiotherapy procedures is difficulties faced in the visualization of tumors and demarcations from normal healthy tissues. Advancements in ionizing radiation therapy for cancer treatment are expected to help overcome this challenge. However, since tumors can change their shape daily, it becomes difficult to only radiate the cancerous outgrowth without affecting the surrounding tissues. To limit this, radiologists include a safety margin around the tumor. Also, to minimize the damage to the surrounding healthy tissue, it becomes a compulsion to limit the radiotherapy dose range, increasing the number of treatment cycles needed to eradicate tumorous cells. This is one of the major factors responsible for increasing the cancer treatment costs for patients undergoing radiotherapy. Moreover, despite technological advancements in imaging techniques, detecting tumor progression is still a clinical challenge. Due to these challenges, alternative treatment technologies such as chemotherapy and conventional surgical procedures are preferred by oncologists.
Radiotherapy Market Ecosystem:
The cyberknife sub-segment of stereotactic advanced electron/cobalt-60 linear accelerators, within linear accelerators segment of external beam radiotherapy, accounted for the largest share of the global radiotherapy market in 2021
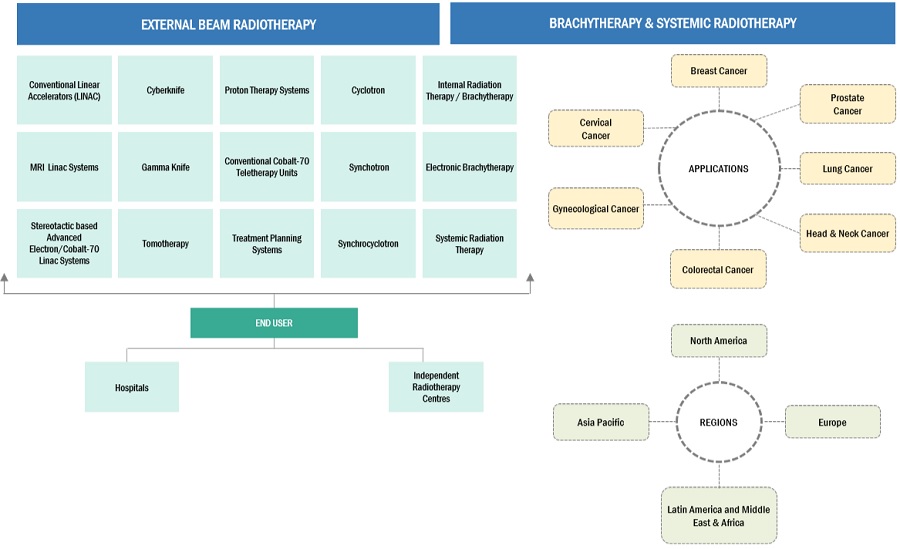
On the basis of technology, the market is segmented into external beam radiotherapy, internal beam radiotherapy/brachytherapy, and systemic radiotherapy products. The external beam radiotherapy products segment is further divided into linear accelerators, particle therapy systems, and conventional cobalt-60 teletherapy units. The internal beam radiotherapy/brachytherapy products segment includes seeds, applicators, after loaders, and IORT systems. The linear accelerators or LINAC segment is further characterized by conventional LINAC systems and stereotactic advanced electron/cobalt-60 LINAC systems. The stereotactic advanced electron/cobalt-60 linear accelerators market segment is further classified into CyberKnife, Gamma Knife, and TomoTherapy. The CyberKnife sub-segment accounted for the largest market share in 2021 mainly due to continuous developments in the CyberKnife system. In June 2020, Accuray Incorporated (US) launched the CyberKnife S7 System for all stereotactic radiosurgery (SRS) and stereotactic body radiation therapy (SBRT) treatments. The company also entered into several supply deals for their CyberKnife platform between 2018 and 2021 with several organizations, including Stanford University Medical Center, Swiss Medical Network, and Mercy Advances Cancer Care. This is expected to further support the adoption of the technology.
The prostate cancer segment, by application, to account for highest market share in the Internal Beam radiotherapy market in 2021
The market is segmented into prostate cancer, gynecological cancer, breast cancer, cervical cancer, penile cancer, and other cancers. The prostate cancer segment accounted for the largest market share amongst the internal beam radiotherapy applications market in 2021. Prostate brachytherapy is a cutting-edge treatment for prostate cancer. Both LDR and HDR brachytherapy is used for prostate cancer treatment. Moreover, brachytherapy is increasingly being used for the treatment of high-risk prostate cancer globally. It is applied alone or in combination with hormone therapy or EBRT. LDR brachytherapy is as effective as prostatectomy or EBRT because it delivers low-dose radiation and provides protection to the surrounding healthy tissues. In addition, brachytherapy eliminates the need to monitor the movement of the prostate gland, as the implanted radioactive seeds move with the gland.
The particle therapy segment, by procedure, accounted for the highest growth rate in the external beam radiotherapy market, by procedures, during the forecast year
The external beam radiotherapy segment is classified into IGRT, IMRT, stereotactic therapy, particle beam therapy, and 3D-CRT. The particle therapy segment is expected to reguister the highest growth rate in the external beam radiotherapy market, by procedures, during the forecast year. The high growth of this segment can be attributed to factors such as the rise in the number of proton therapy centers worldwide, increasing research activities in the field of radiation oncology using proton therapy systems, lower risks associated with proton beam therapy, and longer equipment lifespan of proton beam therapy systems (30 years or more) as compared to photon therapy systems (10 years).
To know about the assumptions considered for the study, download the pdf brochure
The US market accounted for the largest market share in the radiotherapy market in 2021
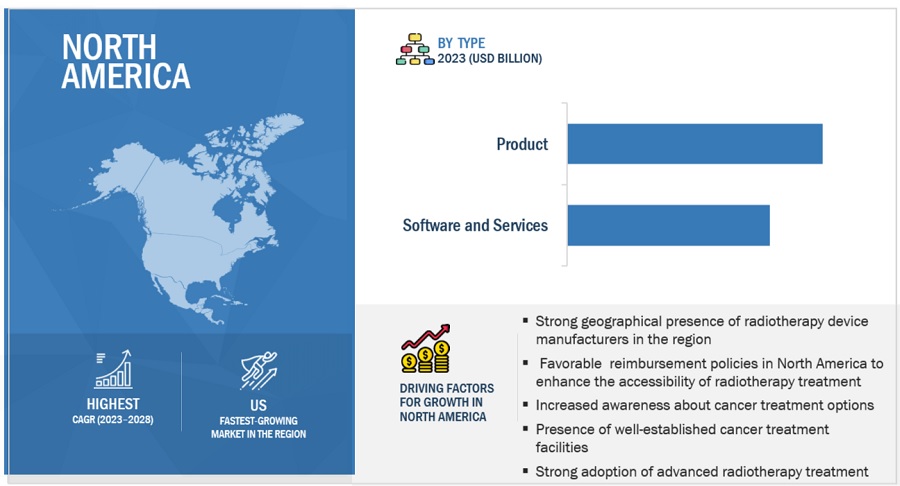
The global market is segmented into five major regions, namely, North America, Europe, Asia Pacific, Latin America, and the Middle East & Africa. The North American market is further segmented into the US and Canada. In 2021, the US accounted for the largest share of the global market in North America. The growth in this market is primarily driven by the increasing awareness about radiotherapy, the rising geriatric population, government initiatives (in the form of funds & grants) for radiotherapy-related research and development, and the rising incidence of various cancers.
The dominant players in the global radiotherapy market are Siemens Healthineers AG (Germany), Elekta (Sweden) Accuray Incorporated (US), IBA (Belgium), ViewRay Technologies, Inc. (US), Hitachi Ltd. (Japan), iCAD, Inc. (US), IsoRay, Inc. (US), Mevion Medical Systems, Inc. (US), Panacea Medical Technologies Pvt. Ltd. (India), P-cure Ltd. (Israel), and ZEISS Group (Germany), among others.
In FY 2021, Siemens Healthineers AG became the leading player in the global market after the successful acquisition of Varian Medical Systems, Inc. (US) in April 2021. The company commanded the highest market share in the global radiotherapy mainly due to the broad product portfolio of Varian Medical Systems, Inc. and the combined sales & distribution capabilities of both companies. The company focuses on both organic & inorganic growth strategies to enhance its footprint in the global market. In the last three years (2019-2021), Varian medical systems, Inc., under Siemens Healthineers, introduced and received regulatory approvals for several products (including ProBeam proton therapy system, ProBeam 360 with multi-room configuration, and Halcyon system). The company has entered into several agreements, partnerships, collaborations, and contracts to enhance its market presence.
Radiotherapy Market Report Scope:
Report Metric |
Details |
Market size available for years |
2020–2027 |
Base year considered |
2021 |
Forecast period |
2022-2027 |
Forecast units |
Value (USD billion) |
Segments covered |
Type, Technology, Application, Procedure, End User, and Region |
Geographies covered |
North America, Europe, Asia Pacific, Latin America, and the Middle East & Africa |
Companies covered |
Siemens Healthineers AG (Germany), Elekta (Sweden) Accuray Incorporated (US), IBA (Belgium), ViewRay Technologies, Inc. (US), Hitachi Ltd. (Japan), iCAD, Inc. (US), IsoRay, Inc. (US), Mevion Medical Systems, Inc. (US), Panacea Medical Technologies Pvt. Ltd. (India), P-cure Ltd. (Israel), and ZEISS Group (Germany), among others. |
This report has segmented the global radiotherapy market into following segments & sub-segments:
By Type
- Product
- Service
By Technology
-
External Beam Radiotherapy
-
Linear Accelerators
- Conventional Linear Accelerators
-
Stereotactic Advanced Electron/Cobalt-60 Linear Accelerators
- Gamma Knife
- CyberKnife
- TomoTherapy
- Conventional Cobalt-60 Teletherapy Units
-
Particle Therapy Systems
- Cyclotrons
- Synchrotrons
- Synchrocyclotron
-
Linear Accelerators
-
Internal Beam Radiotherapy/Brachytherapy
- Seeds
- Afterloaders
- Applicators
- IORT Systems
-
Systemic Radiotherapy
- Iobenguane (I-131)
- Samarium-153
- Rhenium-186
- Other Systemic Radiotherapy Products*
Note:*Other systemic radiotherapy products include Yttrium-90, Radium-223, Phosphorous-32, and Radio-labelled Antibodies, among others.
By Application
-
External Beam Radiotherapy
- Prostate Cancer
- Breast Cancer
- Lung Cancer
- Head and Neck Cancer
- Colorectal Cancer
- Other Cancers*
-
Internal Beam Radiotherapy/Brachytherapy
- Prostate Cancer
- Gynecological Cancer
- Breast Cancer
- Cervical Cancer
- Penile Cancer
- Other Cancers**
Note 2: *Other cancers in external beam radiotherapy applications include spine, brain, and pediatric cancer, among others.
Note 3:**Other cancers in internal beam radiotherapy applications include lung and head & neck cancer, among others.
By Procedure
-
External Beam Radiotherapy
- Image-guided Radiotherapy
- Intensity-modulated Radiotherapy
- Stereotactic Therapy
- Particle Therapy
- 3D Conformal Radiotherapy
-
Internal Beam Radiotherapy/Brachytherapy
- High-dose-rate Brachytherapy
- Low-dose-rate Brachytherapy
- Pulsed-dose-rate Brachytherapy
- Systemic Radiotherapy
- Intravenous Radiotherapy
- Oral Radiotherapy
- Instillation Radiotherapy
By End User
- Hospitals
- Independent Radiotherapy Centers
By Region
-
North America
- US
- Canada
-
Europe
- Germany
- France
- UK
- Italy
- Spain
- Rest of Europe (RoE)
-
Asia Pacific
- Japan
- China
- India
- Australia
- South Korea
- RoAPAC
-
Latin America
- Brazil
- Mexico
- RoLA
- Middle East & Africa
Recent Developments
- In June 2021, Elekta (Sweden) received US FDA 510(k) clearance for its Elekta Harmony radiation therapy system.
- In June 2020, Accuray Incorporated (US) launched the CyberKnife S7 System, an innovative device combining speed, advanced precision, and real-time AI-driven motion tracking and synchronization treatment delivery for all stereotactic radiosurgery (SRS) and stereotactic body radiation therapy (SBRT) treatments.
- In September 2019, the ProBeam 360° proton therapy system, by Varian Medical Systems, Inc. (US), now under Siemens Healthineers AG (Germany), was made available in a multi-room configuration (it is the smallest multi-room system available for sale).
Frequently Asked Questions (FAQs):
What is the projected market value of the global radiotherapy market?
The global market of radiotherapy is projected to reach USD 8.1 billion.
What is the estimated growth rate (CAGR) of the global radiotherapy market for the next five years?
The global radiotherapy market is projected to grow at a Compound Annual Growth Rate (CAGR) of 5.1% from 2022 to 2027.
What are the major revenue pockets in the radiotherapy market currently?
The global market is segmented into five major regions, namely, North America, Europe, Asia Pacific, Latin America, and the Middle East & Africa. The North American market is further segmented into the US and Canada. In 2021, the US accounted for the largest share of the global market in North America. The growth in this market is primarily driven by the increasing awareness about radiotherapy, the rising geriatric population, government initiatives (in the form of funds & grants) for radiotherapy-related research and development, and the rising incidence of various cancers.
To speak to our analyst for a discussion on the above findings, click Speak to Analyst
TABLE OF CONTENTS
1 INTRODUCTION (Page No. - 26)
1.1 OBJECTIVES OF STUDY
1.2 MARKET DEFINITION
1.3 STUDY SCOPE
1.3.1 MARKETS COVERED
1.3.2 GEOGRAPHIES COVERED
1.3.3 INCLUSIONS & EXCLUSIONS
1.3.4 YEARS CONSIDERED
1.4 CURRENCY USED
1.5 LIMITATIONS
1.6 MARKET STAKEHOLDERS
1.7 SUMMARY OF CHANGES
2 RESEARCH METHODOLOGY (Page No. - 31)
2.1 RESEARCH APPROACH
FIGURE 1 RADIOTHERAPY MARKET: RESEARCH DESIGN METHODOLOGY
2.1.1 SECONDARY RESEARCH
2.1.2 PRIMARY RESEARCH
2.1.2.1 Primary sources
FIGURE 2 BREAKDOWN OF PRIMARY INTERVIEWS: SUPPLY-SIDE AND DEMAND-SIDE PARTICIPANTS
FIGURE 3 BREAKDOWN OF PRIMARIES: GLOBAL MARKET
2.2 MARKET SIZE ESTIMATION
FIGURE 4 RESEARCH METHODOLOGY: HYPOTHESIS BUILDING
2.2.1 REVENUE MAPPING-BASED MARKET ESTIMATION
2.2.2 USAGE-BASED MARKET ESTIMATION
FIGURE 5 MARKET SIZE ESTIMATION METHODOLOGY: GLOBAL MARKET
2.2.3 PRIMARY RESEARCH VALIDATION
2.3 DATA TRIANGULATION
FIGURE 6 DATA TRIANGULATION
2.4 RESEARCH ASSUMPTIONS AND LIMITATIONS
2.4.1 RESEARCH ASSUMPTIONS
2.4.2 RESEARCH LIMITATIONS
FIGURE 7 RESEARCH LIMITATIONS
3 EXECUTIVE SUMMARY (Page No. - 40)
FIGURE 8 RADIOTHERAPY MARKET, BY TYPE, 2022 VS. 2027 (USD MILLION)
FIGURE 9 GLOBAL MARKET, BY TECHNOLOGY, 2022 VS. 2027 (USD MILLION)
FIGURE 10 EXTERNAL BEAM RADIOTHERAPY MARKET, BY APPLICATION, 2022 VS. 2027 (USD MILLION)
FIGURE 11 INTERNAL BEAM RADIOTHERAPY/BRACHYTHERAPY MARKET, BY PROCEDURE, 2022 VS. 2027 (USD MILLION)
FIGURE 12 GLOBAL MARKET SHARE, BY END USER, 2022 VS. 2027
FIGURE 13 GEOGRAPHICAL SNAPSHOT OF THE GLOBAL MARKET
4 PREMIUM INSIGHTS (Page No. - 45)
4.1 RADIOTHERAPY MARKET OVERVIEW
FIGURE 14 RISING CANCER PREVALENCE WORLDWIDE TO DRIVE GROWTH
FIGURE 15 EXTERNAL BEAM RADIOTHERAPY MARKET, BY PROCEDURE, 2022 VS. 2027 (USD MILLION)
4.2 EUROPE: MARKET, BY TECHNOLOGY AND REGION (2021)
FIGURE 16 LINEAR ACCELERATORS SEGMENT ACCOUNTED FOR THE LARGEST SHARE OF THE MARKET
4.3 GEOGRAPHIC SNAPSHOT OF GLOBAL MARKET
FIGURE 17 CHINA REGISTERS HIGHEST CAGR DURING THE FORECAST PERIOD
5 MARKET OVERVIEW (Page No. - 48)
5.1 INTRODUCTION
5.2 MARKET DYNAMICS
FIGURE 18 RADIOTHERAPY MARKET: DRIVERS, RESTRAINTS, OPPORTUNITIES, AND CHALLENGES
5.2.1 DRIVERS
5.2.1.1 Technological advancements
5.2.1.2 Increasing incidence of cancer worldwide
TABLE 1 PROJECTION FOR NEW CANCER CASES BASED ON IARC DATA
5.2.1.3 Awareness initiatives on the benefits of radiotherapy
5.2.1.4 Growing use of particle therapy for cancer treatment
TABLE 2 PARTICLE THERAPY FACILITIES IN CLINICAL OPERATION (AS OF MAY 2022)
5.2.2 RESTRAINTS
5.2.2.1 Inadequate healthcare infrastructure
5.2.2.2 Shortage of skilled oncologists and radiologists
5.2.2.3 High cost of radiotherapy devices
5.2.2.4 High complexities associated with radiotherapy
5.2.3 OPPORTUNITIES
5.2.3.1 Rising healthcare expenditure across developing countries
5.2.3.2 Increasing public-private investments in cancer research
5.2.4 CHALLENGES
5.2.4.1 Difficulties in visualizing tumors during radiotherapy procedures
5.2.4.2 Risk of radiation exposure
5.3 PORTER’S FIVE FORCES ANALYSIS
5.3.1 OVERVIEW
TABLE 3 GLOBAL MARKET: PORTER’S FIVE FORCES ANALYSIS
5.3.2 THREAT OF NEW ENTRANTS
5.3.3 THREAT OF SUBSTITUTES
5.3.4 BARGAINING POWER OF SUPPLIERS
5.3.5 BARGAINING POWER OF BUYERS
5.3.6 DEGREE OF COMPETITION
5.4 REGULATORY SCENARIO
5.4.1 KEY REGULATORY BODIES & GOVERNMENT AGENCIES IN THE GLOBAL MARKET
TABLE 4 KEY REGULATORY BODIES & GOVERNMENT AGENCIES
5.4.2 KEY REGULATORY GUIDELINES
5.4.2.1 US
TABLE 5 US: MEDICAL DEVICE REGULATORY APPROVAL PROCESS
5.4.2.2 Europe
5.4.2.3 Japan
TABLE 6 JAPAN: MEDICAL DEVICE CLASSIFICATION UNDER PMDA
5.5 REIMBURSEMENT SCENARIO
TABLE 7 CPT CODES FOR MAJOR RADIOTHERAPY TREATMENT MODALITY
TABLE 8 REIMBURSEMENT FOR RADIOTHERAPY PROCEDURES PER COURSE, 2021 VS. 2022
TABLE 9 OUTPATIENT PROSPECTIVE PAYMENT SYSTEM (OPPS) TECHNICAL PER PROCEDURE NATIONAL AVERAGE MEDICARE REIMBURSEMENT (2021 VS. 2022)
TABLE 10 FREESTANDING PER COURSE NATIONAL AVERAGE MEDICARE REIMBURSEMENT, 2021 VS. 2022
5.6 ECOSYSTEM COVERAGE
5.7 VALUE CHAIN ANALYSIS
5.7.1 RESEARCH & DEVELOPMENT
5.7.2 PROCUREMENT AND PRODUCT DEVELOPMENT
5.7.3 MARKETING, SALES & DISTRIBUTION, AND POST-SALES SERVICES
FIGURE 19 VALUE CHAIN ANALYSIS
5.8 SUPPLY-CHAIN ANALYSIS
5.8.1 PROMINENT COMPANIES
5.8.2 SMALL & MEDIUM-SIZED ENTERPRISES
5.8.3 END USERS
FIGURE 20 SUPPLY-CHAIN ANALYSIS
5.9 PRICING ANALYSIS
5.9.1 AVERAGE SELLING PRICE OF KEY PLAYERS
5.9.2 AVERAGE SELLING PRICE TREND
5.10 PATENT DETAILS
FIGURE 21 TOP 10 PATENT APPLICANTS FOR RADIOTHERAPY (JANUARY 2012–JUNE 2022)
FIGURE 22 TOP 10 PATENT INVENTORS FOR RADIOTHERAPY (JANUARY 2012–JUNE 2022)
FIGURE 23 TOP 10 PATENT OWNERS FOR RADIOTHERAPY (JANUARY 2012–JUNE 2022)
5.11 TRADE ANALYSIS
TABLE 11 IMPORT DATA FOR LINEAR ACCELERATORS (HS CODE 902214), BY COUNTRY, 2017–2021 (USD MILLION)
TABLE 12 EXPORT DATA FOR LINEAR ACCELERATORS (HS CODE 902214), BY COUNTRY, 2017–2021 (USD MILLION)
5.12 TECHNOLOGY ANALYSIS
TABLE 13 IMPORTANT PRODUCT LAUNCHES IN THE GLOBAL MARKET (JANUARY 2015–JUNE 2022)
5.13 KEY CONFERENCES & EVENTS (2022–2023)
TABLE 14 GLOBAL MARKET: DETAILED LIST OF MAJOR CONFERENCES & EVENTS
5.14 TRENDS/DISRUPTIONS IMPACTING CUSTOMER BUSINESSES
FIGURE 24 EMERGING TRENDS AND OPPORTUNITIES AFFECTING FUTURE REVENUE MIX
5.15 KEY STAKEHOLDERS & BUYING CRITERIA
5.15.1 KEY STAKEHOLDERS
FIGURE 25 INFLUENCE OF STAKEHOLDERS IN BUYING PROCESS FOR RADIOTHERAPY SYSTEMS
TABLE 15 INFLUENCE OF STAKEHOLDERS IN BUYING PROCESS FOR PRODUCT SEGMENTS (%)
5.16 KEY BUYING CRITERIA BY END USERS
TABLE 16 KEY BUYING CRITERIA FOR PRODUCT SEGMENTS
6 RADIOTHERAPY MARKET, BY TYPE (Page No. - 79)
6.1 INTRODUCTION
TABLE 17 GLOBAL MARKET, BY TYPE, 2020–2027 (USD MILLION)
6.2 PRODUCT
6.2.1 LARGE UNTAPPED MARKETS IN EMERGING COUNTRIES DRIVE GROWTH
TABLE 18 PRODUCT MARKET, BY REGION, 2020–2027 (USD MILLION)
6.3 SERVICE
6.3.1 LARGE INSTALLATION BASES IN MATURE MARKETS FUEL DEMAND FOR SERVICES
TABLE 19 SERVICE MARKET, BY REGION, 2020–2027 (USD MILLION)
7 RADIOTHERAPY MARKET, BY TECHNOLOGY (Page No. - 82)
7.1 INTRODUCTION
TABLE 20 GLOBAL MARKET, BY TECHNOLOGY, 2020–2027 (USD MILLION)
TABLE 21 GLOBAL MARKET, BY TECHNOLOGY, 2020–2027 (UNITS INSTALLED)
7.2 EXTERNAL BEAM RADIOTHERAPY (EBRT)
TABLE 22 EXTERNAL BEAM RADIOTHERAPY MARKET, BY TYPE, 2020–2027 (USD MILLION)
TABLE 23 EXTERNAL BEAM RADIOTHERAPY MARKET, BY TYPE, 2020–2027 (UNITS INSTALLED)
TABLE 24 EXTERNAL BEAM RADIOTHERAPY MARKET, BY REGION, 2020–2027 (USD MILLION)
7.2.1 LINEAR ACCELERATORS
TABLE 25 LINEAR ACCELERATORS MARKET, BY TYPE, 2020–2027 (USD MILLION)
TABLE 26 LINEAR ACCELERATORS MARKET, BY REGION, 2020–2027 (USD MILLION)
7.2.1.1 Conventional linear accelerators
7.2.1.1.1 Longer treatment duration limits adoption
TABLE 27 CONVENTIONAL LINEAR ACCELERATORS MARKET, BY REGION, 2020–2027 (USD MILLION)
7.2.1.2 Stereotactic advanced electron/cobalt-60 linear accelerators
TABLE 28 STEREOTACTIC ADVANCED ELECTRON/COBALT-60 LINEAR ACCELERATORS MARKET, BY TYPE, 2020–2027 (USD MILLION)
TABLE 29 STEREOTACTIC ADVANCED ELECTRON/COBALT-60 LINEAR ACCELERATORS MARKET, BY REGION, 2020–2027 (USD MILLION)
7.2.1.2.1 CyberKnife
7.2.1.2.1.1 CyberKnife offers precise radiation delivery with robotic correction capabilities
TABLE 30 CYBERKNIFE MARKET, BY REGION, 2020–2027 (USD MILLION)
7.2.1.2.2 Gamma Knife
7.2.1.2.2.1 Ongoing product development and launches support demand
TABLE 31 GAMMA KNIFE MARKET, BY REGION, 2020–2027 (USD MILLION)
7.2.1.2.3 TomoTherapy
7.2.1.2.3.1 High installation and maintenance costs limit adoption
TABLE 32 TOMOTHERAPY MARKET, BY REGION, 2020–2027 (USD MILLION)
7.2.2 PARTICLE THERAPY SYSTEMS
TABLE 33 PARTICLE THERAPY SYSTEMS MARKET, BY TYPE, 2020–2027 (USD MILLION)
TABLE 34 PARTICLE THERAPY SYSTEMS MARKET, BY REGION, 2020–2027 (USD MILLION)
7.2.2.1 Cyclotrons
7.2.2.1.1 Cyclotrons deliver a continuous stream of particles to a tumor site, enhancing outcomes
TABLE 35 CYCLOTRONS MARKET, BY REGION, 2020–2027 (USD MILLION)
7.2.2.2 Synchrotrons
7.2.2.2.1 Increasing investments in synchrotron facilities drive market
TABLE 36 SYNCHROTRONS MARKET, BY REGION, 2020–2027 (USD MILLION)
7.2.2.3 Synchrocyclotrons
7.2.2.3.1 High space requirements limit widespread adoption
TABLE 37 SYNCHROCYCLOTRONS MARKET, BY REGION, 2020–2027 (USD MILLION)
7.2.3 CONVENTIONAL COBALT-60 TELETHERAPY UNITS
7.2.3.1 Complex dose delivery planning and radiation exposure limit market adoption
TABLE 38 CONVENTIONAL COBALT-60 TELETHERAPY UNITS MARKET, BY REGION, 2020–2027 (USD MILLION)
7.3 INTERNAL BEAM RADIOTHERAPY/BRACHYTHERAPY
TABLE 39 INTERNAL BEAM RADIOTHERAPY/BRACHYTHERAPY MARKET, BY TYPE, 2020–2027 (USD MILLION)
TABLE 40 INTERNAL BEAM RADIOTHERAPY/BRACHYTHERAPY MARKET, BY REGION, 2020–2027 (USD MILLION)
7.3.1 SEEDS
7.3.1.1 Adverse side-effects associated with seeds limit adoption
TABLE 41 INTERNAL BEAM RADIOTHERAPY/BRACHYTHERAPY SEEDS MARKET, BY REGION, 2020–2027 (USD MILLION)
7.3.2 APPLICATORS
7.3.2.1 Manual applicators pose a high risk of radiation exposure
TABLE 42 INTERNAL BEAM RADIOTHERAPY/BRACHYTHERAPY APPLICATORS MARKET, BY REGION, 2020–2027 (USD MILLION)
7.3.3 AFTERLOADERS
7.3.3.1 Proper positioning and better control of isotopes in modern afterloaders drive demand
TABLE 43 INTERNAL BEAM RADIOTHERAPY/BRACHYTHERAPY AFTERLOADERS MARKET, BY REGION, 2020–2027 (USD MILLION)
7.3.4 IORT SYSTEMS
7.3.4.1 Rising adoption of electronic brachytherapy procedures supports growth
TABLE 44 IORT SYSTEMS MARKET, BY REGION, 2020–2027 (USD MILLION)
7.4 SYSTEMIC RADIOTHERAPY
7.4.1 HIGH RISK OF RADIATION EXPOSURE LIMITS ADOPTION
7.4.2 IOBENGUANE (I-131)
7.4.3 SAMARIUM-153
7.4.4 RHENIUM-186
7.4.5 OTHER SYSTEMIC RADIOTHERAPY PRODUCTS
8 RADIOTHERAPY MARKET, BY APPLICATION (Page No. - 104)
8.1 INTRODUCTION
TABLE 45 GLOBAL MARKET, BY APPLICATION, 2020–2027 (USD MILLION)
8.2 EXTERNAL BEAM RADIOTHERAPY APPLICATION
TABLE 46 EXTERNAL BEAM RADIOTHERAPY APPLICATION MARKET, BY TYPE, 2020–2027 (USD MILLION)
TABLE 47 EXTERNAL BEAM RADIOTHERAPY APPLICATION MARKET, BY REGION, 2020–2027 (USD MILLION)
8.2.1 PROSTATE CANCER
8.2.1.1 High incidence rate and efficiency of EBRT for prostate cancer treatment support growth
TABLE 48 EXTERNAL BEAM RADIOTHERAPY MARKET FOR PROSTATE CANCER, BY REGION, 2020–2027 (USD MILLION)
8.2.2 BREAST CANCER
8.2.2.1 Therapeutic benefits of EBRT for breast cancer support market growth
TABLE 49 EXTERNAL BEAM RADIOTHERAPY MARKET FOR BREAST CANCER, BY REGION, 2020–2027 (USD MILLION)
8.2.3 LUNG CANCER
8.2.3.1 Radiotherapy can be used as adjuvant therapy for lung cancer
TABLE 50 EXTERNAL BEAM RADIOTHERAPY MARKET FOR LUNG CANCER, BY REGION, 2020–2027 (USD MILLION)
8.2.4 HEAD & NECK CANCER
8.2.4.1 Noninvasiveness of EBRT in treatment of head & neck cancers drives growth
TABLE 51 EXTERNAL BEAM RADIOTHERAPY MARKET FOR HEAD & NECK CANCER, BY REGION, 2020–2027 (USD MILLION)
8.2.5 COLORECTAL CANCER
8.2.5.1 High incidence of colorectal cancer to support market growth
TABLE 52 EXTERNAL BEAM RADIOTHERAPY MARKET FOR COLORECTAL CANCER, BY REGION, 2020–2027 (USD MILLION)
8.2.6 OTHER CANCERS
TABLE 53 EXTERNAL BEAM RADIOTHERAPY MARKET FOR OTHER CANCERS, BY REGION, 2020–2027 (USD MILLION)
8.3 INTERNAL BEAM RADIOTHERAPY/BRACHYTHERAPY APPLICATIONS
TABLE 54 INTERNAL BEAM RADIOTHERAPY/BRACHYTHERAPY APPLICATION MARKET, BY TYPE, 2020–2027 (USD MILLION)
TABLE 55 INTERNAL BEAM RADIOTHERAPY/BRACHYTHERAPY APPLICATION MARKET, BY REGION, 2020–2027 (USD MILLION)
8.3.1 PROSTATE CANCER
8.3.1.1 Precision of brachytherapy drives market growth
TABLE 56 INTERNAL BEAM RADIOTHERAPY/BRACHYTHERAPY MARKET FOR PROSTATE CANCER, BY REGION, 2020–2027 (USD MILLION)
8.3.2 GYNECOLOGICAL CANCER
8.3.2.1 Availability of alternatives to hinder adoption of brachytherapy
TABLE 57 INTERNAL BEAM RADIOTHERAPY/BRACHYTHERAPY MARKET FOR GYNECOLOGICAL CANCER, BY REGION, 2020–2027 (USD MILLION)
8.3.3 BREAST CANCER
8.3.3.1 Brachytherapy is a replacement for traditional whole-breast external radiation therapy
TABLE 58 INTERNAL BEAM RADIOTHERAPY/BRACHYTHERAPY MARKET FOR BREAST CANCER, BY REGION, 2020–2027 (USD MILLION)
8.3.4 CERVICAL CANCER
8.3.4.1 Combination treatment of brachytherapy and chemotherapy supports market growth
TABLE 59 INTERNAL BEAM RADIOTHERAPY/BRACHYTHERAPY MARKET FOR CERVICAL CANCER, BY REGION, 2020–2027 (USD MILLION)
8.3.5 PENILE CANCER
8.3.5.1 Interstitial brachytherapy and plesiobrachytherapy are used in penile cancer treatment
TABLE 60 INTERNAL BEAM RADIOTHERAPY/BRACHYTHERAPY MARKET FOR PENILE CANCER, BY REGION, 2020–2027 (USD MILLION)
8.3.6 OTHER CANCERS
TABLE 61 INTERNAL BEAM RADIOTHERAPY/BRACHYTHERAPY MARKET FOR OTHER CANCERS, BY REGION, 2020–2027 (USD MILLION)
9 RADIOTHERAPY MARKET, BY PROCEDURE (Page No. - 120)
9.1 INTRODUCTION
TABLE 62 GLOBAL MARKET, BY PROCEDURE, 2020–2027 (USD MILLION)
9.2 EXTERNAL BEAM RADIOTHERAPY
TABLE 63 EXTERNAL BEAM RADIOTHERAPY MARKET, BY TYPE, 2020–2027 (USD MILLION)
TABLE 64 EXTERNAL BEAM RADIOTHERAPY MARKET, BY REGION, 2020–2027 (USD MILLION)
9.3 IMAGE-GUIDED RADIOTHERAPY (IGRT)
9.3.1 IMAGE-GUIDED RADIOTHERAPY IS USED TO TREAT DEEP-SEATED TUMORS
TABLE 65 IMAGE-GUIDED RADIOTHERAPY MARKET, BY REGION, 2020–2027 (USD MILLION)
9.3.2 INTENSITY-MODULATED RADIOTHERAPY
9.3.2.1 IMRT modulates radiation intensity and conforms radiation doses in a tumor
TABLE 66 INTENSITY-MODULATED RADIOTHERAPY MARKET, BY REGION, 2020–2027 (USD MILLION)
9.3.3 3D CONFORMAL RADIOTHERAPY
9.3.3.1 Multiple beams with 3D-CRT offer dose escalation within target volume
TABLE 67 3D CONFORMAL RADIOTHERAPY MARKET, BY REGION, 2020–2027 (USD MILLION)
9.3.4 STEREOTACTIC THERAPY
9.3.4.1 Stereotactic therapy offers minimally invasive alternatives to ablation surgeries
TABLE 68 STEREOTACTIC THERAPY MARKET, BY REGION, 2020–2027 (USD MILLION)
9.3.5 PARTICLE THERAPY
9.3.5.1 Adoption of particle therapy as a primary mode of cancer treatment supports market growth
TABLE 69 PARTICLE THERAPY MARKET, BY REGION, 2020–2027 (USD MILLION)
9.4 INTERNAL BEAM RADIOTHERAPY/BRACHYTHERAPY
TABLE 70 INTERNAL BEAM RADIOTHERAPY/BRACHYTHERAPY MARKET, BY TYPE, 2020–2027 (USD MILLION)
TABLE 71 INTERNAL BEAM RADIOTHERAPY/BRACHYTHERAPY MARKET, BY REGION, 2020–2027 (USD MILLION)
9.4.1 HIGH-DOSE-RATE BRACHYTHERAPY
9.4.1.1 HDR brachytherapy delivers radiation dose through temporarily positioned applicators
TABLE 72 HIGH-DOSE-RATE BRACHYTHERAPY MARKET, BY REGION, 2020–2027 (USD MILLION)
9.4.2 LOW-DOSE-RATE BRACHYTHERAPY
9.4.2.1 Lower risk of radiation exposure to surrounding tissues drives market growth
TABLE 73 LOW-DOSE-RATE BRACHYTHERAPY MARKET, BY REGION, 2020–2027 (USD MILLION)
9.4.3 PULSED-DOSE-RATE BRACHYTHERAPY
9.4.3.1 Pulsed-dose-rate brachytherapy combines benefits of HDR and LDR brachytherapy
TABLE 74 PULSED-DOSE-RATE BRACHYTHERAPY MARKET, BY REGION, 2020–2027 (USD MILLION)
9.5 SYSTEMIC RADIOTHERAPY
9.5.1 HIGH COST OF RADIOPHARMACEUTICALS AND HIGH RISK OF RADIATION EXPOSURE LIMIT UTILIZATION OF THIS PROCEDURE
9.5.2 INTRAVENOUS RADIOTHERAPY
9.5.3 ORAL RADIOTHERAPY
9.5.4 INSTILLATION RADIOTHERAPY
10 RADIOTHERAPY MARKET, BY END USER (Page No. - 133)
10.1 INTRODUCTION
TABLE 75 GLOBAL MARKET, BY END USER, 2020–2027 (USD MILLION)
10.2 HOSPITALS
10.2.1 GROWING ADOPTION OF RADIOTHERAPY PROCEDURES DRIVES MARKET GROWTH
TABLE 76 GLOBAL MARKET FOR HOSPITALS, BY REGION, 2020–2027 (USD MILLION)
10.3 INDEPENDENT RADIOTHERAPY CENTERS
10.3.1 LOWER OPERATING COSTS AND CONVENIENCE SUPPORT MARKET GROWTH
TABLE 77 GLOBAL MARKET FOR INDEPENDENT RADIOTHERAPY CENTERS, BY REGION, 2020–2027 (USD MILLION)
11 RADIOTHERAPY MARKET, BY REGION (Page No. - 137)
11.1 INTRODUCTION
TABLE 78 GLOBAL MARKET, BY REGION, 2020–2027 (USD MILLION)
11.2 NORTH AMERICA
FIGURE 26 NORTH AMERICA: RADIOTHERAPY MARKET SNAPSHOT
TABLE 79 NORTH AMERICA: MARKET, BY COUNTRY, 2020–2027 (USD MILLION)
TABLE 80 NORTH AMERICA: MARKET, BY TECHNOLOGY, 2020–2027 (USD MILLION)
TABLE 81 NORTH AMERICA: EXTERNAL BEAM RADIOTHERAPY MARKET, BY TYPE, 2020–2027 (USD MILLION)
TABLE 82 NORTH AMERICA: LINEAR ACCELERATORS MARKET, BY TYPE, 2020–2027 (USD MILLION)
TABLE 83 NORTH AMERICA: STEREOTACTIC ADVANCED ELECTRON/COBALT-60 LINEAR ACCELERATORS MARKET, BY TYPE, 2020–2027 (USD MILLION)
TABLE 84 NORTH AMERICA: PARTICLE THERAPY SYSTEMS MARKET, BY TYPE, 2020–2027 (USD MILLION)
TABLE 85 NORTH AMERICA: INTERNAL BEAM RADIOTHERAPY/BRACHYTHERAPY MARKET, BY TYPE, 2020–2027 (USD MILLION)
TABLE 86 NORTH AMERICA: EXTERNAL BEAM RADIOTHERAPY MARKET, BY TYPE, 2020–2027 (USD MILLION)
TABLE 87 NORTH AMERICA: INTERNAL BEAM RADIOTHERAPY/BRACHYTHERAPY MARKET, BY TYPE, 2020–2027 (USD MILLION)
TABLE 88 NORTH AMERICA: EXTERNAL BEAM RADIOTHERAPY MARKET, BY APPLICATION, 2020–2027 (USD MILLION)
TABLE 89 NORTH AMERICA: INTERNAL BEAM RADIOTHERAPY/BRACHYTHERAPY MARKET, BY APPLICATION, 2020–2027 (USD MILLION)
TABLE 90 NORTH AMERICA: MARKET, BY END USER, 2020–2027 (USD MILLION)
11.2.1 US
11.2.1.1 Changes in reimbursement scenario to drive market growth
TABLE 91 US: RADIOTHERAPY MARKET, BY TECHNOLOGY, 2020–2027 (USD MILLION)
TABLE 92 US: EXTERNAL BEAM RADIOTHERAPY MARKET, BY TYPE, 2020–2027 (USD MILLION)
TABLE 93 US: LINEAR ACCELERATORS MARKET, BY TYPE, 2020–2027 (USD MILLION)
TABLE 94 US: INTERNAL BEAM RADIOTHERAPY/BRACHYTHERAPY MARKET, BY TYPE, 2020–2027 (USD MILLION)
11.2.2 CANADA
11.2.2.1 Cancer is a leading cause of death in Canada
TABLE 95 CANADA: RADIOTHERAPY MARKET, BY TECHNOLOGY, 2020–2027 (USD MILLION)
TABLE 96 CANADA: EXTERNAL BEAM RADIOTHERAPY MARKET, BY TYPE, 2020–2027 (USD MILLION)
TABLE 97 CANADA: LINEAR ACCELERATORS MARKET, BY TYPE, 2020–2027 (USD MILLION)
TABLE 98 CANADA: INTERNAL BEAM RADIOTHERAPY/BRACHYTHERAPY MARKET, BY TYPE, 2020–2027 (USD MILLION)
11.3 EUROPE
TABLE 99 EUROPE: RADIOTHERAPY MARKET, BY COUNTRY, 2020–2027 (USD MILLION)
TABLE 100 EUROPE: MARKET, BY TECHNOLOGY, 2020–2027 (USD MILLION)
TABLE 101 EUROPE: EXTERNAL BEAM RADIOTHERAPY MARKET, BY TYPE, 2020–2027 (USD MILLION)
TABLE 102 EUROPE: LINEAR ACCELERATORS MARKET, BY TYPE, 2020–2027 (USD MILLION)
TABLE 103 EUROPE: STEREOTACTIC ADVANCED ELECTRON/COBALT-60 LINEAR ACCELERATORS MARKET, BY TYPE, 2020–2027 (USD MILLION)
TABLE 104 EUROPE: PARTICLE THERAPY SYSTEMS MARKET, BY TYPE, 2020–2027 (USD MILLION)
TABLE 105 EUROPE: INTERNAL BEAM RADIOTHERAPY/BRACHYTHERAPY MARKET, BY TYPE, 2020–2027 (USD MILLION)
TABLE 106 EUROPE: EXTERNAL BEAM RADIOTHERAPY MARKET, BY TYPE, 2020–2027 (USD MILLION)
TABLE 107 EUROPE: INTERNAL BEAM RADIOTHERAPY/BRACHYTHERAPY MARKET, BY TYPE, 2020–2027 (USD MILLION)
TABLE 108 EUROPE: EXTERNAL BEAM RADIOTHERAPY MARKET, BY APPLICATION, 2020–2027 (USD MILLION)
TABLE 109 EUROPE: INTERNAL BEAM RADIOTHERAPY/BRACHYTHERAPY MARKET, BY APPLICATION, 2020–2027 (USD MILLION)
TABLE 110 EUROPE: MARKET, BY END USER, 2020–2027 (USD MILLION)
11.3.1 GERMANY
11.3.1.1 Availability of novel radiotherapy products drives market growth
TABLE 111 GERMANY: RADIOTHERAPY MARKET, BY TECHNOLOGY, 2020–2027 (USD MILLION)
TABLE 112 GERMANY: EXTERNAL BEAM RADIOTHERAPY MARKET, BY TYPE, 2020–2027 (USD MILLION)
TABLE 113 GERMANY: LINEAR ACCELERATORS MARKET, BY TYPE, 2020–2027 (USD MILLION)
TABLE 114 GERMANY: INTERNAL BEAM RADIOTHERAPY/BRACHYTHERAPY MARKET, BY TYPE, 2020–2027 (USD MILLION)
11.3.2 FRANCE
11.3.2.1 High purchasing & maintenance costs of advanced radiotherapy systems limit market growth
TABLE 115 FRANCE: RADIOTHERAPY MARKET, BY TECHNOLOGY, 2020–2027 (USD MILLION)
TABLE 116 FRANCE: EXTERNAL BEAM RADIOTHERAPY MARKET, BY TYPE, 2020–2027 (USD MILLION)
TABLE 117 FRANCE: LINEAR ACCELERATORS MARKET, BY TYPE, 2020–2027 (USD MILLION)
TABLE 118 FRANCE: INTERNAL BEAM RADIOTHERAPY/BRACHYTHERAPY MARKET, BY TYPE, 2020–2027 (USD MILLION)
11.3.3 UK
11.3.3.1 High healthcare expenditure drives market growth
TABLE 119 UK: RADIOTHERAPY MARKET, BY TECHNOLOGY, 2020–2027 (USD MILLION)
TABLE 120 UK: EXTERNAL BEAM RADIOTHERAPY MARKET, BY TYPE, 2020–2027 (USD MILLION)
TABLE 121 UK: LINEAR ACCELERATORS MARKET, BY TYPE, 2020–2027 (USD MILLION)
TABLE 122 UK: INTERNAL BEAM RADIOTHERAPY/BRACHYTHERAPY MARKET, BY TYPE, 2020–2027 (USD MILLION)
11.3.4 SPAIN
11.3.4.1 Growing research activities on cancer care support market growth
TABLE 123 SPAIN: RADIOTHERAPY MARKET, BY TECHNOLOGY, 2020–2027 (USD MILLION)
TABLE 124 SPAIN: EXTERNAL BEAM RADIOTHERAPY MARKET, BY TYPE, 2020–2027 (USD MILLION)
TABLE 125 SPAIN: LINEAR ACCELERATORS MARKET, BY TYPE, 2020–2027 (USD MILLION)
TABLE 126 SPAIN: INTERNAL BEAM RADIOTHERAPY/BRACHYTHERAPY MARKET, BY TYPE, 2020–2027 (USD MILLION)
11.3.5 ITALY
11.3.5.1 High number of oncology-specific clinical trials & studies support market growth
TABLE 127 ITALY: RADIOTHERAPY MARKET, BY TECHNOLOGY, 2020–2027 (USD MILLION)
TABLE 128 ITALY: EXTERNAL BEAM RADIOTHERAPY MARKET, BY TYPE, 2020–2027 (USD MILLION)
TABLE 129 ITALY: LINEAR ACCELERATORS MARKET, BY TYPE, 2020–2027 (USD MILLION)
TABLE 130 ITALY: INTERNAL BEAM RADIOTHERAPY/BRACHYTHERAPY MARKET, BY TYPE, 2020–2027 (USD MILLION)
11.3.6 REST OF EUROPE
TABLE 131 ROE: RADIOTHERAPY MARKET, BY TECHNOLOGY, 2020–2027 (USD MILLION)
TABLE 132 ROE: EXTERNAL BEAM RADIOTHERAPY MARKET, BY TYPE, 2020–2027 (USD MILLION)
TABLE 133 ROE: LINEAR ACCELERATORS MARKET, BY TYPE, 2020–2027 (USD MILLION)
TABLE 134 ROE: INTERNAL BEAM RADIOTHERAPY/BRACHYTHERAPY MARKET, BY TYPE, 2020–2027 (USD MILLION)
11.4 ASIA PACIFIC
FIGURE 27 ASIA PACIFIC: MARKET SNAPSHOT
TABLE 135 ASIA PACIFIC: MARKET, BY COUNTRY, 2020–2027 (USD MILLION)
TABLE 136 ASIA PACIFIC: RADIOTHERAPY MARKET, BY TECHNOLOGY, 2020–2027 (USD MILLION)
TABLE 137 ASIA PACIFIC: EXTERNAL BEAM RADIOTHERAPY MARKET, BY TYPE, 2020–2027 (USD MILLION)
TABLE 138 ASIA PACIFIC: LINEAR ACCELERATORS MARKET, BY TYPE, 2020–2027 (USD MILLION)
TABLE 139 ASIA PACIFIC: STEREOTACTIC ADVANCED ELECTRON/COBALT-60 LINEAR ACCELERATORS MARKET, BY TYPE, 2020–2027 (USD MILLION)
TABLE 140 ASIA PACIFIC: PARTICLE THERAPY SYSTEMS MARKET, BY TYPE, 2020–2027 (USD MILLION)
TABLE 141 ASIA PACIFIC: INTERNAL BEAM RADIOTHERAPY/BRACHYTHERAPY MARKET, BY TYPE, 2020–2027 (USD MILLION)
TABLE 142 ASIA PACIFIC: EXTERNAL BEAM RADIOTHERAPY MARKET, BY TYPE, 2020–2027 (USD MILLION)
TABLE 143 ASIA PACIFIC: INTERNAL BEAM RADIOTHERAPY/BRACHYTHERAPY MARKET, BY TYPE, 2020–2027 (USD MILLION)
TABLE 144 ASIA PACIFIC: EXTERNAL BEAM RADIOTHERAPY MARKET, BY APPLICATION, 2020–2027 (USD MILLION)
TABLE 145 ASIA PACIFIC: INTERNAL BEAM RADIOTHERAPY/BRACHYTHERAPY MARKET, BY APPLICATION, 2020–2027 (USD MILLION)
TABLE 146 ASIA PACIFIC: MARKET, BY END USER, 2020–2027 (USD MILLION)
11.4.1 JAPAN
11.4.1.1 Rising geriatric population and incidence of cancer drive market
TABLE 147 JAPAN: RADIOTHERAPY MARKET, BY TECHNOLOGY, 2020–2027 (USD MILLION)
TABLE 148 JAPAN: EXTERNAL BEAM RADIOTHERAPY MARKET, BY TYPE, 2020–2027 (USD MILLION)
TABLE 149 JAPAN: LINEAR ACCELERATORS MARKET, BY TYPE, 2020–2027 (USD MILLION)
TABLE 150 JAPAN: INTERNAL BEAM RADIOTHERAPY/BRACHYTHERAPY MARKET, BY TYPE, 2020–2027 (USD MILLION)
11.4.2 CHINA
11.4.2.1 Growing partnerships among market players to support growth
TABLE 151 CHINA: RADIOTHERAPY MARKET, BY TECHNOLOGY, 2020–2027 (USD MILLION)
TABLE 152 CHINA: EXTERNAL BEAM RADIOTHERAPY MARKET, BY TYPE, 2020–2027 (USD MILLION)
TABLE 153 CHINA: LINEAR ACCELERATORS MARKET, BY TYPE, 2020–2027 (USD MILLION)
TABLE 154 CHINA: INTERNAL BEAM RADIOTHERAPY/BRACHYTHERAPY MARKET, BY TYPE, 2020–2027 (USD MILLION)
11.4.3 INDIA
11.4.3.1 High need for radiotherapy systems to provide market opportunities
TABLE 155 INDIA: RADIOTHERAPY MARKET, BY TECHNOLOGY, 2020–2027 (USD MILLION)
TABLE 156 INDIA: EXTERNAL BEAM RADIOTHERAPY MARKET, BY TYPE, 2020–2027 (USD MILLION)
TABLE 157 INDIA: LINEAR ACCELERATORS MARKET, BY TYPE, 2020–2027 (USD MILLION)
TABLE 158 INDIA: INTERNAL BEAM RADIOTHERAPY/BRACHYTHERAPY MARKET, BY TYPE, 2020–2027 (USD MILLION)
11.4.4 SOUTH KOREA
11.4.4.1 Increasing incidence of cancer to support market
TABLE 159 SOUTH KOREA: RADIOTHERAPY MARKET, BY TECHNOLOGY, 2020–2027 (USD MILLION)
TABLE 160 SOUTH KOREA: EXTERNAL BEAM RADIOTHERAPY MARKET, BY TYPE, 2020–2027 (USD MILLION)
TABLE 161 SOUTH KOREA: LINEAR ACCELERATORS MARKET, BY TYPE, 2020–2027 (USD MILLION)
TABLE 162 SOUTH KOREA: INTERNAL BEAM RADIOTHERAPY/BRACHYTHERAPY MARKET, BY TYPE, 2020–2027 (USD MILLION)
11.4.5 AUSTRALIA
11.4.5.1 Availability of funding for cancer care & research to drive growth
TABLE 163 AUSTRALIA: RADIOTHERAPY MARKET, BY TECHNOLOGY, 2020–2027 (USD MILLION)
TABLE 164 AUSTRALIA: EXTERNAL BEAM RADIOTHERAPY MARKET, BY TYPE, 2020–2027 (USD MILLION)
TABLE 165 AUSTRALIA: LINEAR ACCELERATORS MARKET, BY TYPE, 2020–2027 (USD MILLION)
TABLE 166 AUSTRALIA: INTERNAL BEAM RADIOTHERAPY/BRACHYTHERAPY MARKET, BY TYPE, 2020–2027 (USD MILLION)
11.4.6 REST OF ASIA PACIFIC
TABLE 167 ROAPAC: RADIOTHERAPY MARKET, BY TECHNOLOGY, 2020–2027 (USD MILLION)
TABLE 168 ROAPAC: EXTERNAL BEAM RADIOTHERAPY MARKET, BY TYPE, 2020–2027 (USD MILLION)
TABLE 169 ROAPAC: LINEAR ACCELERATORS MARKET, BY TYPE, 2020–2027 (USD MILLION)
TABLE 170 ROAPAC: INTERNAL BEAM RADIOTHERAPY/BRACHYTHERAPY MARKET, BY TYPE, 2020–2027 (USD MILLION)
11.5 LATIN AMERICA
TABLE 171 LATIN AMERICA: RADIOTHERAPY MARKET, BY COUNTRY, 2020–2027 (USD MILLION)
TABLE 172 LATIN AMERICA: MARKET, BY TECHNOLOGY, 2020–2027 (USD MILLION)
TABLE 173 LATIN AMERICA: EXTERNAL BEAM RADIOTHERAPY MARKET, BY TYPE, 2020–2027 (USD MILLION)
TABLE 174 LATIN AMERICA: LINEAR ACCELERATORS MARKET, BY TYPE, 2020–2027 (USD MILLION)
TABLE 175 LATIN AMERICA: STEREOTACTIC ADVANCED ELECTRON/COBALT-60 LINEAR ACCELERATORS MARKET, BY TYPE, 2020–2027 (USD MILLION)
TABLE 176 LATIN AMERICA: PARTICLE THERAPY SYSTEMS MARKET, BY TYPE, 2020–2027 (USD MILLION)
TABLE 177 LATIN AMERICA: INTERNAL BEAM RADIOTHERAPY/BRACHYTHERAPY MARKET, BY TYPE, 2020–2027 (USD MILLION)
TABLE 178 LATIN AMERICA: EXTERNAL BEAM RADIOTHERAPY MARKET, BY TYPE, 2020–2027 (USD MILLION)
TABLE 179 LATIN AMERICA: INTERNAL BEAM RADIOTHERAPY/BRACHYTHERAPY MARKET, BY TYPE, 2020–2027 (USD MILLION)
TABLE 180 LATIN AMERICA: EXTERNAL BEAM RADIOTHERAPY MARKET, BY APPLICATION, 2020–2027 (USD MILLION)
TABLE 181 LATIN AMERICA: INTERNAL BEAM RADIOTHERAPY/BRACHYTHERAPY MARKET, BY APPLICATION, 2020–2027 (USD MILLION)
TABLE 182 LATIN AMERICA: MARKET, BY END USER, 2020–2027 (USD MILLION)
11.5.1 BRAZIL
11.5.1.1 Restricted affordability & access to radiotherapy treatment challenges market growth
TABLE 183 BRAZIL: RADIOTHERAPY MARKET, BY TECHNOLOGY, 2020–2027 (USD MILLION)
TABLE 184 BRAZIL: EXTERNAL BEAM RADIOTHERAPY MARKET, BY TYPE, 2020–2027 (USD MILLION)
TABLE 185 BRAZIL: LINEAR ACCELERATORS MARKET, BY TYPE, 2020–2027 (USD MILLION)
TABLE 186 BRAZIL: INTERNAL BEAM RADIOTHERAPY/BRACHYTHERAPY MARKET, BY TYPE, 2020–2027 (USD MILLION)
11.5.2 MEXICO
11.5.2.1 Rising target population drives market growth in Mexico
TABLE 187 MEXICO: RADIOTHERAPY MARKET, BY TECHNOLOGY, 2020–2027 (USD MILLION)
TABLE 188 MEXICO: EXTERNAL BEAM RADIOTHERAPY MARKET, BY TYPE, 2020–2027 (USD MILLION)
TABLE 189 MEXICO: LINEAR ACCELERATORS MARKET, BY TYPE, 2020–2027 (USD MILLION)
TABLE 190 MEXICO: INTERNAL BEAM RADIOTHERAPY/BRACHYTHERAPY MARKET, BY TYPE, 2020–2027 (USD MILLION)
11.5.3 REST OF LATIN AMERICA
TABLE 191 ROLATAM: RADIOTHERAPY MARKET, BY TECHNOLOGY, 2020–2027 (USD MILLION)
TABLE 192 ROLATAM: EXTERNAL BEAM RADIOTHERAPY MARKET, BY TYPE, 2020–2027 (USD MILLION)
TABLE 193 ROLATAM: LINEAR ACCELERATORS MARKET, BY TYPE, 2020–2027 (USD MILLION)
TABLE 194 ROLATAM: INTERNAL BEAM RADIOTHERAPY/BRACHYTHERAPY MARKET, BY TYPE, 2020–2027 (USD MILLION)
11.6 MIDDLE EAST & AFRICA
11.6.1 IMPROVING HEALTHCARE INFRASTRUCTURE AND INCREASING PUBLIC-PRIVATE INVESTMENTS TO DRIVE MARKET GROWTH
TABLE 195 MEA: RADIOTHERAPY MARKET, BY TECHNOLOGY, 2020–2027 (USD MILLION)
TABLE 196 MEA: EXTERNAL BEAM RADIOTHERAPY MARKET, BY TYPE, 2020–2027 (USD MILLION)
TABLE 197 MEA: LINEAR ACCELERATORS MARKET, BY TYPE, 2020–2027 (USD MILLION)
TABLE 198 MEA: STEREOTACTIC ADVANCED ELECTRON/COBALT-60 LINEAR ACCELERATORS MARKET, BY TYPE, 2020–2027 (USD MILLION)
TABLE 199 MEA: PARTICLE THERAPY SYSTEMS MARKET, BY TYPE, 2020–2027 (USD MILLION)
TABLE 200 MEA: INTERNAL BEAM RADIOTHERAPY/BRACHYTHERAPY MARKET, BY TYPE, 2020–2027 (USD MILLION)
TABLE 201 MEA: EXTERNAL BEAM RADIOTHERAPY MARKET, BY TYPE, 2020–2027 (USD MILLION)
TABLE 202 MEA: INTERNAL BEAM RADIOTHERAPY/BRACHYTHERAPY MARKET, BY TYPE, 2020–2027 (USD MILLION)
TABLE 203 MEA: EXTERNAL BEAM RADIOTHERAPY MARKET, BY APPLICATION, 2020–2027 (USD MILLION)
TABLE 204 MEA: INTERNAL BEAM RADIOTHERAPY/BRACHYTHERAPY MARKET, BY APPLICATION, 2020–2027 (USD MILLION)
TABLE 205 MEA: MARKET, BY END USER, 2020–2027 (USD MILLION)
12 COMPETITIVE LANDSCAPE (Page No. - 201)
12.1 OVERVIEW
12.2 KEY PLAYER STRATEGIES
FIGURE 28 KEY DEVELOPMENTS IN THE RADIOTHERAPY MARKET (2019 TO 2022)
12.3 REVENUE SHARE ANALYSIS
FIGURE 29 REVENUE SHARE ANALYSIS OF THE TOP FIVE PLAYERS IN THE GLOBAL MARKET (2018–2021)
12.4 MARKET SHARE ANALYSIS: GLOBAL MARKET, BY KEY PLAYER (2021)
FIGURE 30 GLOBAL MARKET SHARE BY KEY PLAYER, 2021
TABLE 206 GLOBAL MARKET: DEGREE OF COMPETITION
12.5 COMPANY EVALUATION QUADRANT FOR MAJOR PLAYERS (AS OF 2021)
12.5.1 STARS
12.5.2 EMERGING LEADERS
12.5.3 PERVASIVE PLAYERS
12.5.4 PARTICIPANTS
FIGURE 31 GLOBAL MARKET: COMPETITIVE LEADERSHIP MAPPING, 2021
12.6 START-UP/SMES EVALUATION QUADRANT (AS OF 2021)
12.6.1 PROGRESSIVE COMPANIES
12.6.2 RESPONSIVE COMPANIES
12.6.3 DYNAMIC COMPANIES
12.6.4 STARTING BLOCKS
FIGURE 32 GLOBAL MARKET: COMPETITIVE LEADERSHIP MAPPING (SMES/START-UPS)
12.7 COMPETITIVE BENCHMARKING
TABLE 207 OVERALL FOOTPRINT ANALYSIS OF COMPANIES IN THE GLOBAL MARKET
TABLE 208 PRODUCT FOOTPRINT ANALYSIS OF THE COMPANIES IN THE GLOBAL MARKET
TABLE 209 REGIONAL FOOTPRINT ANALYSIS OF THE COMPANIES IN THE GLOBAL MARKET
12.8 COMPETITIVE SCENARIO (2019–2022)
12.8.1 PRODUCT LAUNCHES & APPROVALS
12.8.2 DEALS
12.8.3 OTHER DEVELOPMENTS
13 COMPANY PROFILES (Page No. - 216)
(Business overview, Products offered, Recent developments & MnM View)*
13.1 KEY PLAYERS
13.1.1 SIEMENS HEALTHINEERS AG (VARIAN MEDICAL SYSTEMS, INC.)
TABLE 210 SIEMENS HEALTHINEERS AG: BUSINESS OVERVIEW
FIGURE 33 SIEMENS HEALTHINEERS AG: COMPANY SNAPSHOT (2021)
13.1.2 ELEKTA
TABLE 211 ELEKTA: BUSINESS OVERVIEW
FIGURE 34 ELEKTA: COMPANY SNAPSHOT (2021)
13.1.3 ACCURAY INCORPORATED
TABLE 212 ACCURAY INCORPORATED: BUSINESS OVERVIEW
FIGURE 35 ACCURAY INCORPORATED: COMPANY SNAPSHOT (2021)
13.1.4 IBA WORLDWIDE
TABLE 213 IBA: BUSINESS OVERVIEW
FIGURE 36 IBA: COMPANY SNAPSHOT (2021)
13.1.5 VIEWRAY TECHNOLOGIES, INC.
TABLE 214 VIEWRAY TECHNOLOGIES, INC.: BUSINESS OVERVIEW
FIGURE 37 VIEWRAY TECHNOLOGIES, INC.: COMPANY SNAPSHOT
13.1.6 BD
TABLE 215 BD: BUSINESS OVERVIEW
FIGURE 38 BD: COMPANY SNAPSHOT (2021)
13.1.7 BEBIG MEDICAL
TABLE 216 BEBIG MEDICAL: BUSINESS OVERVIEW
13.1.8 HITACHI LTD.
TABLE 217 HITACHI LTD.: BUSINESS OVERVIEW
FIGURE 39 HITACHI LTD.: COMPANY SNAPSHOT (2021)
13.1.9 ICAD, INC.
TABLE 218 ICAD, INC.: BUSINESS OVERVIEW
FIGURE 40 ICAD, INC.: COMPANY SNAPSHOT (2021)
13.1.10 INTRAOP MEDICAL, INC.
TABLE 219 INTRAOP MEDICAL, INC.: BUSINESS OVERVIEW
13.1.11 ISORAY, INC.
TABLE 220 ISORAY, INC.: BUSINESS OVERVIEW
FIGURE 41 ISORAY, INC.: COMPANY SNAPSHOT (2021)
13.1.12 MEVION MEDICAL SYSTEMS
TABLE 221 MEVION MEDICAL SYSTEMS: BUSINESS OVERVIEW
13.1.13 OPTIVUS PROTON THERAPY, INC.
TABLE 222 OPTIVUS PROTON THERAPY: BUSINESS OVERVIEW
13.1.14 PANACEA MEDICAL TECHNOLOGIES PVT. LTD.
TABLE 223 PANACEA MEDICAL TECHNOLOGIES PVT. LTD.: BUSINESS OVERVIEW
13.1.15 P-CURE
TABLE 224 P-CURE: BUSINESS OVERVIEW
13.1.16 PROVISION HEALTHCARE
TABLE 225 PROVISION HEALTHCARE: BUSINESS OVERVIEW
13.1.17 SENSUS HEALTHCARE
TABLE 226 SENSUS HEALTHCARE: BUSINESS OVERVIEW
FIGURE 42 SENSUS HEALTHCARE: COMPANY SNAPSHOT (2021)
13.1.18 SUMITOMO HEAVY INDUSTRY LTD.
TABLE 227 SUMITOMO HEAVY INDUSTRY LTD: BUSINESS OVERVIEW
FIGURE 43 SUMITOMO HEAVY INDUSTRIES: COMPANY SNAPSHOT (2021)
13.1.19 THERAGENICS
TABLE 228 THERAGENICS CORPORATION: BUSINESS OVERVIEW
13.1.20 ZEISS GROUP
TABLE 229 ZEISS GROUP: BUSINESS OVERVIEW
FIGURE 44 ZEISS GROUP: COMPANY SNAPSHOT
*Details on Business overview, Products offered, Recent developments & MnM View might not be captured in case of unlisted companies.
13.2 OTHER PLAYERS
13.2.1 ISOAID
13.2.2 MAGNETTX ONCOLOGY SOLUTIONS LTD.
13.2.3 PROTOM INTERNATIONAL
13.2.4 REFLEXION
13.2.5 S.I.T. SORDINA IORT TECHNOLOGIES S.P.A.
14 APPENDIX (Page No. - 283)
14.1 DISCUSSION GUIDE
14.2 KNOWLEDGESTORE: MARKETSANDMARKETS’ SUBSCRIPTION PORTAL
14.3 AVAILABLE CUSTOMIZATIONS
14.4 RELATED REPORTS
14.5 AUTHOR DETAILS
This study involved the extensive use of both primary and secondary sources. The research process involved the study of various factors affecting the industry to identify the segmentation types, industry trends, key players, competitive landscape, fundamental market dynamics, and key player strategies.
Secondary Research
The secondary research process involves the widespread use of secondary sources, directories, databases (such as Bloomberg, Factiva, and D&B), white papers, annual reports, companies house documents, investor presentations, and SEC filings of companies. Secondary research was used to identify and collect information useful for the extensive, technical, market-oriented, and commercial study of the radiotherapy market. A database of the key industry leaders was also prepared using secondary research.
Primary Research
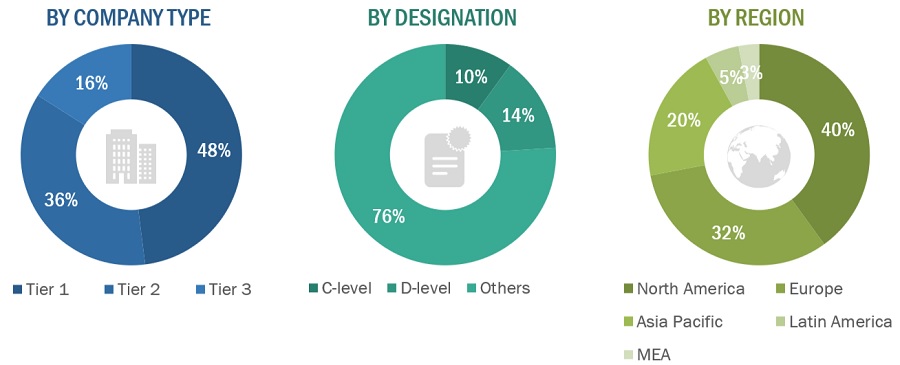
Primary research was conducted after acquiring extensive knowledge about the global radiotherapy market scenario through secondary research. Primary interviews were conducted with market experts from both the demand-side (such as CROs, hospitals, transplant centers, healthcare service providers, commercial service providers, academia, and research organizations) and supply-side respondents (such as presidents, CEOs, vice presidents, directors, general managers, heads of business units, and senior managers) across five major geographies, namely, North America, Europe, the Asia Pacific, Latin America, and the Middle East, and Africa. Approximately 60% of the primary interviews were conducted with stakeholders from the demand side, while those from the supply side accounted for the remaining 40%. Primary data for this report was collected through questionnaires, emails, and telephonic interviews.
A breakdown of the primary respondents is provided below:
To know about the assumptions considered for the study, download the pdf brochure
Market Estimation Methodology
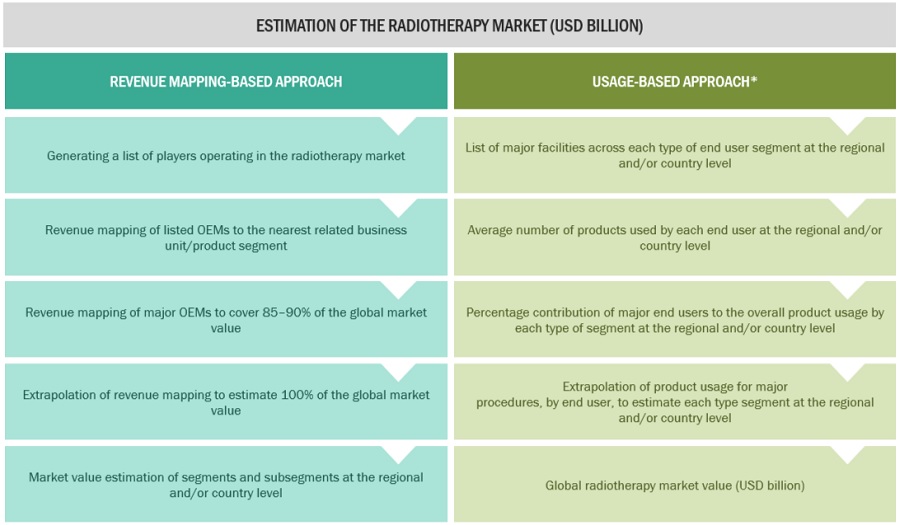
For the global market value, annual revenues were calculated based on the revenue mapping of major product manufacturers and OEMs active in the global radiotherapy market. All the major product manufacturers were identified at the global and/or country/regional level. Revenue mapping for the respective business segments/sub-segments was done for the major players (who contribute at least 85–90% of the market share at the global level). Also, the global radiotherapy market was split into various segments and sub-segments based on:
- A list of major players operating in the radiotherapy market at the regional and/or country level
- Product mapping of various manufacturers for each type of radiotherapy product at the regional and/or country level
- Mapping of annual revenue generated by listed major players from radiotherapy segments (or the nearest reported business unit/product category)
- Revenue mapping of major players to cover at least 85–90% of the global market share as of 2021
- Extrapolation of the revenue mapping of the listed major players to derive the global market value of the respective segments/subsegments
- Summation of the market value of all segments/subsegments to arrive at the global radiotherapy market
The above-mentioned data was consolidated and added with detailed inputs and analysis from MarketsandMarkets and presented in this report.
To know about the assumptions considered for the study, Request for Free Sample Report
Data Triangulation:
After deriving the overall Radiotherapy market value data from the market size estimation process, the total market value data was split into several segments and subsegments. To complete the overall market engineering process and arrive at the exact statistics for all the segments, data triangulation and market breakdown procedures were employed wherever applicable. The data was triangulated by studying various qualitative and quantitative variables as well as by analyzing regional trends for both the demand- and supply-side macro indicators.
Report Objectives:
- To define, describe, and forecast the radiotherapy market based on type, technology, procedure, application, end user, and region
- To provide detailed information regarding the major factors influencing the growth of the market (such as drivers, restraints, opportunities, and challenges)
- To strategically analyze the micromarkets with respect to individual growth trends, prospects, and contributions to the total radiotherapy market
- To analyze the opportunities in the market for stakeholders and provide details of the competitive landscape for market leaders
- To profile the key market players and comprehensively analyze their market shares and core competencies
- To forecast the revenue of the market segments with respect to five main regions, namely, North America (the US and Canada), Europe (Germany, France, the UK, Italy, Spain, and the Rest of Europe), the Asia Pacific (China, Japan, India, South Korea, Australia, and the Rest of Asia Pacific), Latin America (Brazil, Mexico, and the Rest of Latin America), and the Middle East and Africa.
- To track and analyze competitive developments such as new product launches; agreements, and partnerships; mergers & acquisitions; and research & development activities in the radiotherapy market
Available Customizations
With the given market data, MarketsandMarkets offers customizations as per the company’s specific needs. The following customization options are available for the present global radiotherapy market report:
Product Analysis
- Product matrix, which gives a detailed comparison of the product portfolios of the top five companies
Company Information
- Detailed analysis and profiling of additional market players (up to 5)
Geographic Analysis
- Further breakdown of the Rest of Europe radiotherapy market into Belgium, Austria, the Czech Republic, Denmark, Greece, Poland, and Russia, among other
- Further breakdown of the Rest of Asia Pacific radiotherapy market into New Zealand, Vietnam, the Philippines, Singapore, Malaysia, Thailand, and Indonesia among other
- Further breakdown of the Latin American radiotherapy market into Argentina, Chile, Peru, and Colombia, among other
Growth opportunities and latent adjacency in Radiotherapy Market