
Real World Evidence Solutions Market: Growth, Size, Share, and Trends

Real World Evidence Solutions Market by Component (Datasets (Claims, Clinical, Pharmacy, Genomics), Application (Drug/Device Development (Cancer, Cardio, Neuro), Reimbursement), End User (Pharma, Medtech, Payers, Provider), Region - Global Forecast to 2030


OVERVIEW
Source: Secondary Research, Interviews with Experts, MarketsandMarkets Analysis
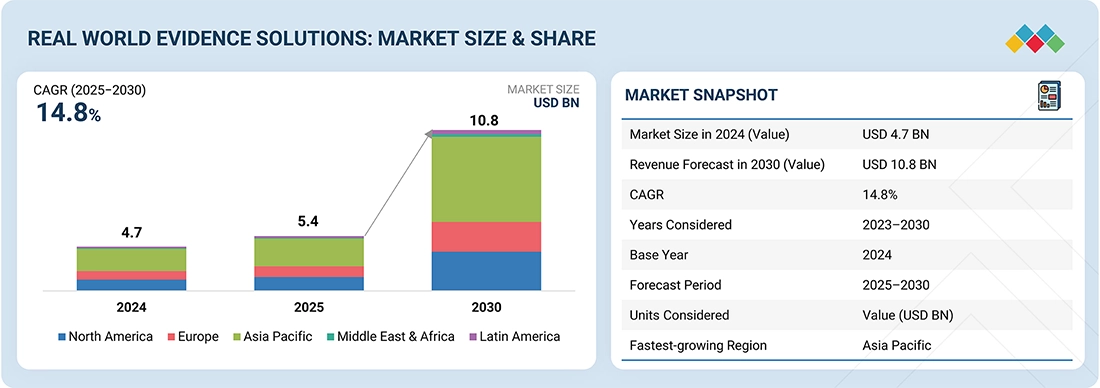
The global Real World Evidence Solutions Market is experiencing robust growth, fueled by regulatory acceptance, the push for value-based care, and the rapid expansion of digital health ecosystems. The global Real World Evidence (RWE) Solutions Market was valued at USD 4.7 billion in 2024 and is projected to reach nearly USD 10.8 billion by 2030, growing at a CAGR of over 14.8% during the forecast period. Growth is driven by the widespread adoption of electronic health records, increased integration of claims, genomics, and wearable data, along with rising pharmaceutical R&D investments. While global leaders such as IQVIA, Optum, Parexel, and Medidata (Dassault Systèmes) dominate with scale and diverse offerings, emerging competitors such as Aetion, Flatiron Health, and TriNetX are reshaping the competitive landscape. The future will be influenced not only by regulatory use cases and faster clinical development but also by expanding applications in market access, pharmacovigilance, precision medicine, and value-based contracting, establishing RWE as a key element of next-generation healthcare decision-making.
KEY TAKEAWAYS
- The Asia Pacific is expected to grow at the fastest rate, at 16.0% CAGR, during the forecast period.
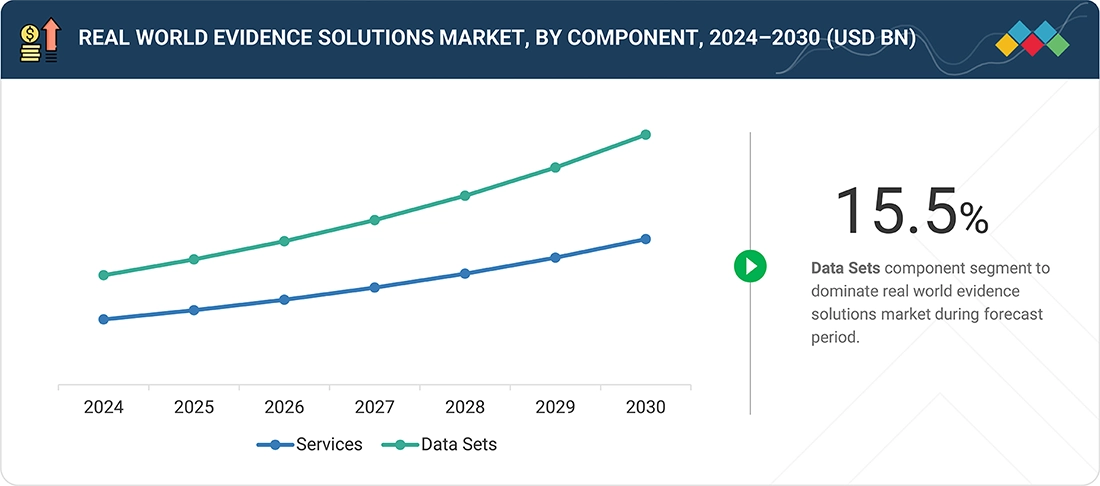
- By component type, the data sets segment is expected to register the highest CAGR of 15.5% from 2025 - 2030.
- By application, market access and reimbursement/coverage decision-making has witnessed significant growth in the market
- By revenue model, subscription model dominates the market with 41.3% revenue share in 2024.
- By deployment, cloud-based solutions are expected to witness the fastest growth during the forecast period.
- By end user, the MedTech companies is expected to register the highest CAGR from 2025 - 2030.
- Optum, Inc, Parexel, Medidata (Dassault Systèmes) and IQVIA were identified as some of the star players in the RWE market (global), given their strong market share and product footprint.
- HEALTHVERITY, OM1, and Open Health, among others, have distinguished themselves among startups and SMEs by securing strong footholds in specialized niche areas, underscoring their potential as emerging market leaders
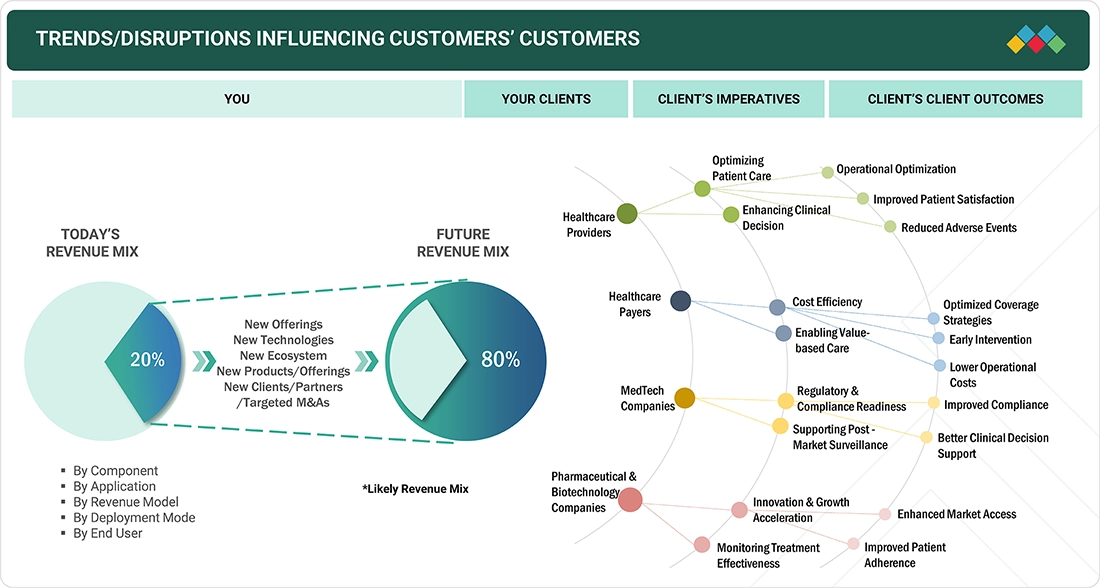
TRENDS & DISRUPTIONS IMPACTING CUSTOMERS' CUSTOMERS
The real-world evidence (RWE) solutions market is being reshaped by key trends that are disrupting traditional healthcare models and leaving a lasting impact. Regulatory agencies such as the FDA and EMA are formally adopting RWE for approvals and safety monitoring, challenging conventional trial methods and increasing demand for validated, regulatory-grade platforms. The global shift toward value-based healthcare is shifting decision-making authority from pharma to payers, disrupting evidence strategies and boosting reliance on RWE for cost-effectiveness and reimbursement negotiations. At the same time, the rapid growth of data sources from EHRs and claims to genomics and wearables—is causing disruption through fragmentation and quality issues, prompting wider adoption of AI/ML analytics and interoperability frameworks. Market consolidation is also changing competition, as leaders like IQVIA, Optum, and Parexel expand through acquisitions and partnerships with innovators such as Aetion, TriNetX, and Verantos, reducing fragmentation and creating integrated ecosystems. Lastly, the rise of patient-centric and digital health models is transforming care delivery by bringing evidence generation closer to the point of care, with RWE playing an increasingly vital role in precision medicine, real-time decision-making, and long-term patient monitoring.
Source: Secondary Research, Interviews with Experts, MarketsandMarkets Analysis
MARKET DYNAMICS
Level
-
Rising geriatric population and subsequent increase in prevalence of chronic diseases

Level
-
Reluctance of medical practitioners and researchers to rely on real world studies

Level
-
Growth opportunities in emerging countries

Level
-
Lack of universally accepted methodology standards and data processing infrastructure

Source: Secondary Research, Interviews with Experts, MarketsandMarkets Analysis
Driver: Rising geriatric population and subsequent increase in prevalence of chronic diseases
The rising geriatric population and the subsequent increase in chronic diseases are likely to affect healthcare systems in many countries. The impact of an aging population is even more evident with the growing pressure on government budgets, the decreasing number of healthcare workers in various regions, and the high rates of chronic illnesses. According to the WHO, by 2050, chronic diseases—including cardiovascular conditions, cancer, diabetes, and respiratory illnesses—are expected to cause 86% of the estimated 90 million deaths each year. Older adults are more vulnerable to long-term and complex health issues, so healthcare systems must develop effective, cost-efficient, and personalized treatment strategies. RWE solutions are essential in meeting these challenges by using real-world data to gain insights into treatment outcomes, medication adherence, and patient care pathways outside controlled clinical trial environments. Consequently, the adoption of RWE solutions is on the rise worldwide.
Restraint: Reluctance of medical practitioners and researchers to rely on real world studies
Despite the rapid adoption of real-world evidence across various applications, some stakeholders remain hesitant to rely on real-world studies. Although payers have begun using RWE, they still prefer randomized clinical trials (RCTs) over external observational data for making drug coverage decisions. The primary reason is the existence of multiple standards and methods for analyzing clinical experience evidence. Additionally, the processes and evidence used in pharmaceutical coverage decisions vary significantly among US health plan payers. These differences can influence reimbursement, patient access, and healthcare outcomes during the pharmaceutical technology assessment (PTA) process. Therefore, stakeholders are cautious about using evidence that lacks a standardized data generation procedure.
Opportunity: Growth opportunities in emerging economies
Emerging economies such as India, China, and Southeast Asian nations are poised to offer numerous growth opportunities for the RWE solutions market during the forecast period. This is mainly due to more relaxed regulatory policies, the rising number of pharmaceutical firms, a large patient population generating substantial RWD, increasing healthcare spending, swiftly advancing healthcare infrastructure, availability of a skilled R&D workforce, and lower clinical trial costs in these regions. In November 2023, JMDC, a prominent Japanese health big data company, partnered with Aetion to improve healthcare outcomes globally. This collaboration focused on leveraging real-world data (RWD) and advanced evidence-generation technology to enhance patient care worldwide.
Challenge: Lack of universally accepted methodology standards and data processing infrastructure
The absence of universally accepted standards or principles for designing, conducting, analyzing, and reporting RWE poses a significant challenge to this market. This lack of consensus has resulted in RWE often being regarded as insufficiently high quality to contribute to the evidence base used to compare treatment options. As a result, the potential value of the information is diminished, which in turn decreases the motivation to generate it. Additionally, this situation discourages major stakeholders from adopting RWE solutions. Data derived from real-world conditions frequently lack validity and face issues such as inconsistency, concerns about robustness, limited access to data, and insufficient investigator expertise, all of which hinder the development of accurate evidence. Healthcare involves a wide range of public and private data collection systems, including health surveys, administrative enrolment and billing records, and medical records used by hospitals, CHCs, physicians, and health plans.
Real World Evidence Solutions Market: COMMERCIAL USE CASES ACROSS INDUSTRIES
| COMPANY | USE CASE DESCRIPTION | BENEFITS |
|---|---|---|
 |
Global RWE analytics integrating claims, EHR, and registry data for pharma & payers | Enables value-based contracting, supports market access, and reduces trial costs |
 |
Use of claims + EHR data for outcomes research and payer decision support | Enhances reimbursement decisions, supports cost-effectiveness analysis, and improves population health insights |
 |
Oncology-focused RWE platform integrating EHR data from cancer clinics into research pipelines | Accelerates oncology drug development, supports label expansions, and improves trial feasibility |
|
|
Regulatory-grade evidence generation platform used by FDA, EMA, and NICE | Supports faster regulatory approvals, ensures methodological rigor, and strengthens payer confidence |
Logos and trademarks shown above are the property of their respective owners. Their use here is for informational and illustrative purposes only.
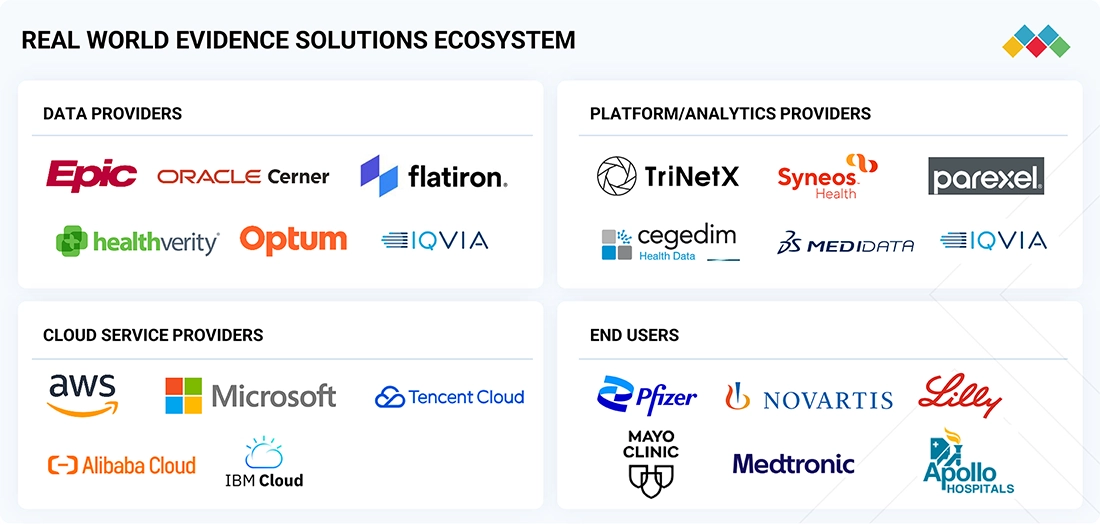
MARKET ECOSYSTEM
The real-world evidence (RWE) solutions market relies on a layered ecosystem made up of data providers, analytics platforms, end users, and regulators. Leading vendors include IQVIA, Optum, Flatiron Health, Aetion, and TriNetX, while specialized companies like Verantos, HealthVerity, and COTA are advancing niche adoption in oncology and high-validity studies. Data distribution networks are based on EHR vendors, claims aggregators, cloud infrastructure providers, and interoperability platforms that support multi-source integration across regions. End-users include pharmaceutical and biotech firms, payers, health systems, and CROs, all utilizing RWE for regulatory, commercial, and clinical goals. Regulators such as the FDA, EMA, PMDA, and NMPA are key players, while insurers and HTA organizations are growing in influence for reimbursement and value-based care decisions. This interconnected ecosystem maintains RWE adoption but also introduces competitive pressures and pricing challenges as vendors focus on data quality, compliance, and scalability.
Logos and trademarks shown above are the property of their respective owners. Their use here is for informational and illustrative purposes only.
MARKET SEGMENTS
Source: Secondary Research, Interviews with Experts, MarketsandMarkets Analysis
Real world evidence solutions market, By Deployment
By deployment mode, the real-world evidence (RWE) solutions market is segmented into on-premises, cloud-based, and hybrid models. The cloud-based segment dominated the market in 2024, supported by its scalability, cost efficiency, and ability to integrate diverse real-world data sources such as EHRs, claims, genomics, and wearable data across geographies. Growing adoption of cloud infrastructure by pharmaceutical and biotech companies, CROs, and payers has further accelerated this trend, as organizations prioritize flexible, interoperable, and AI-enabled platforms for faster insights. While on-premises deployments remain relevant for institutions requiring strict data security and control, and hybrid models are gaining traction by balancing security with scalability, cloud-based solutions are expected to maintain their leadership due to their ability to drive efficiency, interoperability, and collaboration across stakeholders in the RWE ecosystem.
Real world evidence solutions market, By revenue model
By revenue model, the real-world evidence (RWE) solutions market is divided into pay-per-usage (value-based pricing), subscription, and license models. The subscription segment led the market in 2024, reflecting the growing preference among pharmaceutical companies, CROs, and payers for scalable and flexible access to RWE platforms. Subscription models provide continuous access to real-world data and analytics tools, supporting long-term projects such as drug development, market access, and post-marketing surveillance. While pay-per-usage models are gaining popularity due to their cost-effectiveness and flexibility, especially for smaller players and one-time studies, license-based models remain relevant by enabling full end-to-end delivery of RWE through enterprise-wide platform adoption. However, subscription-based models are expected to continue as the most widely used due to their predictable costs, scalability, and ability to support ongoing evidence-generation needs across the healthcare ecosystem.
Real world evidence solutions market, By Application
The real-world evidence solutions market is divided into segments such as drug development and approvals, medical device development and approvals, post-market surveillance, market access and reimbursement decisions, clinical and regulatory decision-making, and other applications. In 2024, the drug development and approvals segment led the market. This leadership is driven by increasing regulatory acceptance from agencies like the FDA, a growing need for faster and more cost-efficient clinical development, and rising demand from biopharma companies for real-world insights to support trial design, label expansion, and regulatory submissions.
Real world evidence solutions market, By Component
By component, the real-world evidence solutions market is segmented into services and data sets. In 2024, the services segment accounted for the largest market share in 2024. The service segment covers advanced analytics and consulting services. These services deliver insights to stakeholders and end users by extracting meaningful patterns of information and delivering patient-centered outcomes
Real world evidence solutions market, By End User
By end user, the real-world evidence solutions market is divided into pharmaceutical & biotechnology companies, MedTech companies, healthcare payers, healthcare providers, and other end users. Pharmaceutical and medical device companies lead the end-user segment of the RWE solutions market, mainly because of their growing adoption of RWE. This trend is driven by RWE's effectiveness in fulfilling regulatory compliance requirements.
REGION
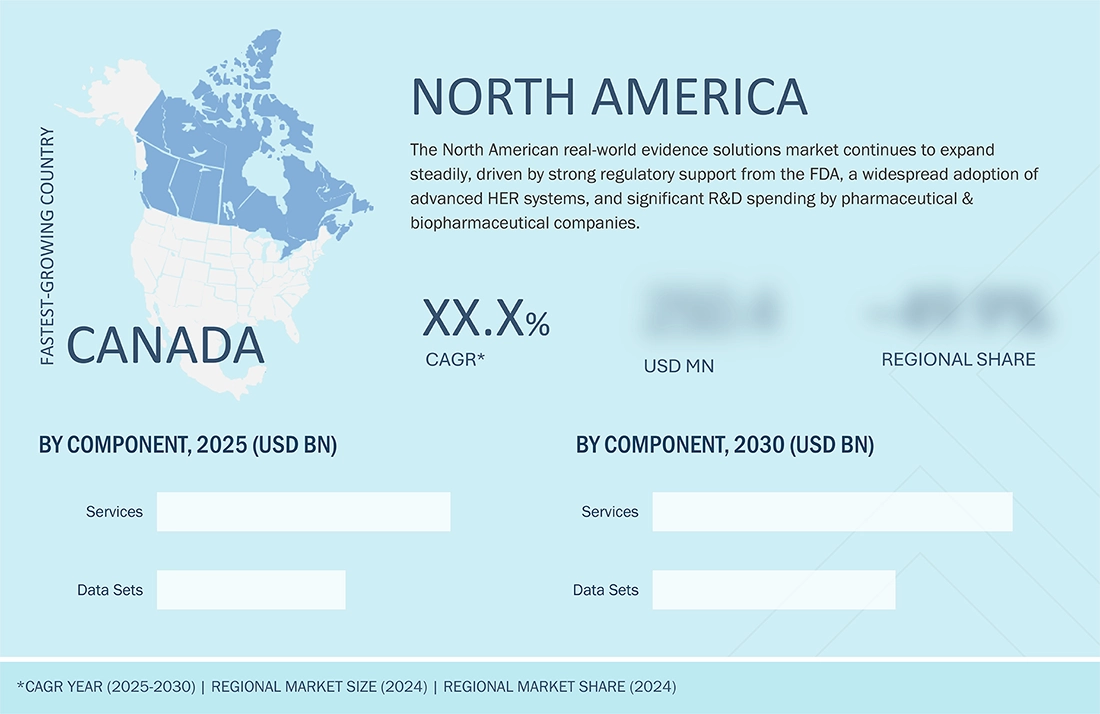
North America is expected to hold a significant market share in global real world evidence solutions market
Regional growth patterns show clear differences. North America remains the largest and most mature RWE solutions market, supported by strong regulatory backing from the FDA, widespread EHR adoption, and high biopharma R&D investment. However, consolidation among major vendors and healthcare providers is reshaping competitive dynamics and boosting ecosystem-level collaborations. The Asia Pacific is the fastest-growing region, driven by government digital health initiatives, rapid clinical trial growth in China and India, and increasing RWE use in Japan and South Korea. Europe shows steady uptake, aided by EMA’s regulatory approval and more collaborations for HTA decisions, though varying reimbursement systems and country-specific rules cause uneven growth. Meanwhile, Latin America and the Middle East are emerging high-growth markets, especially Brazil, Saudi Arabia, and the UAE, where rising investments in healthcare infrastructure, digital health platforms, and precision medicine are fueling demand for RWE solutions.
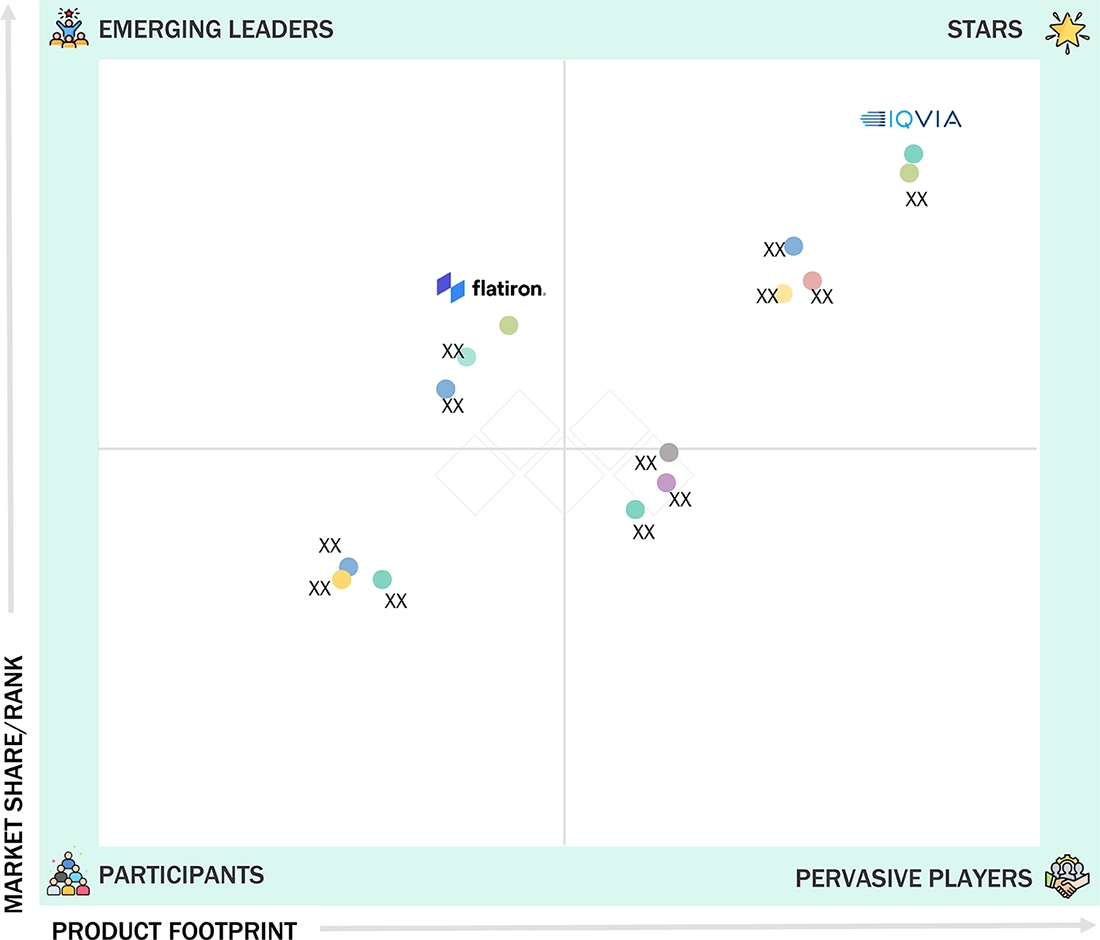
Real World Evidence Solutions Market: COMPANY EVALUATION MATRIX
The competitive landscape of the RWE solutions market can be divided into leaders, challengers, niche innovators, and value players. Leaders like IQVIA, Optum, and Flatiron Health hold significant market share through their broad data networks, global presence, and established partnerships with pharma and payers, maintaining dominance with comprehensive solutions. Challengers such as Aetion, TriNetX, and Verantos are growing quickly, using regulatory-grade validation, federated data networks, and high-quality analytics to challenge the leader’s dominance. Niche innovators such as COTA Healthcare concentrate on unique capabilities, such as oncology-specific real-world insights, to stand out and win specialized segments. Value players, including regional data aggregators and new cloud-based analytics firms, are transforming the market by offering affordable solutions and localized data access in price-sensitive areas. This landscape emphasizes that innovation in analytics, regulatory trust, and data quality, combined with pricing strategies, will shape long-term leadership positions.
Source: Secondary Research, Interviews with Experts, MarketsandMarkets Analysis
KEY MARKET PLAYERS
MARKET SCOPE
| REPORT METRIC | DETAILS |
|---|---|
| Market Size in 2024 (Value) | USD 4.7 Billion |
| Market Forecast in 2030 (value) | USD 10.8 Billion |
| Growth Rate | CAGR of 14.8% from 2025-2030 |
| Years Considered | 2023-2030 |
| Base Year | 2024 |
| Forecast Period | 2025-2030 |
| Units Considered | Value (USD Billion) |
| Report Coverage | Revenue forecast, company ranking, competitive landscape, growth factors, and trends |
| Segments Covered |
|
| Regions Covered | North America, Asia Pacific, Europe, the Middle East & Africa, and Latin America |
WHAT IS IN IT FOR YOU: Real World Evidence Solutions Market REPORT CONTENT GUIDE
DELIVERED CUSTOMIZATIONS
We have successfully delivered the following deep-dive customizations:
| CLIENT REQUEST | CUSTOMIZATION DELIVERED | VALUE ADDS |
|---|---|---|
| Local Competitive Landscape | Profiles of key RWE solution providers (e.g., IQVIA, Optum Inc., Merative) covering regional market shares, segment-specific revenues, recent product launches, and integration of AI/analytics capabilities | Enables competitive benchmarking, identification of technology and portfolio gaps, and strategic planning for equipment investments |
| Regional Market Entry Strategy | Regional or country-specific go-to-market analysis detailing barriers (regulatory, reimbursement, patient privacy), demand drivers (disease prevalence, value-based care), and partnership opportunities (data providers, healthcare networks) | Reduces entry risk for new market entrants, accelerates regional product adoption, and supports localization strategies |
| Local Risk & Opportunity Assessment | Identification of regulatory challenges, evolving safety and privacy standards, and untapped opportunities across hospitals, payers, and research organizations (e.g., adoption of RWE in clinical trials or post-marketing surveillance) | Supports proactive risk mitigation, strategic investments, and adaptation to evolving clinical practices and reimbursement models |
| Technology Adoption by Region | Insights on regional adoption of advanced RWE platforms (data integration, analytics, visualization tools, digital registries) and drivers such as government funding, healthcare infrastructure, and R&D initiatives. | Guides R&D focus, product positioning, and investment decisions for targeted technology deployment and regional innovation partnerships |
RECENT DEVELOPMENTS
- March 2025 : ICON PLC (Ireland) launched a clinical trials tokenization solution by integrating it with its RWD ecosystem and analytics capabilities, which allows ~90% matching of trial participants to RWD sources, enabling deeper post-marketing safety and efficacy insights across the product lifecycle.
- May 2025 : Datavant (US) acquired Aetion Inc. (US), a leading RWE platform provider, to enhance Datavant’s lifecycle RWE capabilities by combining its robust health data connectivity, tokenization, and privacy infrastructure with Aetion’s scientific expertise and analytics tools.
- February 2025 : FLATIRON HEALTH (US) partnered with Unicancer (France) to accelerate the generation of regulatory-grade real-world evidence using international oncology data. The goal is to support global drug development and improve access to cancer therapies.
- June 2024 : Parexel International Corporation (US) partnered with Ruijin Hainan Hospital (China) to use real-world data (RWD) and real-world evidence (RWE) to accelerate the approval and availability of innovative therapies in the Chinese market.
- February 2024 : ICON plc (Ireland) acquired Human First (Canda) to enhance its digital capabilities in clinical trials and real-world evidence studies. This acquisition strengthens ICON’s position in decentralized trials by enabling more efficient, patient-centric data collection and reducing trial risks through better protocol planning
Table of Contents
 Exclusive indicates content/data unique to MarketsandMarkets and not available with any competitors.
Methodology
The study involved five activities to estimate the current size of the real world evidence solutions market. Exhaustive secondary research was conducted to collect information on the market and its varied subsegments. The next step was to validate these findings, assumptions, and sizing with industry experts across the value chain through primary research. Both top-down and bottom-up approaches were employed to estimate the complete market size. Thereafter, market breakdown and data triangulation procedures were used to estimate the market size of the segments and subsegments.
Secondary Research
In the secondary research process, various secondary sources such as annual reports, press releases & investor presentations of companies, white papers, certified publications, articles by recognized authors, gold-standard & silver-standard websites, regulatory bodies, and databases (such as D&B Hoovers, Bloomberg Business, and Factiva) were referred to to identify and collect information for the study of the real world evidence solutions market. It was also used to obtain important information about the top players, market classification, and segmentation according to industry trends, to the bottom-most level, geographic markets, and key developments related to the market. A database of the key industry leaders was also prepared using secondary research.
Primary Research
In the primary research process, various supply-side & demand-side sources were interviewed to obtain qualitative & quantitative information for this report. Primary sources from the supply side included industry experts such as CEOs, vice presidents, marketing and sales directors, technology & innovation directors, biostatisticians, and related key executives from various companies and organizations operating in the real world evidence solutions market. Primary sources from the demand side included industry experts, such as directors of pharmaceutical, biopharmaceuticals, medical device companies, contract manufacturing organizations, directors of RWE vendor companies, directors of clinical research organizations, and other related key executives.
The following is a breakdown of the primary respondents:

Note 1: Others include sales, marketing, and product managers.
Note 2: Tiers of companies are defined based on their total revenues. As of 2024. Tier 1 = >USD 1 billion, Tier 2 = USD 500 million to USD 1 billion, and Tier 3 = < USD 500 million.
To know about the assumptions considered for the study, download the pdf brochure
Market Size Estimation
Both top-down and bottom-up approaches were used to estimate and validate the total size of the RWE solutions market. These methods were also used extensively to estimate the size of various subsegments in the market. The research methodology used to estimate the market size includes the following:
- The key players in the industry and markets have been identified through extensive secondary research.
- In terms of value, the industry’s supply chain and market size have been determined through primary and secondary research processes.
- All percentage shares, splits, and breakdowns have been determined using secondary sources and verified through primary sources.

Data Triangulation
The market was split into several segments and subsegments after arriving at the overall market size using the market size estimation processes. To complete the overall market engineering process and arrive at the exact statistics of each market segment and sub-segment, the data triangulation and market breakdown procedures were employed, wherever applicable. The data was triangulated by studying various factors and trends from both the demand and supply sides in the RWE solutions market.
Market Definition
Real world evidence is the clinical evidence about the usage & potential benefits or risks of a medical product derived from real world data analysis. This evidence is derived from the analysis of real world data (RWD), information collected from sources such as electronic health records, insurance claims, patient registries, and data gathered from other sources (such as digital health technologies) that can inform individuals on health status.
Stakeholders
- Original Equipment Manufacturers
- Pharmaceutical & Biotechnology Companies
- Medical Device Companies
- Clinical Laboratories
- Contract Research Organizations
- Medical Device Research & Consulting Firms
- Academic & Research Institutes
- Government Associations
- Market Research & Consulting Firms
- Venture Capitalists & Investors
- Hospitals & Clinics
- Insurers
- Academic Medical Centers
- Government Research Organizations
- Contract & Research Organizations
- Regulatory Agencies
Report Objectives
- To define, describe, and forecast the global RWE solutions market based on component, application, revenue model, deployment mode, end user, and region.
- To provide detailed information regarding the major factors influencing the market growth (such as drivers, opportunities, and challenges)
- To strategically analyze micromarkets1 with respect to individual growth trends, prospects, and contributions to the overall market
-
To analyze the opportunities in the market for stakeholders and to provide details of
the competitive landscape for market leaders. -
To forecast the size of the market segments with respect to five regions, namely,
North America, Europe, the Asia Pacific, Latin America, and the Middle East & Africa. (along with country-wise segments) - To profile the key players and comprehensively analyze their market shares and core competencies in the RWE solutions market.
- To track & analyze competitive developments such as business expansions, partnerships, agreements, collaborations, acquisitions, and innovative product/service launches in the global RWE solutions market.
Key Questions Addressed by the Report
Who are the leading industry players in the real world evidence solutions market?
Prominent players in the real world evidence solutions market include IQVIA Inc. (US), Merative (US), Optum Inc. (US), ICON Plc (Ireland), Syneos Health (US), and Parexel International Corporation (US), among others.
Which components have been included in the real world evidence solutions market report?
The report includes services and data sets as the main components. Data sets are further categorized into disparate data sets and integrated data sets. Disparate data sets include clinical settings data, claims data, pharmacy data, patient-powered data, registry-based data, and other disparate data sets.
Which region dominated the RWE solutions market in 2024?
In 2024, North America accounted for the largest share of the real world evidence solutions market.
Which end user segments have been included in the real world evidence solutions market report?
The report includes pharmaceutical and biotechnological companies, MedTech companies, healthcare payers, healthcare providers, and other end users as the key segments.
What is the total CAGR expected to be recorded for the real world evidence solutions market during 2025–2030?
The market is expected to record a CAGR of 14.8% from 2025 to 2030.
Need a Tailored Report?
Customize this report to your needs
Get 10% FREE Customization
Customize This ReportPersonalize This Research
- Triangulate with your Own Data
- Get Data as per your Format and Definition
- Gain a Deeper Dive on a Specific Application, Geography, Customer or Competitor
- Any level of Personalization
Let Us Help You
- What are the Known and Unknown Adjacencies Impacting the Real World Evidence Solutions Market
- What will your New Revenue Sources be?
- Who will be your Top Customer; what will make them switch?
- Defend your Market Share or Win Competitors
- Get a Scorecard for Target Partners

Custom Market Research Services
We Will Customise The Research For You, In Case The Report Listed Above Does Not Meet With Your Requirements
Get 10% Free CustomisationTESTIMONIALS

JAYANT RAJPUROHIT
Director of Market Insights, Data and Analytics
SFI Health,
Leading Pharmaceutical Companywww.sfihealth.com/

We at SFI Health approached MarketsandMarkets for an Opportunity Assessment on "Incidence and Prevalence of Focus Indications" as we wanted to know the most attractive HCPs like Physician, Functional MD, Naturopath and Pharmacist. The project was critical for us to ensure our focus on the right target which would enable sustainable growth and profitability for SFI Health. The business insights provided exceeded our expectations and we were extremely impressed. The team at MarketsandMarkets is highly professional and detail oriented and very well understood our business needs. MarketsandMarkets offers a unique combination of expertise and dedicated engagement model. We identified 2 new products to be launched in coming months, based on the research findings provided by MarketsandMarkets. We are happy with the services and would strongly recommend MarketsandMarkets to my peers in the industry.

BEATRIZ DE LA CALLE
Head of Commercial Analytics
Qualicaps,
Leading Pharmaceutical Companywww.qualicaps.com/

We partnered with MarketsandMarkets for an assessment study on hard empty capsules. The team was extremely professional in understanding our business requirements and we received timely responses to all our queries. The market intelligence and the recommendations has met our business requirements. We were extremely impressed to see the final study results; it really exceeded our expectations. The market intelligence offered by MarketsandMarkets, and clarity on next steps will help us achieve our business objective for the Year 2021. We are happy with the services and would strongly recommend MarketsandMarkets to my peers in the industry.

Bob Williams,
Senior Director Business Development & Innovation
Bracco Diagnostics Inc.,
Italian Multinational in life sciences sector and a World Leader in imaging diagnosticsimaging.bracco.com/us-en
We were pleased with targeted insights that MarketsandMarkets identified from a custom study on the 'Radiation Dose Management Solutions Market'. Your team identified and characterized the market participants as well as underlying trends accurately. This study was useful to Bracco in formulating business strategies for our dose monitoring product lines and we thank MarketsandMarkets for the job well done.
Cody Coonradt,
Market Development and Strategy Manager
3M Health Information Systems,
Leader in Health care Coding, Payment & Analytics Solutions.www.3m.com/3M/en_US/health-information-systems-us
The value for our organization comes from three things: depth of research, specificity of segments and being easy to work with. As important as the first two are, the third can't be underestimated. MarketsandMarkets, maybe more than any other research vendor, wants to know what is top of mind for our team and what big questions we are grappling to answer.
Their customer first approach and high value engagement model, have given us great analysis and excellent value for money
Growth opportunities and latent adjacency in Real World Evidence Solutions Market


Sharon
Mar, 2022
Which are the different countries covered across the regions of the Global RWE Solutions Market?.
Laura
Mar, 2022
Which geographical segment holds the major share of the global RWE Solutions Market?.
Cynthia
Mar, 2022
What are the benefits of the emerging trends in the global RWE Solutions Market?.