
Refrigerants Market

Refrigerants Market by Type (HFC & Blends, HFO, Isobutane, Propane, Ammonia, Carbon Dioxide), Application (Refrigeration System, Air Conditioning System, Chillers, and MAC), and Region(Asia Pacific , North America, Europe, MEA) - Global Forecast to 2029


REFRIGERANTS MARKET SIZE & SHARE

Source: Secondary Research, Interviews with Experts, MarketsandMarkets Analysis | Updated on : April 28, 2026
The refrigerants market size was valued at USD 6.99 billion in 2024 and is projected to reach USD 9.56 billion by 2029, growing at 6.47% cagr from 2024 to 2029. The global refrigerants market size has grown as the demand for increasing demand for consumer appliances and growing pharmaceutical industry. Refrigerants are cooling mediums that absorb heat at low temperatures and pressure and release heat at high temperatures and pressure. Fluorocarbons are the most widely used refrigerants in equipment, such as refrigerators and air conditioners. However, due to their high ozone depleting potential (ODP) and global warming potential (GWP), they are being replaced by greener refrigerants such as propane, isobutane, ammonia, and carbon dioxide, among others, such as water and propene.
KEY TAKEAWAYS
-
BY TYPEIsobutane is expected to be the second fastest-growing type of the refrigerants market, it is a natural refrigerant used in various refrigeration applications. It is an excellent substitute for hazardous refrigerants, including R12, R13a, R22, HCF, and CFC. R-600a is a naturally occurring component in gasoline. Due to its remarkable thermodynamic performance and minimal environmental effect, isobutane R-600a has attracted significant interest recently. It is a non-toxic chemical with zero ODP and a modest potential for global warming. Due to its eco-friendly property, R-600a has become a refrigerant gas of choice in small commercial refrigerants and domestic refrigerants.
-
BY APPLICATIONMAC is expected to be the fastest-growing application of the refrigerants market, MAC includes air conditioning in vehicles such as cars, trucks, and buses. The commonly used refrigerant in Mobile Air Conditionings is HFC134A. Another refrigerant R-1234yf is an alternative to the R-134A refrigerant used in mac. However, some European automobile manufacturers have raised the flammability issue using R–1234yf. Apart from fluorocarbon refrigerants, HC refrigerants are also used in MAC Refrigerants such as HFC-1234yf, HCs, and carbon dioxide have GWPs below 150 and have more potential to achieve fuel efficiency as compared to the existing R–134A systems. Currently, there is no regulation for using fluorinated refrigerant gases for MAC in buses and trains
-
BY REGIONAsia Pacific dominates the global refrigerants market, with China being the largest consumer of refrigerants globally. Increased investments and a rise in the number of new manufacturing establishments make Asia Pacific a prime market for refrigerants. Increasing government projects and infrastructure development are expected to drive the demand for refrigerants in applications such as chillers, refrigerators, and freezers. Additionally, the increasing economic growth, followed by substantial investment in the consumer appliances industry, will boost the demand for refrigerants in the region. The growing population, along with industry alliances, is also expected to propel market growth in the region.
-
COMPETITIVE LANDSCAPEThe major market players have adopted both organic and inorganic strategies including expansion, collaborations, partnerships, acquisitions and investments. For instance, Honeywell International Inc. announced a collaboration with Bosch, where Bosch's new line of heat pumps will feature Honeywell's energy-efficient, low-global-warming-potential (GWP) Solstice 454B refrigerant.
Refrigerants are chemicals functioning on the principle of transferring heat by absorbing it at low temperature and pressure and releasing it at high temperature and pressure. Based on their functionality, refrigerants are broadly classified into two major types—primary and secondary refrigerants. Primary refrigerants act as phase change materials (PCMs) and enable refrigeration by undergoing a phase change. Secondary refrigerants are used to transfer heat energy from one source to another. They are mainly used in cooling equipment such as refrigeration and air conditioning systems.
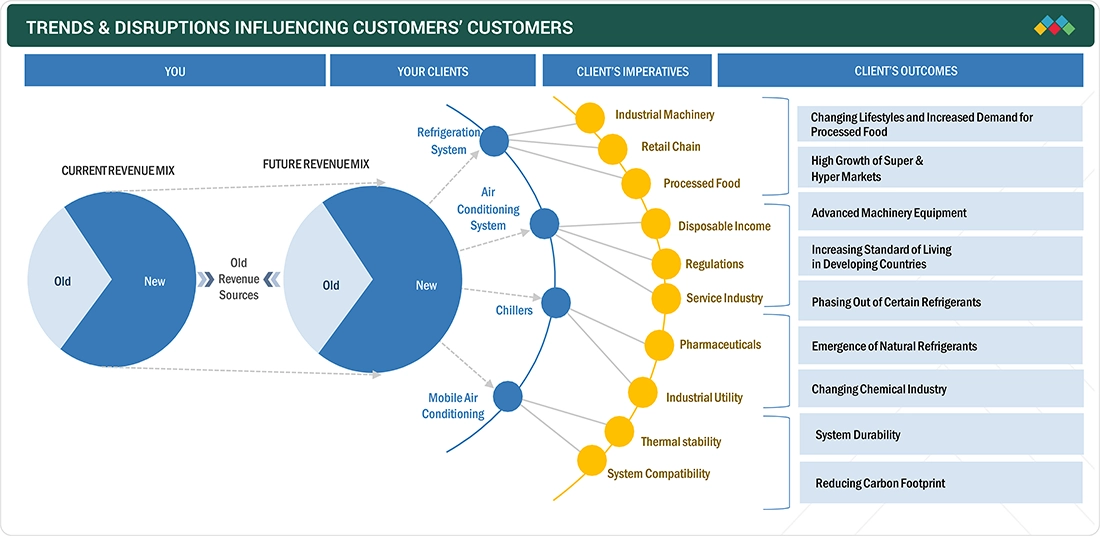
TRENDS & DISRUPTIONS IMPACTING CUSTOMERS' CUSTOMERS
The megatrends, including digital transformation and renewables, will impact a company's revenue stream. The emerging trends and technologies in the industry include not-in-kind cooling technology, magnetic refrigeration, IoT, and bio-based/natural refrigerants. The regrigerants market is expected to witness significant growth for the forecast period due to the increasing demand from end-use industries, such as refrigeration systems, air conditioning systems, and mobile air conditioning.
Source: Secondary Research, Interviews with Experts, MarketsandMarkets Analysis
REFRIGERANTS MARKET DYNAMICS
Level
-
Increasing demand for consumer appliances

-
Growing pharmaceutical industry

Level
-
Stringent regulations against fluorocarbon refrigerants

-
Flammability and toxicity issues

Level
-
Increasing demand for natural refrigerants

Level
-
Illegal trade of refrigerants

Source: Secondary Research, Interviews with Experts, MarketsandMarkets Analysis
Driver: Growing pharmaceutical industry
The pharmaceutical industry requires low-temperature conditions for transport and storage of drugs. Factors such as the increasing focus on biologics, the growing demand for specialty pharmaceuticals, insulin products, and vaccines are driving the need for refrigerants in this sector, particularly in developing Asian economies. The pharmaceutical industry is experiencing significant growth in major emerging markets in Asia Pacific, notably in China and India. This growth is expected to further boost the demand for refrigerants. Additionally, the rapid expansion of the pharmaceutical sector in emerging economies such as Brazil, China, and India is resulting in a gradual shift of research activities from Europe to these regions. According to the European Federation of Pharmaceutical Industries and Associations (EFPIA), from 2015 to 2020, the pharmaceutical industries in Brazil, China, and India grew by 11.3%, 4.8%, and 10.0%, respectively. In comparison, the global pharmaceutical industry grew by 5.0% in the top five European Union markets and by 4.9% in the US market.
Restraint: Flammability and toxicity issues
Refrigerants such as ammonia, carbon dioxide, and HCs are flammable, corrosive, and toxic at higher concentrations. Ammonia can react with copper and corrode it. Hence, ammonia-based refrigeration systems are made of materials such as steel, though it increases the overall initial cost of systems. The safety precautions associated with ammonia and carbon dioxide are comparatively greater than those associated with fluorinated refrigerant gases. Carbon dioxide tends to solidify into dry ice upon contact with air. Hence, carbon dioxide cylinders and refrigeration systems require special valves to prevent this conversion.
Opportunity: Increasing demand for natural refrigerants
The global demand for environmentally friendly cooling solutions propels this growth because of executive GWP regulations, together with enhanced environmental awareness and multiple sectors increasing need for sustainable cold solutions. The food processing sector, together with cold storage facilities and retail operations, fast-tracks the implementation of natural refrigerants to fulfill sustainability requirements and decrease their environmental impact. Natural refrigerants consisting of carbon dioxide, ammonia, and hydrocarbons provide low GWP performance and aggressive ODP profiles which make them suitable choices instead of synthetic refrigerants in industrial applications. Stationary equipment manufacturers diligently pursue improved system designs and safety measures to support the industrial adoption of natural refrigerants in commercial applications. Market expansion is expected due to key players innovating to sustain their position amid an emerging and active competitive environment.
Challenge: Illegal trade of refrigerants
The illegal import of refrigerants is a major challenge to the global refrigerants market, which is against the effort to meet the regulatory targets and compromises product safety. This issue is especially concerning with hydrofluorocarbons (HFCs), which are being phased out under international agreements such as the Kigali Amendment and the Montreal Protocol. Illegal trading of these substances interrupts the progress of emission reduction and creates enormous risks to safety and performance. Illegally imported refrigerants are frequently of substandard quality or counterfeits, which can degrade refrigeration and HVAC systems and raise the prospect of accidents.
Refrigerants Market: COMMERCIAL USE CASES ACROSS INDUSTRIES
| COMPANY | USE CASE DESCRIPTION | BENEFITS |
|---|---|---|
 |
Uses natural refrigerants (CO2, ammonia, hydrocarbons) in ice-cream freezers and industrial refrigeration systems globally. | Reduces greenhouse gas emissions, improves energy efficiency, and enhances environmental sustainability. |
 |
Installs HFC-free coolers and dispensers using natural refrigerants in cold-drink equipment worldwide. | Prevents CO2 emissions, supports climate goals, and ensures regulatory compliance for sustainable cooling. |
 |
Deploys energy-efficient, HFC-free coolers and vending machines using natural refrigerants like R-290 and CO2. | Reduces direct GHG emissions, lowers energy consumption, and aligns with global sustainability initiatives. |
 |
Uses natural refrigerants in commercial refrigeration and display equipment under its sustainability program. | Minimizes global warming potential, supports eco-friendly retail operations, and lowers maintenance costs. |
 |
Implements natural refrigerant systems in store refrigeration and display cases replacing HFC-based systems. | Increases energy efficiency, lowers operational costs, and reduces overall carbon footprint. |
Logos and trademarks shown above are the property of their respective owners. Their use here is for informational and illustrative purposes only.
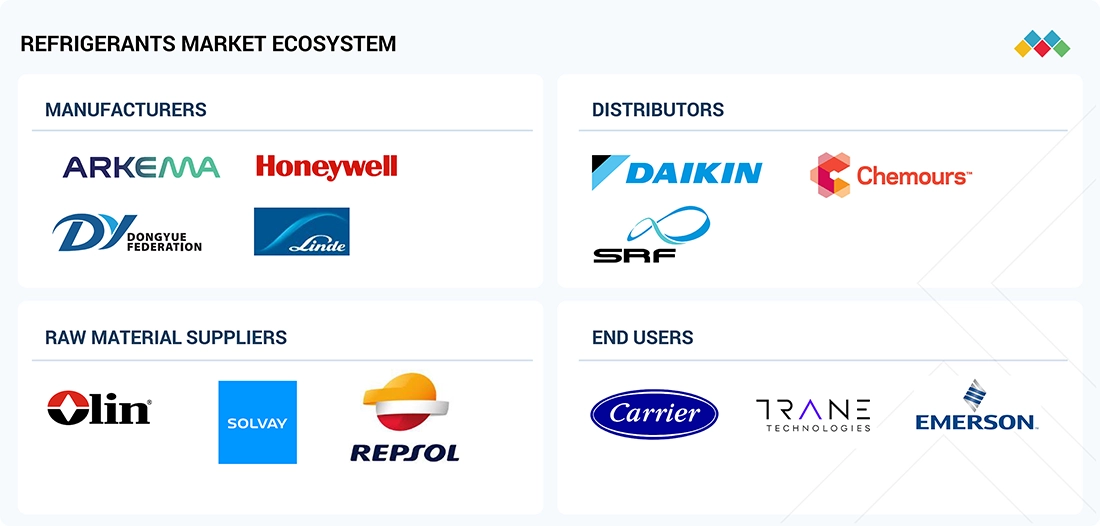
REFRIGERANTS MARKET ECOSYSTEM
The refrigerants industry ecosystem includes companies manufacturing refrigerants, such as Arkema SA, Dongyue Group Co. Ltd., Honeywell International Inc., Chemours Company, Linde Group, Air Liquide S.A., Sinochem Corporation, Daikin Industries Ltd., Orbia, and Asahi Glass Corporation.
Logos and trademarks shown above are the property of their respective owners. Their use here is for informational and illustrative purposes only.
REFRIGERANTS MARKET SEGMENTS
Source: Secondary Research, Interviews with Experts, MarketsandMarkets Analysis
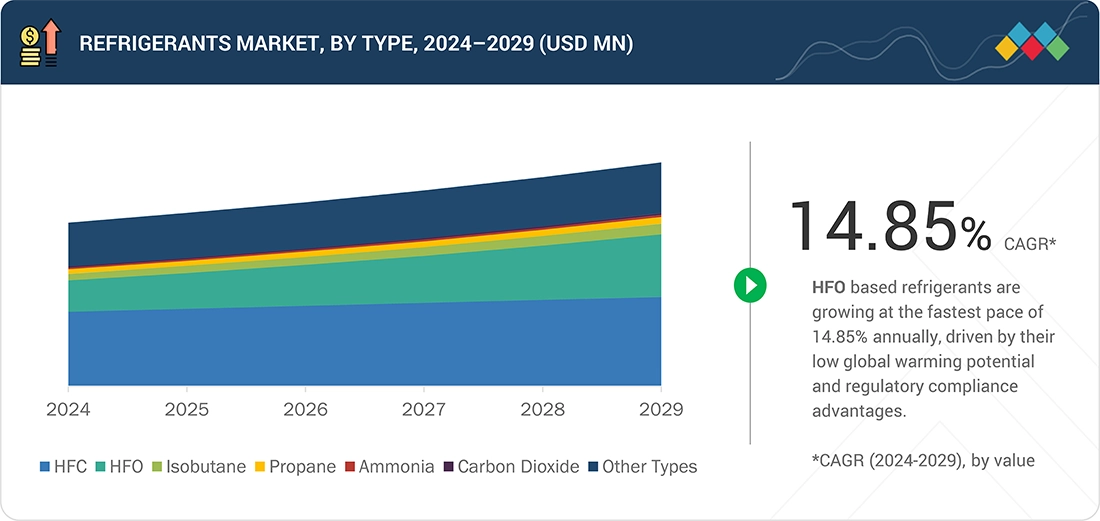
Refrigerants Market, By Type
HFC & blends are the largest segment in the refrigerants market, HFCs are used as refrigerants, blowing agents, and aerosol propellants. Following the phase-out of chlorofluorocarbons (CFCs) and later HCFCs, which were also greenhouse gases, HFC & blends became popular. Although HFCs are greenhouse gases, they are not as potent as CFCs or HCFCs. Following the phase-out of CFCs and HCFCs, the demand for HFCs has risen rapidly and further increased with the expansion of air conditioning in developing countries. However, due to its high GWP, on October 15, 2016, it was announced in Kigali, Rwanda, that 170 nations had agreed to phase down HFCs through an amendment to the Montreal Protocol.
Refrigerants Market, By Application
Refrigeration systems were the largest segment of the refrigerants market ,this application is divided into three major categories, which are domestic refrigeration, industrial refrigeration, and commercial refrigeration. Domestic refrigeration is mainly used in households for preserving food, drinks, and medicine. This category mainly covers refrigerators, freezers, and combined systems. Initially, refrigerants such as CFCs (CFC11 and CFC12) and HCFC (R22) were used in cooling systems. Commercial refrigeration is mainly used to preserve or display food & beverages in retail stores. This segment includes supermarkets, hypermarkets, and office buildings, which require refrigeration systems. Currently, refrigerants such as HCFC (R22), HFCs (R134A and R404A), and HC (290 and 600A) are used in commercial refrigerators, with HCFCs being the predominant one in this application. The industrial refrigeration segment includes refrigerants used in manufacturing plants. Refrigerants such as HCFC and ammonia are most commonly used in industrial applications. However, due to new environmental legislation, the use of HCFC refrigerants is declining.
REGION
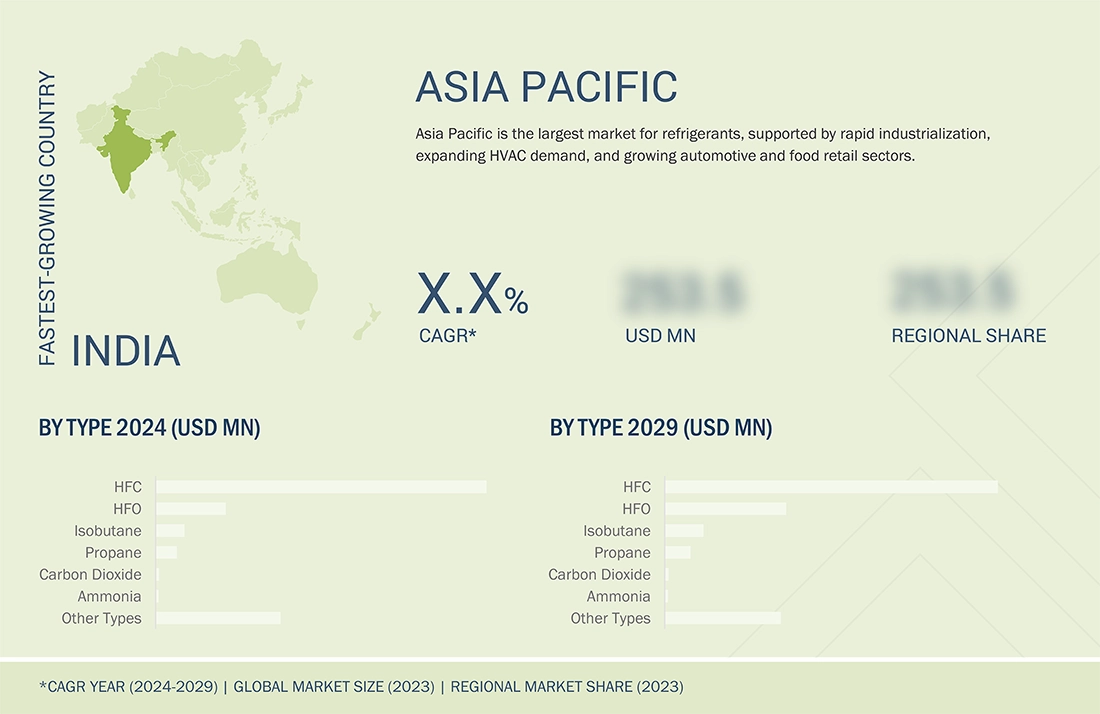
Asia Pacific accounted for the largest share of the refrigerants market
Asia Pacific is the largest refrigerants market, accounting for the largest share of the market in 2023. HFC and carbon dioxide are among the most widely consumed refrigerants due to the increasing consumption of refrigeration and AC equipment in commercial buildings and supermarkets. In Asia Pacific, the demand for inorganic refrigerants is expected to rise mainly due to the 100% phase-out of HCFCs by 2040 and the 85% phase-out of HFCs by 2047. Market growth in Asia Pacific is mainly attributed to China—the largest refrigerants market in the world in terms of volume. The presence of large consumer pockets and the low cost of production in India and China are driving the region’s refrigerants market. Moreover, rapid urbanization, demand for domestic consumer appliances, and the rapidly growing infrastructure industry in Thailand and Indonesia are also expected to support the growth of the refrigerants market in Southeast Asia during the forecast period
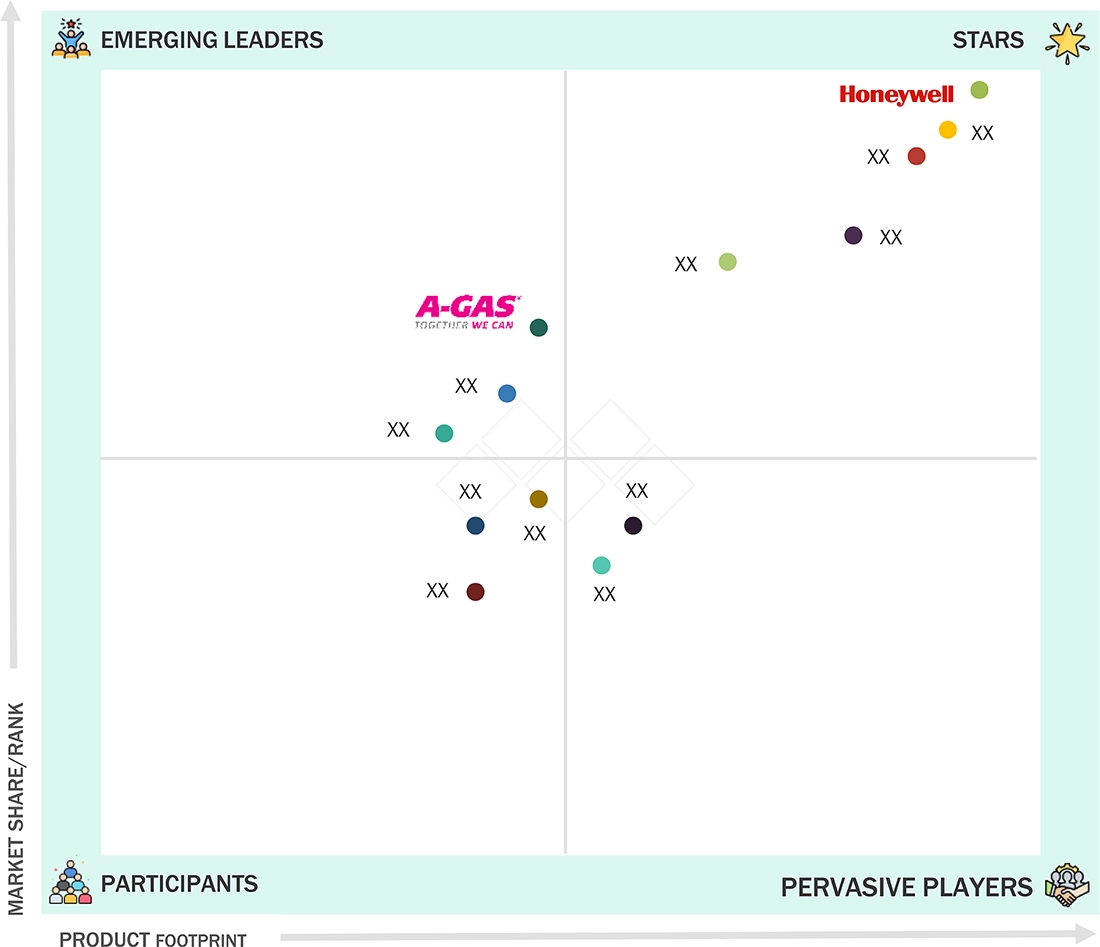
Refrigerants Market: COMPANY EVALUATION MATRIX
In the refrigerants market matrix, Honeywell International Inc. (Star) leads with a strong market presence and wide product portfolio, driving large-scale adoption across applications. A-Gas International Limited (Emerging Leader) is gaining traction due to its diversified product portfolio and continuous investment in R&D. While Honeywell International Inc. dominates with scale, A-Gas International Limited shows strong growth potential to advance toward the leaders’ quadrant.
Source: Secondary Research, Interviews with Experts, MarketsandMarkets Analysis
KEY MARKET PLAYERS
REFRIGERANTS MARKET SCOPE
| REPORT METRIC | DETAILS |
|---|---|
| Market Size Value in 2024 | USD 6.99 BN |
| Revenue Forecast in 2029 | USD 9.56 BN |
| Growth Rate | CAGR of 6.47% from 2024-2029 |
| Years Considered | 2018−2029 |
| Base year | 2023 |
| Forecast period | 2024−2029 |
| Units considered | Value (USD Billion) and Volume (Kiloton) |
| Report Coverage | Revenue forecast, company ranking, competitive landscape, growth factors, and trends |
| Segments Covered |
|
| Regional Scope | Asia Pacific, Europe, North America, Middle East & Africa, and South America |
WHAT IS IN IT FOR YOU: Refrigerants Market REPORT CONTENT GUIDE
DELIVERED CUSTOMIZATIONS
We have successfully delivered the following deep-dive customizations:
| CLIENT REQUEST | CUSTOMIZATION DELIVERED | VALUE ADDS |
|---|---|---|
| Europe -based Refrigerants Manufacturer | • Detailed Europe based company profiles of competitors (financials, product portfolio) • Customer landscape mapping by application sector • Partnership ecosystem analysis | • Identify interconnections and supply chain blind spots • Detect customer migration trends across the industry • Highlight untapped customer clusters for market entry |
| Asia Pacific-based Refrigerants Manufacturer | • Global & regional production capacity benchmarking • Customer base profiling across the applications | • Strengthen forward integration strategy • Identify high-demand customers for long-term supply contracts • Assess supply-demand gaps for competitive advantage |
RECENT DEVELOPMENTS
- April 2024 : Honeywell International Inc. announced a collaboration with Bosch, where Bosch's new line of heat pumps will feature Honeywell's energy-efficient, low-global-warming-potential (GWP) Solstice 454B refrigerant
- June 2023 : Honeywell International Inc. announced the launch of Ireland’s first low-carbon district heating network located in Tallaght, Dublin. This pioneering system leverages a heat pump utilizing Honeywell’s Solstice ze (R-1234ze) refrigerant, recognized for its exceptionally low global warming potential. The project is now operational and will support Ireland’s 2030 and 2050 renewable energy targets and the European Union’s decarbonization initiatives, including REPowerEU
- May 2023 : The Chemours Company entered into an agreement with Zhejiang Juhua Co., Ltd. to expand the production capacity of its ultra-low global warming potential (GWP) HFO foaming agent, Opteon 1100, and specialty fluids, Opteon SF33. The expansion will triple the capacity of HFO-1336MZZZ, meeting the increasing demand for sustainable, energy-efficient solutions. The new production is expected to begin by the end of 2025, with full capacity anticipated in early 2026
- January 2022 : Honeywell International Inc. launched a new non-flammable energy-efficient Solstice N71 (R-471A) refrigerant to meet the stringent regulations regarding reducing greenhouse gas emissions
- May 8, 2021 : Sinochem Holdings Corporation Ltd. was established through the joint restructuring of the Sinochem Corporation and China International Corporation. The company is a leading state-owned enterprise with more than 220,000 employees
Table of Contents
 Exclusive indicates content/data unique to MarketsandMarkets and not available with any competitors.
Methodology
The study involved four major activities in estimating the market size for refrigerants. Exhaustive secondary research was done to collect information on the market, the peer market, and the parent market. The next step was to validate these findings, assumptions, and sizing with industry experts across the value chain through primary research. Both top-down and bottom-up approaches were employed to estimate the complete market size. Post that, the market breakdown and data triangulation procedures were used to estimate the market size of the segments and subsegments.
Secondary Research
Secondary sources used in this study included annual reports, press releases, and investor presentations of companies; white papers; certified publications; articles from recognized authors; and gold standard & silver standard websites such as Factiva, ICIS, Bloomberg, and others. The findings of this study were verified through primary research by conducting extensive interviews with key officials such as CEOs, VPs, directors, and other executives. The breakdown of profiles of the primary interviewees is illustrated in the figure below:
Primary Research
The Refrigerants market comprises several stakeholders, such as raw material suppliers, end-product manufacturers, and regulatory organizations in the supply chain. The demand side of this market is characterized by the automotive, medical, construction and others. The supply side is characterized by advancements in technology and diverse application industries. Various primary sources from both the supply and demand sides of the market were interviewed to obtain qualitative and quantitative informations.
Breakdown of Primary Participants
Note: Tier 1, Tier 2, and Tier 3 companies are classified based on their market revenue in 2023 available in the public domain, product portfolios, and geographical presence.
Other designations include consultants and sales, marketing, and procurement managers.

To know about the assumptions considered for the study, download the pdf brochure
| COMPANY NAME | DESIGNATION | |
|---|---|---|
| Honeywell International Inc. | Director of Marketing | |
| The Chemours Company | Manager- Sales & Marketing | |
| The Linde Group | Sales Manager | |
| Arkema | Production Manager | |
Market Size Estimation
Both top-down and bottom-up approaches were used to estimate and validate the total size of the Refrigerants market. These methods were also used extensively to estimate the size of various subsegments in the market. The research methodology used to estimate the market size includes the following:
- The key players in the industry have been identified through extensive secondary research.
- The supply chain of the industry has been determined through primary and secondary research.
- All percentage shares, splits, and breakdowns have been determined using secondary sources and verified through primary sources.
- All possible parameters that affect the markets covered in this research study have been accounted for, viewed in extensive detail, verified through primary research, and analyzed to obtain the final quantitative and qualitative data.
Refrigerants Market: Top-Down Approach

Data Triangulation
After arriving at the overall market size—using the market size estimation processes as explained above—the market was split into several segments and subsegments. To complete the overall market engineering process and arrive at the exact statistics of each market segment and subsegment, the data triangulation, and market breakdown procedures were employed, wherever applicable. The data was triangulated by studying various factors and trends from both the demand and supply sides in the refrigerants industry.
Market Definition
According to the International Institute of Refrigeration, refrigerants are cooling mediums that absorb heat at low temperatures and pressure and release heat at high temperatures and pressure. Fluorocarbons are the most widely used refrigerants in equipment, such as refrigerators and air conditioners. However, due to their high ozone depleting potential (ODP) and global warming potential (GWP), they are being replaced by greener refrigerants such as propane, isobutane, ammonia, and carbon dioxide, among others, such as water and propene.
Stakeholders
- Refrigerants Manufacturers
- Refrigerants Traders, Distributors, and Suppliers
- End-use Market Participants of Different Segments of Refrigerants
- Government and Research Organizations
- Associations and Industrial Bodies
- Research and Consulting Firms
- R&D Institutions
- Environment Support Agencies
- Investment Banks and Private Equity Firms
Report Objectives
- To define, describe, and forecast the refrigerants market in terms of value and volume
- To provide detailed information regarding the drivers, opportunities, restraints, and challenges influencing market growth
- To estimate and forecast the market size by type, application, and region
- To forecast the size of the market for five main regions: Europe, North America, Asia Pacific, South America, and the Middle East & Africa, along with their key countries
- To strategically analyze micromarkets1 with respect to their growth trends, prospects, and contribution to the overall market
- To analyze opportunities in the market for stakeholders and provide a competitive landscape for market leaders
- To analyze competitive developments, such as deals and expansions, in the market
- To analyze the impact of the recession on the market
- To strategically profile key players and comprehensively analyze their growth strategies
Key Questions Addressed by the Report
Need a Tailored Report?
Customize this report to your needs
Get 10% FREE Customization
Customize This ReportPersonalize This Research
- Triangulate with your Own Data
- Get Data as per your Format and Definition
- Gain a Deeper Dive on a Specific Application, Geography, Customer or Competitor
- Any level of Personalization
Let Us Help You
- What are the Known and Unknown Adjacencies Impacting the Refrigerants Market
- What will your New Revenue Sources be?
- Who will be your Top Customer; what will make them switch?
- Defend your Market Share or Win Competitors
- Get a Scorecard for Target Partners

Custom Market Research Services
We Will Customise The Research For You, In Case The Report Listed Above Does Not Meet With Your Requirements
Get 10% Free CustomisationTESTIMONIALS

We at Nissan Chemicals Corporation have been clients of MarketsandMarkets for more than a year now. We recently consulted MarketsandMarkets for a study, the team at MarketsandMarkets was extremely professional and organized. The business insights were very detailed and aligned well with our expectations that really helped us formulate the Business Plans and device new strategies for development themes. MarketsandMarkets offers a unique combination of expertise and dedicated engagement model. Their research findings have helped us in designing our Pricing Strategy which will make it easier for us to predict the future sales and profits for the next ten years. We look forward to working with MarketsandMarkets in the future.
VP of Strategy & New Business Development
Leading Specialty Chemical Company
The MarketsandMarkets Engagement Model, composed of both the Knowledge Store and advisory custom research, has greatly helped us in understanding our markets and making strategic decisions. The Knowledge Store is a fast way to allow everyone in our organization to understand more about most any market they are interested in. The ability to then get custom research done and get answers to specific strategic questions and market insight has been spectacular. The Markets and Markets team feel more like colleagues than vendors and their services have helped us change our culture where statements of things like growth opportunities and competitive position are always backed by industry research.

Rich Gibson,
Director, Corporate Strategy
Milliken & Company,
Leading Industrial Manufacturer of specialty chemical, floor covering, performance and protective textile materials, and healthcaremilliken.com
MarketsandMarkets is a trusted resource that helps us to better understand markets that are near-adjacencies-whether its technology, value chain or geography. Their Knowledge Store platform provides a dashboard of markets and their characteristics which is easy to use and saves us time.
Adam Shaw,
Market Development and Strategy Manager
AdvanSix Inc. USA,
An American Leader in Chemicalswww.advansix.com
The Knowledge Store from MarketsandMarkets is a valuable tool which has helped my team acquire greater insight in to the end markets that our business serves. This has enabled us to help our company build stronger strategies throughout our planning process.
TOSHIO KINOSHITA
Senior Chif Consultion Research & Consulting Division
Mitsubishi Chemical Research Corporation,
Leading Manufacturer of Chemical Productswww.mitsubishichem-res.co.jp/en/

We recently engaged with MarketsandMarkets for a study, the team not only clearly understood our business objectives but was also extremely professional in the way they handled the entire project. The study was efficiently conducted in a phase-wise manner, and the engagement model furnished us with high-quality business insights that far exceeded our expectations at each phase. We were especially happy that MarketsandMarkets could provide us with both, an English as well as a Japanese version of the study. A special thanks to the Analyst Team and Client Services Team, whose fluency in Japanese enhanced our comfort level, as we could converse with them in our preferred language.
Independent entrepreneurs
Arrow Precision
We approached MarketsandMarkets for study on Proppants Market, and their work exceeded our expectations. The study conducted was comprehensive and enabled us to view the market through the various dimensions. In addition, the team was extraordinarily responsive throughout the process and resolved our queries on time. I strongly recommend MarketsandMarkets and will certainly consider them for additional market assessments we will need in the future.
Global engineering company, Japan
Deputy Manager,
Strategic Planning OfficeThe high-quality insights shared by the MarketsandMarkets team helped us understand the pharmaceutical plant designers in a specific geography. It also captured the risks that we may likely face in communicating with our potential partners. The study would enable us identify partners, which would impact our future growth.


Growth opportunities and latent adjacency in Refrigerants Market