Revenue Management Market by Solution (Billing and Payment, Price Management, Revenue Assurance and Fraud Management, and Channel Management), Service, Deployment Mode (On-premises and Cloud), Vertical, and Region � Global Forecast to 2024


Revenue Management Market Growth & Trends
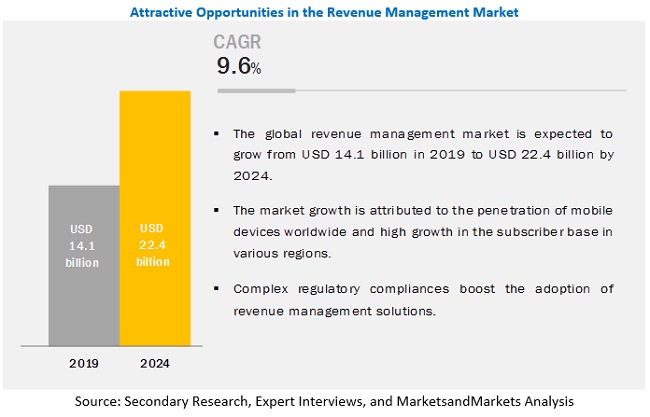
The global Revenue Management Market size was valued at $14.1 billion in 2019 and it is projected to reach $22.4 billion by the end of 2024 at a CAGR of 9.6% during the forecast period. The major factors driving the growth of the market include the rising need for competitive pricing strategies, penetration of mobile devices worldwide, high growth in subscriber base in various regions, and digital transformation to compel Communication Service Providers (CSPs) for integrating revenue management throughout modern systems.
Solution segment to hold a larger market size during the forecast period
Based on components, the solution segment of the revenue management market is expected to hold a larger market size during the forecast period. It consists of billing and payment, price management, revenue assurance and fraud management, and channel management, where revenue management vendors can provide one-stop, end-to-end solutions for enterprises. The billing and payment solution comprises intelligent configuration, pricing, and quoting solutions, deal management, tender management, order management, and financial accounting. The channel management solution consists of channel data management, rebate management, and marketing fund management. Channel management enables enterprises to provide personalized pricing and tailored products for customers, depending upon their attributes. The pricing management solution makes use of smart algorithms for data mining and smart pricing algorithms, thus using the information to arrive at better pricing and promotions for enterprises. The revenue assurance and fraud management solution optimizes enterprise control of the billing chain and ensures billing accuracy to detect even the minutest errors for reducing revenue leaks.
Billing and payment solution segment to record the highest market share during the forecast period
Based on the solutions, the billing and payment solution segment is projected to lead the revenue management market during the forecast period. The billing and payment solution comprises intelligent configuration, pricing, and quoting solutions, deal management, tender management, order management, and financial accounting. The billing and payment solution enables enterprises to support different lines of businesses on a single platform by aggregating data from numerous billing tools and generating a single invoice. The solution consolidates all financial transactions associated with customer billing accounts over a certain period into a single bill. It helps service providers exchange billing data and invoices, and share revenue or cost information with partners. This enables operators to maintain billing accuracy and improve customer experiences by enabling end-to-end management of disputes and adjustments.
Telecom segment to hold the largest market size during the forecast period
Revenue management in the telecommunications industry helps in pricing management, billing, rating and charging, invoicing, collections, credit limit management, accounting, and general ledger integration for telecom service providers. Revenue management solution suite offers CSPs and companies who are active within the Internet of Things(IoT) business with tools to handle the entire billing life cycle. The solutions accurately handle gathering, decoding, and enhancing transaction data to aggregation, and distribution for a partner and end-user billing. Revenue management is all about maximizing revenue assurance and minimizing revenue leaks in the telecommunications industry. The revenue management solution also helps telecom companies rationalize their pre and post-paid billing architecture by providing solutions, such as billing maturity and roadmap assessments. It ultimately enables telecom operators to minimize the pressure on their profit margins in parallel to the progress in the prices.
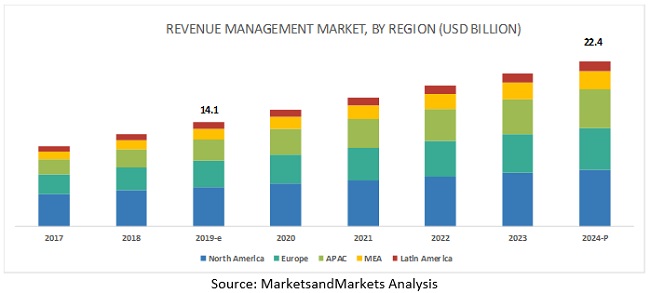
North America to record the highest market share in 2019
North America plays a huge role in the development of technology, which helps in the adoption of revenue management solutions across the major verticals. North America holds the highest market share in the revenue management market. This is due to the presence of countries with stable economies, such as the US and Canada. Companies across these countries are adopting cloud-based revenue management solutions, further driving the market in North America. However, the growth of the market in North America is showing a reduction in its market share as the North American telecom industry is saturated as compared to the telecom industry in developing countries. Telecom operators face limited competition in local service as large initial investment requirement restricts the entry of new competitors in the telecom industry. The financial soundness of these companies enables them to invest heavily in the adoption of leading tools and technologies for effective business operations. Most leading companies from major sectors, such as telecom, aviation, and hospitality that are headquartered in the region, are adopting revenue management platforms. A majority of the niche players, such as Amdocs, Netcracker Technology Corporation, and Oracle, are also adopting these platforms and solutions due to factors, such as ease of use. These factors lead to the region’s strong position in the revenue management market.
Key Market Players
Key market players profiled in this report include Huawei (China), Amdocs (US) Oracle (US), Netcracker (Japan), CSG (US), Ericsson (Sweden), Cerillion (UK), Mahindra Comviva (India), Optiva (Ireland), SAP (Germany), Accenture (Ireland), Enghousenetworks (Canada), Accelya (India), HQ Revenue (Germany), IDeaS (US), ZuoraREVPRO (US), R1RCM (US), Workday (US), Fiserv (US), Apttus (US), and Infor (US). These players have adopted various growth strategies, such as partnerships and new service launches, to expand their presence further in the revenue management market and broaden their customer base.
Netcracker offers a revenue management platform, which helps telecom operators and service providers to transform their existing complex and siloed Business support System(BSS) into highly efficient ecosystems. The platform is compatible with advanced technologies and enables new revenue streams by enabling service providers to monetize Long Term Evolution. (LTE/VoLTE), cloud-based, and virtualization services. It offers various revenue management products, such as a cloud-based online charging system, collection management, active mediation, converged charging and rating, customer billing management, partner billing management, voucher management, and bill presentment. NEC consolidated all of its telecom software and services assets under Netcracker. These consist of innovative applications and service platforms, including customer, service, and network management along with NEC’s comprehensive suite of professional services.
Scope of Report
|
Report Metrics |
Details |
|
Market size available for years |
2017-2024 |
|
Base year considered |
2018 |
|
Forecast period |
2019-2024 |
|
Forecast units |
Value (USD Billion) |
|
Segments covered |
Components (solutions [billing and payment, price management, revenue assurance and fraud management, and channel management] and services [professional and managed]), deployment modes, verticals, and regions |
|
Regions covered |
North America, Europe, APAC, MEA, and Latin America |
|
Companies covered |
Huawei (China), Amdocs (US) Oracle (US), Netcracker (Japan), CSG (US), Ericsson (Sweden), Cerillion (UK), Mahindra Comviva (India), Optiva (Ireland), SAP (Germany), Accenture (Ireland), Enghousenetworks (Canada), Accelya (India), HQ Revenue (Germany), IDeaS (US), ZuoraREVPRO (2007), R1RCM (US), Workday (US), Fiserv (US), Apttus (US), and Infor (US). |
This research report categorizes the revenue management market to forecast revenue and analyze trends in each of the following submarkets:
Based on Components, the market has the following segments:
-
Solutions
- Billing and payment
- Price management
- Revenue assurance and fraud management
- Channel management
-
Services
- Professional Services
- Managed Services
-
Professional Services
- Consulting
- Integration and Deployment
- Maintenance and Support
Based on Deployment Modes, the market has the following segments:
- On-premises
- Cloud
Based on Verticals, the market has the following segments:
- Telecom
- Hospitality
- Transportation
- Healthcare
- Retail and eCommerce
- BFSI
- Utilities
- Others (media and entertainment, and manufacturing)
Based on Regions, the market has the following segments:
-
North America
- US
- Canada
-
Europe
- UK
- Germany
- France
- Rest of Europe
-
APAC
- China
- India
- Rest of APAC
-
MEA
- Kingdom of Saudi Arabia
- UAE
- Rest of MEA
-
Latin America
- Brazil
- Mexico
- Rest of Latin America
Recent Developments
- In October 2019, Vast Broadband selected Netcracker to deliver a BSS and Operations Support System(OSS) transformation program, which will automate Vast Broadband’s end-to-end fulfillment processes and reduce operational costs. Netcracker will provide a solution to enhance its customer experience, manage and automate billing, inventory, service fulfillment, and product management.
- In September 2019, Schurz Communications partnered with Netcracker and used its revenue management solution for the long lines business to streamline, simplify, and standardize the billing processes across different properties.
- In October 2019, CSG Systems International launched Ascendon Communications, which is a SaaS and cloud-based BSS solution. This solution helps CSPs retain and expand their customer base, increase revenues by accelerating the launch of new services, support the new business model by offering innovative solutions, and reduce costs through a cloud-based architecture.
- In May 2019, CSG Systems International launched the Mediation platform as a cloud-based solution. CSG Mediation leverages both cloud and native Amazon Web Services (AWS) tools to help CSPs meet demands in real time. It also provides a cost-effective and efficient way for service providers to seize 5G opportunities with minimal risk and disruption to existing systems.
- In November 2019, Ericsson partnered with Vodafone Egypt to transform Vodafone Egypt’s BSS into an industrialized, real-time converged environment. This partnership offers Vodafone Egypt a seamless, flexible, and cost-cutting evolution toward 5G and IoT readiness.
Frequently Asked Questions (FAQ):
What is the projected market value of the global revenue management market?
The global revenue management market is expected to grow from USD 14.1 billion in 2019 to USD 22.4 billion by 2024.
What is the estimated growth rate of the global revenue management market?
The global revenue management market is projected to register a moderate 9.6% CAGR in the forecast period.
Which component of the revenue management market expected to witness the larger market size?
Based on components, the solution segment of the revenue management market is expected to hold a larger market size during the forecast period.
Which industry of the revenue management market expected to witness the largest market size?
Telecom segment to hold the largest market size during the forecast period.
Who are the key players operative in the global revenue management market?
Huawei (China), Amdocs (US) Oracle (US), Netcracker (Japan), CSG (US), Ericsson (Sweden), Cerillion (UK), Mahindra Comviva (India), Optiva (Ireland), SAP (Germany), Accenture (Ireland), Enghousenetworks (Canada), Accelya (India), HQ Revenue (Germany), IDeaS (US), ZuoraREVPRO (2007), R1RCM (US), Workday (US), Fiserv (US), Apttus (US), and Infor (US).
What are the top driving factors in revenue management market?
Driving factors for the growth of revenue management market includes:
- The rising need for competitive pricing strategies, penetration of mobile devices worldwide
- High growth in subscriber base in various regions
- Digital transformation to compel Communication Service Providers (CSPs) for integrating revenue management throughout modern systems.
To speak to our analyst for a discussion on the above findings, click Speak to Analyst
 Exclusive indicates content/data unique to MarketsandMarkets and not available with any competitors.
Table of Contents
1 Introduction (Page No. - 18)
1.1 Objectives of the Study
1.2 Market Definition
1.2.1 Inclusions and Exclusions
1.3 Market Scope
1.3.1 Market Segmentation
1.3.2 Regions Covered
1.4 Years Considered for the Study
1.5 Currency Considered
1.6 Stakeholders
2 Research Methodology (Page No. - 22)
2.1 Research Data
2.1.1 Secondary Data
2.1.2 Primary Data
2.1.2.1 Breakup of Primary Profiles
2.1.2.2 Key Industry Insights
2.2 Market Breakup and Data Triangulation
2.3 Market Size Estimation
2.4 Market Forecast
2.5 Research Assumptions and Limitations
2.5.1 Assumptions for the Study
3 Executive Summary (Page No. - 30)
4 Premium Insights (Page No. - 33)
4.1 Attractive Opportunities in the Revenue Management Market
4.2 Market By Component, 2019
4.3 Market By Vertical, 2017–2024
4.4 Market By Service, 2019 Vs. 2024
4.5 Market Investment Scenario
5 Market Overview and Industry Trends (Page No. - 36)
5.1 Introduction
5.1.1 Drivers
5.1.1.1 Rising Need for Competitive Pricing Strategies
5.1.1.2 Penetration of Mobile Devices Worldwide and High Growth in Subscriber Base in Various Regions
5.1.1.3 Digital Transformation to Compel Csps for Integrating Revenue Management Throughout Modern Systems
5.1.2 Restraints
5.1.2.1 Conservatism in the Adoption of Revenue Management System
5.1.3 Opportunities
5.1.3.1 Need to Maximize Revenue Streams With Ai and Ml in Existing Rm Systems
5.1.3.2 Complex Regulatory Compliances Boost Adoption of Revenue Management Solutions
5.1.4 Challenges
5.1.4.1 Lack of Skilled Professionals to Operate Revenue Management Systems
5.1.4.2 Legacy Infrastructure for Deployment of Revenue Management Systems
5.2 Regulatory Landscape
5.2.1 Health Insurance Portability and Accountability Act
5.2.2 Health Level Seven
5.2.3 California Consumer Privacy Act
5.2.4 General Data Protection Regulation
5.2.5 Gramm–Leach–Bliley Act
5.2.6 Use Cases
6 Revenue Management Market, By Component (Page No. - 45)
6.1 Introduction
6.1.1 Component: Market Drivers
7 Market By Solution (Page No. - 48)
7.1 Introduction
7.1.1 Solutions: Market Drivers
7.2 Billing and Payment
7.3 Price Management
7.4 Revenue Assurance and Fraud Management
7.5 Channel Management
8 Revenue Management Market, By Service (Page No. - 54)
8.1 Introduction
8.1.1 Services: Market Drivers
8.2 Professional Services
8.2.1 Consulting Services
8.2.2 Integration and Deployment Services
8.2.3 Maintenance and Support Services
8.2.4 Managed Services
9 Revenue Management Market, By Deployment Mode (Page No. - 60)
9.1 Introduction
9.1.1 Deployment Mode: Market Drivers
9.2 Cloud
9.3 On-Premises
10 Revenue Management Market, By Vertical (Page No. - 65)
10.1 Introduction
10.1.1 Vertical: Market Drivers
10.2 Telecommunications
10.3 Hospitality
10.4 Transportation
10.5 Healthcare
10.6 Retail and Ecommerce
10.7 Banking, Financial Services and Insurance
10.8 Utilities
10.9 Others
11 Revenue Management Market, By Region (Page No. - 75)
11.1 Introduction
11.2 North America
11.2.1 North America: Market Drivers
11.2.2 United States
11.2.3 Canada
11.3 Europe
11.3.1 Europe: Revenue Management Market Drivers
11.3.2 United Kingdom
11.3.3 Germany
11.3.4 France
11.3.5 Rest of Europe
11.4 Asia Pacific
11.4.1 Asia Pacific: Revenue Management Market Drivers
11.4.2 China
11.4.3 India
11.4.4 Rest of Asia Pacific
11.5 Middle East and Africa
11.5.1 Middle East and Africa: Market Drivers
11.5.2 Kingdom of Saudi Arabia
11.5.3 United Arab Emirates
11.5.4 Rest of Middle East and Africa
11.6 Latin America
11.6.1 Latin America: Revenue Management Market Drivers
11.6.2 Brazil
11.6.3 Mexico
11.6.4 Rest of Latin America
12 Competitive Landscape (Page No. - 117)
12.1 Overview
12.2 Competitive Scenario
12.2.1 Partnerships
12.2.2 New Product Launches
12.2.3 Acquisitions
13 Company Profiles (Page No. - 121)
(Business Overview, Products Offered, Recent Developments, SWOT Analysis, MnM View)*
13.1 Introduction
13.2 Amdocs
13.3 Netcracker
13.4 CSG Systems International
13.5 Oracle
13.6 Ericsson
13.7 Huawei
13.8 SAP
13.9 Cerillion
13.10 Mahindra Comviva
13.11 Optiva
13.12 Enghouse Networks
13.13 Accelya
13.14 HQ Revenue
13.15 IDeaS
13.16 Zuora
13.17 R1RCM
13.18 Workday
13.19 Fiserv
13.20 Apttus
13.21 Infor
13.22 Right-To-Win
*Details on Business Overview, Products Offered, Recent Developments, SWOT Analysis, MnM View Might Not be Captured in Case of Unlisted Companies.
14 Appendix (Page No. - 153)
14.1 Discussion Guide
14.2 Knowledge Store: Marketsandmarkets’ Subscription Portal
14.3 Available Customizations
14.4 Related Reports
14.5 Author Details
List of Tables (130 Tables)
Table 1 United States Dollar Exchange Rate, 2016–2019
Table 2 Factor Analysis
Table 3 Use Case 1: Nexign
Table 4 Use Case 2: Subex
Table 5 Use Case 3: FTS
Table 6 Use Case 4: Fiserv
Table 7 Use Case 5: WNS
Table 8 Revenue Management Market Size, By Component, 2017–2024 (USD Million)
Table 9 Solutions: Market Size By Region, 2017–2024 (USD Million)
Table 10 Services: Market Size By Region, 2017–2024 (USD Million)
Table 11 Revenue Management Market Size, By Solution, 2017–2024 (USD Million)
Table 12 Billing and Payment Market Size, By Region, 2017–2024 (USD Million)
Table 13 Pprice Management Market Size, By Region, 2017–2024 (USD Million)
Table 14 Revenue Assurance and Fraud Management Market Size, By Region, 2017–2024 (USD Million)
Table 15 Channel Management Market Size, By Region, 2017–2024 (USD Million)
Table 16 Market Size By Service, 2017–2024 (USD Million)
Table 17 Market Size By Professional Service, 2017–2024 (USD Million)
Table 18 Professional Services Market Size, By Region, 2017–2024 (USD Million)
Table 19 Consulting Market Size, By Region, 2017–2024 (USD Million)
Table 20 Integration and Deployment Market Size, By Region, 2017–2024 (USD Million)
Table 21 Maintenance and Support Market Size, By Region, 2017–2024 (USD Million)
Table 22 Managed Services Market Size, By Region, 2017–2024 (USD Million)
Table 23 Revenue Management Market Size, By Deployment Mode, 2017–2024 (USD Million)
Table 24 Deployment Mode: Market Size By Region, 2017–2024 (USD Million)
Table 25 Cloud: Market Size By Region, 2017–2024 (USD Million)
Table 26 On-Premises: Market Size By Region, 2017–2024 (USD Million)
Table 27 Revenue Management Market Size, By Vertical, 2017–2024 (USD Million)
Table 28 Revenue Management Vertical Market Size, By Region, 2017–2024 (USD Million)
Table 29 Telecommunication: Market Size By Region, 2017–2024 (USD Million)
Table 30 Tourism and Hospitality: Market Size By Region, 2017–2024 (USD Million)
Table 31 Transportation: Market Size By Region, 2017–2024 (USD Million)
Table 32 Healthcare: Market Size By Region, 2017–2024 (USD Million)
Table 33 Retail and Ecommerce: Revenue Management Market Size, By Region, 2017–2024 (USD Million)
Table 34 Banking, Financial Services and Insurance: Market Size By Region, 2017–2024 (USD Million)
Table 35 Utilities: Market Size By Region, 2017–2024 (USD Million)
Table 36 Others: Market Size By Region, 2017–2024 (USD Million)
Table 37 Revenue Management Market Size, By Region, 2017–2024 (USD Million)
Table 38 North America: Revenue Management Market Size, By Component, 2017–2024 (USD Million)
Table 39 North America: Market Size By Solution, 2017–2024 (USD Million)
Table 40 North America: Market Size By Service, 2017–2024 (USD Million)
Table 41 North America: Market Size By Professional Service, 2017–2024 (USD Million)
Table 42 North America: Market Size By Deployment Mode, 2017–2024 (USD Million)
Table 43 North America: Market Size By Vertical, 2017–2024 (USD Million)
Table 44 North America: Market Size By Country, 2017–2024 (USD Million)
Table 45 United States: Revenue Management Market Size, By Component, 2017–2024 (USD Million)
Table 46 United States: Market Size By Solution, 2017–2024 (USD Million)
Table 47 United States: Market Size By Service, 2017–2024 (USD Million)
Table 48 United States: Market Size By Professional Service, 2017–2024 (USD Million)
Table 49 United States: Market Size By Deployment Mode, 2017–2024 (USD Million)
Table 50 Canada: Revenue Management Market Size, By Component, 2017–2024 (USD Million)
Table 51 Canada: Market Size By Solution, 2017–2024 (USD Million)
Table 52 Canada: Market Size By Service, 2017–2024 (USD Million)
Table 53 Canada: Market Size By Professional Service, 2017–2024 (USD Million)
Table 54 Canada: Market Size By Deployment Mode, 2017–2024 (USD Million)
Table 55 Europe: Revenue Management Market Size, By Component, 2017–2024 (USD Million)
Table 56 Europe: Market Size By Solution, 2017–2024 (USD Million)
Table 57 Europe: Market Size By Service, 2017–2024 (USD Million)
Table 58 Europe: Market Size By Professional Service, 2017–2024 (USD Million)
Table 59 Europe: Market Size By Deployment Mode, 2017–2024 (USD Million)
Table 60 Europe: Market Size By Vertical, 2017–2024 (USD Million)
Table 61 Europe: Market Size By Country, 2017–2024 (USD Million)
Table 62 United Kingdom: Revenue Management Market Size, By Component, 2017–2024 (USD Million)
Table 63 United Kingdom: Market Size By Solution, 2017–2024 (USD Million)
Table 64 United Kingdom: Market Size By Service, 2017–2024 (USD Million)
Table 65 United Kingdom: Market Size By Professional Service, 2017–2024 (USD Million)
Table 66 United Kingdom: Market Size By Deployment Mode, 2017–2024 (USD Million)
Table 67 Germany: Revenue Management Market Size, By Component, 2017–2024 (USD Million)
Table 68 Germany: Market Size By Solution, 2017–2024 (USD Million)
Table 69 Germany: Market Size By Service, 2017–2024 (USD Million)
Table 70 Germany: Market Size By Professional Service, 2017–2024 (USD Million)
Table 71 Germany: Market Size By Deployment Mode, 2017–2024 (USD Million)
Table 72 France: Revenue Management Market Size, By Component, 2017–2024 (USD Million)
Table 73 France: Market Size By Solution, 2017–2024 (USD Million)
Table 74 France: Market Size By Service, 2017–2024 (USD Million)
Table 75 France: Market Size By Professional Service, 2017–2024 (USD Million)
Table 76 France: Market Size By Deployment Mode, 2017–2024 (USD Million)
Table 77 Asia Pacific: Revenue Management Market Size, By Component, 2017–2024 (USD Million)
Table 78 Asia Pacific: Market Size By Solution, 2017–2024 (USD Million)
Table 79 Asia Pacific: Market Size By Service, 2017–2024 (USD Million)
Table 80 Asia Pacific: Market Size By Professional Service, 2017–2024 (USD Million)
Table 81 Asia Pacific: Market Size By Deployment Mode, 2017–2024 (USD Million)
Table 82 Asia Pacific: Market Size By Vertical, 2017–2024 (USD Million)
Table 83 Asia Pacific: Market Size By Country, 2017–2024 (USD Million)
Table 84 China: Revenue Management Market Size, By Component, 2017–2024 (USD Million)
Table 85 China: Market Size By Solution, 2017–2024 (USD Million)
Table 86 China: Market Size By Service, 2017–2024 (USD Million)
Table 87 China: Market Size By Professional Service, 2017–2024 (USD Million)
Table 88 China: Market Size By Deployment Mode, 2017–2024 (USD Million)
Table 89 India: Revenue Management Market Size, By Component, 2017–2024 (USD Million)
Table 90 India: Market Size By Solution, 2017–2024 (USD Million)
Table 91 India: Market Size By Service, 2017–2024 (USD Million)
Table 92 India: Market Size By Professional Service, 2017–2024 (USD Million)
Table 93 India: Market Size By Deployment Mode, 2017–2024 (USD Million)
Table 94 Middle East and Africa: Revenue Management Market Size, By Component, 2017–2024 (USD Million)
Table 95 Middle East and Africa: Market Size By Solution, 2017–2024 (USD Million)
Table 96 Middle East and Africa: Market Size By Service, 2017–2024 (USD Million)
Table 97 Middle East and Africa: Market Size By Professional Service, 2017–2024 (USD Million)
Table 98 Middle East and Africa: Market Size By Deployment Mode, 2017–2024 (USD Million)
Table 99 Middle East and Africa: Market Size By Vertical, 2017–2024 (USD Million)
Table 100 Middle East and Africa: Market Size By Country, 2017–2024 (USD Million)
Table 101 Kingdom of Saudi Arabia: Revenue Management Market Size, By Component, 2017–2024 (USD Million)
Table 102 Kingdom of Saudi Arabia: Market Size By Solution, 2017–2024 (USD Million)
Table 103 Kingdom of Saudi Arabia: Market Size By Service, 2017–2024 (USD Million)
Table 104 Kingdom of Saudi Arabia: Market Size By Professional Service, 2017–2024 (USD Million)
Table 105 Kingdom of Saudi Arabia: Market Size By Deployment Mode, 2017–2024 (USD Million)
Table 106 United Arab Emirates: Revenue Management Market Size, By Component, 2017–2024 (USD Million)
Table 107 United Arab Emirates: Market Size By Solution, 2017–2024 (USD Million)
Table 108 United Arab Emirates: Market Size By Service, 2017–2024 (USD Million)
Table 109 United Arab Emirates: Market Size By Professional Service, 2017–2024 (USD Million)
Table 110 United Arab Emirates: Market Size By Deployment Mode, 2017–2024 (USD Million)
Table 111 Latin America: Revenue Management Market Size, By Component, 2017–2024 (USD Million)
Table 112 Latin America: Market Size By Solution, 2017–2024 (USD Million)
Table 113 Latin America: Market Size By Service, 2017–2024 (USD Million)
Table 114 Latin America: Market Size By Professional Service, 2017–2024 (USD Million)
Table 115 Latin America: Market Size By Deployment Mode, 2017–2024 (USD Million)
Table 116 Latin America: Market Size By Vertical, 2017–2024 (USD Million)
Table 117 Latin America: Market Size By Country, 2017–2024 (USD Million)
Table 118 Brazil: Revenue Management Market Size, By Component, 2017–2024 (USD Million)
Table 119 Brazil: Market Size By Solution, 2017–2024 (USD Million)
Table 120 Brazil: Market Size By Service, 2017–2024 (USD Million)
Table 121 Brazil: Market Size By Professional Service, 2017–2024 (USD Million)
Table 122 Brazil: Market Size By Deployment Mode, 2017–2024 (USD Million)
Table 123 Mexico: Revenue Management Market Size, By Component, 2017–2024 (USD Million)
Table 124 Mexico: Market Size By Solution, 2017–2024 (USD Million)
Table 125 Mexico: Market Size By Service, 2017–2024 (USD Million)
Table 126 Mexico: Market Size By Professional Service, 2017–2024 (USD Million)
Table 127 Mexico: Market Size By Deployment Mode, 2017–2024 (USD Million)
Table 128 Partnerships, 2019
Table 129 New Product/Service Launches and Product Enhancements, 2019
Table 130 Acquisitions, 2019
List of Figures (40 Figures)
Figure 1 Revenue Management Market: Research Design
Figure 2 Data Triangulation
Figure 3 Market Size Estimation Methodology: Approach 1 (Supply Side): Revenue of Software and Services of the Revenue Management Market
Figure 4 Market Size Estimation Methodology: Approach 1 Bottom-Up (Supply Side): Collective Revenue of All Software and Services of the Market
Figure 5 Market Size Estimation Methodology: Approach 2 Top-Down (Demand Side): Share of Revenue Management
Figure 6 Market to Witness Steady Growth During the Forecast Period
Figure 7 Revenue Management Market: Regional Market Scenario
Figure 8 Need for Competitive Pricing Strategy to Boost Growth of Market
Figure 9 Solutions Segment to Hold a Higher Market Share in the Market in 2019
Figure 10 Telecom Vertical to Lead the Revenue Management Market During the Forecast Period
Figure 11 Professional Services Segment to Lead the Market During the Forecast Period
Figure 12 Asia Pacific to Emerge as the Best Market for Investment Over the Next 5 Years
Figure 13 Revenue Management Market: Drivers, Restraints, Opportunities, and Challenges
Figure 14 Mobile Subscriber Penetration
Figure 15 Smartphone Adoption
Figure 16 Services Segment to Grow at a Higher CAGR During the Forecast Period
Figure 17 Channel Management Segment to Grow at the Highest CAGR During the Forecast Period
Figure 18 Managed Services Segment to Grow at a Higher CAGR During the Forecast Period
Figure 19 Cloud Deployment Mode to Grow at a Higher CAGR During the Forecast Period
Figure 20 Telecom Segment is Expected to Dominate the Market During the Forecast Period
Figure 21 Asia Pacific to Exhibit the Highest CAGR During the Forecast Period
Figure 22 North America: Market Snapshot
Figure 23 Asia Pacific: Market Snapshot
Figure 24 Key Developments in the Revenue Management Market (2018–2019)
Figure 25 Market Evaluation Framework, 2018–2019
Figure 26 Amdocs: Company Snapshot
Figure 27 Amdocs: SWOT Analysis
Figure 28 NEC: Company Snapshot
Figure 29 Netcracker: SWOT Analysis
Figure 30 CSG Systems International: Company Snapshot
Figure 31 CSG Systems International: SWOT Analysis
Figure 32 Oracle: Company Snapshot
Figure 33 Oracle: SWOT Analysis
Figure 34 Ericsson: Company Snapshot
Figure 35 Ericsson: SWOT Analysis
Figure 36 Huawei: Company Snapshot
Figure 37 SAP: Company Snapshot
Figure 38 Cerillion: Company Snapshot
Figure 39 Mahindra Comviva: Company Snapshot
Figure 40 Optiva: Company Snapshot
The study involved four major activities in estimating the current market size for the revenue management market. An exhaustive secondary research was done to collect information on the market. The next step was to validate these findings, assumptions, and sizing with industry experts across the value chain using primary research. Both top-down and bottom-up approaches were employed to estimate the total market size. After that, the market breakup and data triangulation procedures were used to estimate the market size of the segments and subsegments of the revenue management market.
Secondary Research
In the secondary research process, various secondary sources, such as D&B Hoovers, Bloomberg BusinessWeek, and Dun & Bradstreet, were referred to identify and collect information for this study. These secondary sources included annual reports, press releases, and investor presentations of companies; whitepapers, certified publications, and articles by recognized authors; gold standard and silver standard websites; regulatory bodies; trade directories; and databases.
Primary Research
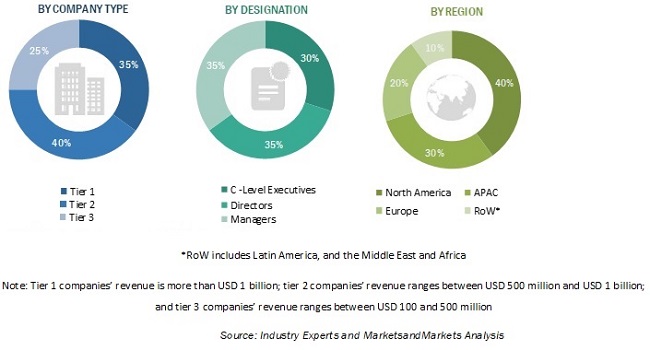
The revenue management market comprises several stakeholders, such as revenue management vendors, revenue management service providers, venture capitalists, government organizations, regulatory authorities, policymakers, and financial organizations, consulting firms, research organizations, academic institutions, resellers and distributors, and training providers. The demand side of the revenue management market consists of all the firms operating in several industry verticals. The supply side includes revenue management providers, offering revenue management services. Various primary sources from both the supply and demand sides of the market were interviewed to obtain qualitative and quantitative information. Given below is the breakup of the primary respondents:
Market Size Estimation
The top-down and bottom-up approaches were used to estimate and validate the size of the global revenue management market and various other dependent submarkets in the overall market. An exhaustive list of all the vendors who offer solutions and services in the market was prepared while using the top-down approach. The market share for all the vendors in the market was estimated through annual reports, press releases, funding, investor presentations, paid databases, and primary interviews. Each vendor was evaluated based on its components (solutions and services). The aggregate of all companies’ revenues was extrapolated to reach the overall market size.
Furthermore, each subsegment was studied and analyzed for its global market size and regional penetration. The markets were triangulated through both primary and secondary research. The primary procedure included extensive interviews for key insights from the industry leaders, such as Chief Executive Officers (CEOs), Vice Presidents (VPs), directors, and managers.
Data Triangulation
After arriving at the overall market size using the market size estimation processes as explained above, the market was split into several segments and subsegments. The data triangulation and market breakup procedures were employed, wherever applicable, to complete the overall market engineering process and arrive at the exact statistics of each market segment and subsegment. The data was triangulated by studying various factors and trends from both the demand and supply sides.
Report Objectives
- To determine and forecast the global revenue management market based on components (solutions [billing and payment, price management, revenue assurance and fraud management, and channel management] and services [professional and managed]), deployment modes, verticals, and regions during the forecast period, and analyze various macro and microeconomic factors affecting the market growth
- To forecast the size of the market segments with respect to five main regions: North America, Europe, Asia Pacific (APAC), Latin America, and the Middle East and Africa (MEA)
- To provide detailed information about the major factors (drivers, opportunities, restrain, and challenges) influencing the growth of the market
- To analyze each submarket with respect to individual growth trends, prospects, and contributions to the total market
- To analyze opportunities in the market for stakeholders by identifying the high-growth segments of the revenue management market
- To profile the key market players, such as top vendors and startups; provide a comparative analysis based on their business overviews, regional presence, product offerings, business strategies, and key financials; and illustrate the market’s competitive landscape
- To track and analyze competitive developments, such as mergers and acquisitions, new product launches, product enhancements, partnerships, agreements, and collaborations in the market.
Available Customizations
Along with the market data, MarketsandMarkets offers customizations as per the company’s specific needs. The following customization options are available for the report:
Company Information
- Detailed analysis and profiling of additional market players (Up to 5)


Growth opportunities and latent adjacency in Revenue Management Market