Mid-Revenue Cycle Management/Clinical Documentation Improvement Market by Product & Service (Clinical Documentation, Clinical Coding (NLP, Structure Input), Charge Capture, CDI, DRG, Pre-Bill Review), End User, and Region - Global Forecast to 2023


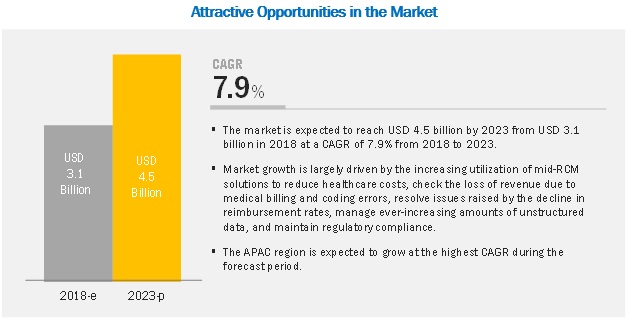
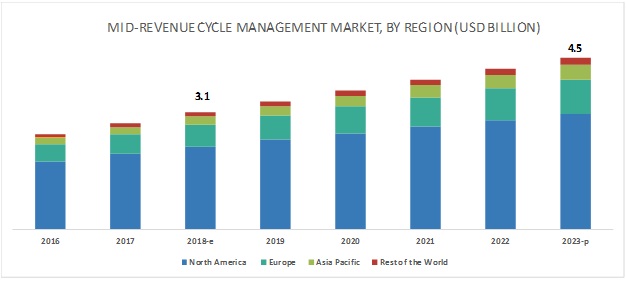
The clinical documentation improvement market is projected to reach USD 4.5 billion by 2023, at a CAGR of 7.9%. Market growth is largely driven by the increasing utilization of mid-RCM solutions to reduce healthcare costs, check the loss of revenue due to medical billing and coding errors, resolve issues raised by the decline in reimbursement rates, manage ever-increasing amounts of unstructured data, and maintain regulatory compliance.
On the other hand, IT infrastructural constraints in developing countries, a scarcity of skilled IT professionals, and the risks associated with HCIT solutions in terms of data security & privacy may restrain the growth of this market to a certain extent.

The solutions segment to hold the largest share of the market in 2018.
On the basis of products & service, the global mid-revenue cycle management/clinical documentation improvement industry is segmented into solutions and consulting service. The large share of the solutions segment can be attributed to the benefits offered by mid-revenue cycle solutions when they are integrated with EHRs/EMRs, encoder systems, voice/text/speech recognition software, CDI, transcription systems, and other hospital information management systems. Moreover, these solutions also eliminate the duplication of administrative work of entering selected codes into each record. They also decrease the potential for data documentation, charge capture, and coding errors, and improve the overall mid-revenue cycle process.
The healthcare providers segment to account for the largest share in 2018.
In 2017, the healthcare providers segment accounted for the largest share of the market. Growth in the mid-revenue cycle management solutions market for healthcare providers can be attributed to the significant demand for these solutions from healthcare providers for improving data accuracy in clinical documentation, maximizing hospital revenues by minimizing coding errors, and shortening the claims reimbursement cycle. Revenue losses due to medical billing and coding errors, declining reimbursement rates, and the need to reduce the rising healthcare cost are other key factors supporting the growth in the demand for these solutions.
North America to dominate the market in 2018.
In 2017, North America accounted for a major share of the market. The market is well-established in North America, with the US dominating the market in this region. The healthcare insurance industry in the US, with programs such as Medicare and Medicaid, plays a primary role in the country�s healthcare delivery system. More recently, the demand for advanced computer-assisted coding systems in the country has increased due to the implementation of ICD-10 coding standards. The enhanced data provided by ICD-10 leads to better insights about health conditions and care management, better predictive analytics, and, ultimately, improved health outcomes. Growth in this market is also supported by the trend of decreasing reimbursement rates in the US.

Key Market Players
Prominent players in this market are 3M Company (US), Optum (US), Nuance (US), M*Modal (US), nThrive (US), Dolbey Systems (US), Streamline Health (US), Vitalware (US), Chartwise (US), Craneware (US), Epic Systems (US), Cerner (US), eZDI Inc. (US),Iodine Software (US), Flash Code (US), and TruCode (US).
Optum was the largest player in the mid-revenue cycle management/clinical documentation improvement market in 2017. The company has maintained its leadership position in the market through its strong distribution networks across North America, Europe, Asia Pacific, and the Rest of the World. The company operates through three major segments�OptumHealth, OptumInsight, and OptumRx. OptumHealth provides health information & services and integrated care delivery products. OptumInsight is a health information, technology, services, and consulting company. The company provides software and information products, advisory consulting services, and business process outsourcing to hospitals, physicians, commercial health plans, government agencies, life science companies, and other organizations in the healthcare industry. The company�s leadership position is attributed to its focus on partnerships, collaborations, and acquisitions.
Scope of the Report
|
Report Metric |
Details |
|
Market size available for years |
2016�2023 |
|
Base year considered |
2017 |
|
Forecast period |
2018�2023 |
|
Forecast units |
Value (USD) |
|
Segments covered |
Product & Service, End User, and Region |
|
Geographies covered |
North America, Europe, Asia Pacific, and the Rest of the World. |
|
Companies covered |
3M (US), Optum (US), Nuance (US), M*Modal (US), Dolbey Systems (US), nThrive (US), Streamline Health (US), Vitalware (US), Chartwise (US), Craneware (US), Epic Systems (US), Cerner (US), eZDI Inc. (US), and Iodine Software (US) |
The research report categorizes the market into the following segments and subsegments:
Mid-Revenue Cycle Management/Clinical Documentation Improvement Market, by Product & Service
- Solutions
- Clinical Documentation
- Clinical Coding
- NLP Solutions
- Structural Input Solutions
- Charge Capture
- CDI
- DRG
- Pre-bill Review
- Consulting Service
Mid-Revenue Cycle Management /Clinical Documentation Improvement Market, by End User
- Healthcare Providers
- Inpatient Settings
- Outpatient Settings
- Healthcare Payers
Mid-Revenue Cycle Management /Clinical Documentation Improvement Market, by Region
- North America
- US
- Canada
- Europe
- Asia Pacific
- Rest of the World
Recent Developments
- In 2018, Nuance (US) formed a partnership with Epic Systems (US). Under the terms of this agreement, Epic incorporated Nuance�s Artificial Intelligence (AI)-powered virtual assistant platform (New Dragon Medical capabilities) into Epic EHRs.
- In 2018, M*Modal (US) formed a partnership with Enjoin (US). Through this partnership, M*Modal would explore Enjoin�s risk-adjustment services to advance outpatient CDI programs.
- In 2018, Vitalware (US) formed a partnership with BurstIQ (US). Through this partnership, VitalWare implemented BurstIQ�s blockchain-based advanced analytics and machine learning into its solutions and services.
Key Questions Addressed in the Report
- Who are the top 10 players operating in the mid-revenue cycle management/clinical documentation improvement market?
- What are the driving factors, restraints, opportunities, and challenges in the mid-revenue cycle management/clinical documentation improvement market?
- What are the industry trends and current scenario of the mid-revenue cycle management/clinical documentation improvement market?
- What are the growth trends in the mid-revenue cycle management/clinical documentation improvement market at segmental and overall market levels?
To speak to our analyst for a discussion on the above findings, click Speak to Analyst
 Exclusive indicates content/data unique to MarketsandMarkets and not available with any competitors.
Table of Contents
1 Introduction (Page No. - 14)
1.1 Objectives of the Study
1.2 Market Definition
1.3 Market Scope
1.3.1 Markets Covered
1.3.2 Years Considered for the Study
1.4 Limitations
1.5 Currency
1.6 Stakeholders
2 Research Methodology (Page No. - 17)
2.1 Research Approach
2.1.1 Secondary Data
2.1.1.1 Key Data From Secondary Sources
2.1.2 Primary Data
2.1.2.1 Breakdown of Primaries
2.1.2.2 Key Data From Primary Sources
2.1.2.3 Key Industry Insights
2.2 Market Size Estimation
2.3 Market Breakdown and Data Triangulation
2.4 Assumptions for the Study
3 Executive Summary (Page No. - 25)
4 Premium Insights (Page No. - 32)
4.1 Mid-Revenue Cycle Management Solutions Market Overview
4.2 North American Mid-Revenue Cycle Management Solutions Market
4.3 Mid-Revenue Cycle Management Solutions Market: Major Geographic Regions
4.4 Geographic Mix: Mid-Revenue Cycle Management Solutions Market
5 Market Overview (Page No. - 36)
5.1 Introduction
5.2 Market Dynamics
5.2.1 Key Market Drivers
5.2.1.1 Increasing Healthcare Expenditure
5.2.1.2 Loss of Revenue Due to Medical Billing and Coding Errors
5.2.1.3 Declining Reimbursements
5.2.1.4 Growing Need to Manage Increasing Unstructured Healthcare Data
5.2.2 Key Market Restraints
5.2.2.1 It Infrastructural Constraints in Developing Countries
5.2.3 Key Market Opportunities
5.2.3.1 Rising Use of NLP in Documentation
5.2.4 Key Market Challenges
5.2.4.1 Data Security Concerns
5.2.4.2 Reluctance to Switch From Conventional Methods
5.2.4.3 Scarcity of Skilled It Professionals
6 Industry Insights (Page No. - 41)
6.1 Introduction
6.2 Coding Guidelines
6.2.1 US
6.2.2 Europe
6.2.3 Japan
6.2.4 Australia
6.3 Trends in NLP-Enabled Documentation & Coding
7 Mid-Revenue Cycle Management/Clinical Documentation Improvement Market, By Product & Service (Page No. - 44)
7.1 Introduction
7.2 Solutions
7.2.1 Clinical Documentation
7.2.1.1 Advantages of NLP-Enabled Documentation Over Manual Processes is Driving the Adoption of Clinical Documentation Solutions
7.2.2 Clinical Coding
7.2.2.1 NLP Solutions
7.2.2.1.1 NLP Coding Solutions to Dominate the Mid-Revenue Cycle Management Clinical Coding Solutions Market During the Forecast Period
7.2.2.2 Structural Input Solutions
7.2.2.2.1 Structured Input Solutions Help to Improve the Coding Process and Reduce the Coding Procedure Cost
7.2.3 Charge Capture
7.2.3.1 Rising Adoption of Smartphones Among Healthcare Professionals to Drive the Adoption of Charge Capture Solutions
7.2.4 Clinical Documentation Improvement
7.2.4.1 CDI Solutions to Witness the Highest Growth During the Forecast Period Primarily Due to A Decrease in DNFB and Increase in Coding Accuracy
7.2.5 Diagnosis-Related Grouping
7.2.5.1 DRG Solutions Improve Pricing and Reimbursement Accuracy
7.2.6 Pre-Bill Review
7.2.6.1 Declining Reimbursement Rates Have Triggered Awareness of the Pre-Bill Review Process
7.3 Consulting Services
7.3.1 Consulting Services to Witness the Highest Growth Rate in the Mid-Revenue Cycle Management Solutions Market From 2018 to 2023
8 Mid-Revenue Cycle Management/Clinical Documentation Improvement Market, By End User (Page No. - 61)
8.1 Introduction
8.2 Healthcare Providers
8.2.1 Inpatient Settings
8.2.1.1 Mid-Rcm Solutions Play an Integral Role in Inpatient Settings, Improving Quality and Growing Revenues�A Key Growth Driver
8.2.2 Outpatient Settings
8.2.2.1 Growing Preference for Outpatient Facilities to Reduce the Cost of Care to Drive Market Growth
8.3 Healthcare Payers
8.3.1.1 Advantages Such as the Increased Productivity and Profitability of Coding Operations are Driving the Adoption of Mid-Rcm Solutions By Healthcare Payers
9 Mid-Revenue Cycle Management/Clinical Documentation Improvement Market, By Region (Page No. - 68)
9.1 Introduction
9.2 North America
9.2.1 US
9.2.2 Canada
9.3 Europe
9.4 Asia Pacific
9.5 Rest of the World
10 Competitive Landscape (Page No. - 94)
10.1 Overview
10.2 Market Leadership Analysis
10.3 Competitive Scenario
10.3.1 Agreements, Collaborations, & Partnerships
10.3.2 Product Launches and Enhancements
10.3.3 Acquisitions
10.3.4 Expansions
11 Company Profiles (Page No. - 100)
(Business Overview, Products and Services Offered, Recent Developments, SWOT Analysis, MnM View)*
11.1 3M Company
11.2 Optum, Inc. (A Subsidiary of Unitedhealth Group, Inc.)
11.3 Nuance Communications, Inc.
11.4 M*Modal
11.5 Dolbey Systems
11.6 Nthrive, Inc.
11.7 Streamline Health Solutions, LLC
11.8 Vitalware, LLC.
11.9 Chartwise Medical Systems, Inc.
11.10 Iodine Software
*Details on Business Overview, Products and Services Offered, Recent Developments, SWOT Analysis, MnM View Might Not Be Captured in Case of Unlisted Companies.
11.11 Other Leading Players
11.11.1 Craneware
11.11.2 EPIC Systems Corporation
11.11.3 Cerner Corporation
11.11.4 EZDI, Inc.
12 Appendix (Page No. - 127)
12.1 Insights of Industry Experts
12.2 Discussion Guide
12.3 Knowledge Store: Marketsandmarkets� Subscription Portal
12.4 Available Customizations
12.5 Related Reports
12.6 Author Details
List of Tables (69 Tables)
Table 1 Mid-Revenue Cycle Management Solutions Market Snapshot
Table 2 Mid-Revenue Cycle Management Market: Drivers, Restraints, Opportunities, and Challenges
Table 3 Mid-Revenue Cycle Management Solutions Market, By Product & Service, 2016�2023 (USD Million)
Table 4 Mid-Revenue Cycle Management Solutions Market, By Type, 2016�2023 (USD Million)
Table 5 Mid-Revenue Cycle Management Solutions Market, By Country/Region, 2016�2023 (USD Million)
Table 6 Clinical Documentation Solutions Offered By Key Market Players
Table 7 Mid-Revenue Cycle Management Market for Clinical Documentation Solutions, By Country/Region, 2016�2023 (USD Million)
Table 8 Mid-Revenue Cycle Management Market for Clinical Coding Solutions, By Type, 2016�2023 (USD Million)
Table 9 Mid-Revenue Cycle Management Market for Clinical Coding Solutions, By Country/Region, 2016�2023 (USD Million)
Table 10 NLP Clinical Coding Solutions Offered By Key Market Players
Table 11 Mid-Revenue Cycle Management Market for NLP Solutions, By Country/Region, 2016�2023 (USD Million)
Table 12 Structured Input Clinical Coding Solutions Offered By Key Market Players
Table 13 Mid-Revenue Cycle Management Market for Structural Input Solutions, By Country/Region, 2016�2023 (USD Million)
Table 14 Charge Capture Solutions Offered By Key Market Players
Table 15 Mid-Revenue Cycle Management Market for Charge Capture Solutions, By Country/Region, 2016�2023 (USD Million)
Table 16 CDI Solutions Offered By Key Market Players
Table 17 Mid-Revenue Cycle Management Market for Clinical Documentation Improvement Solutions, By Country/Region, 2016�2023 (USD Million)
Table 18 DRG Solutions Offered By Key Market Players
Table 19 Mid-Revenue Cycle Management Market for Diagnosis-Related Grouping Solutions, By Country/Region, 2016�2023 (USD Million)
Table 20 Pre-Bill Review Solutions Offered By Key Market Players
Table 21 Mid-Revenue Cycle Management Market for Pre-Bill Review Solutions, By Country/Region, 2016�2023 (USD Million)
Table 22 Mid-Revenue Cycle Management Solutions Market for Consulting Services, By Country/Region, 2016�2023 (USD Million)
Table 23 Mid-Revenue Cycle Management Solutions Market, By End User, 2016�2023 (USD Million)
Table 24 Mid-Revenue Cycle Management Solutions Market for Healthcare Providers, By Type, 2016�2023 (USD Million)
Table 25 Mid-Revenue Cycle Management Solutions Market for Healthcare Providers, By Region, 2016�2023 (USD Million)
Table 26 Mid-Revenue Cycle Management Solutions Market for Inpatient Settings, By Region, 2016�2023 (USD Million)
Table 27 Mid-Revenue Cycle Management Solutions Market for Outpatient Settings, By Region, 2016�2023 (USD Million)
Table 28 Mid-Revenue Cycle Management Solutions Market for Healthcare Payers, By Region, 2016�2023 (USD Million)
Table 29 Mid-Revenue Cycle Management Solutions Market, By Region, 2016�2023 (USD Million)
Table 30 North America: Mid-Revenue Cycle Management Solutions Market, By Country, 2016�2023 (USD Million)
Table 31 North America: Mid-Revenue Cycle Management Solutions Market, By Product & Service, 2016�2023 (USD Million)
Table 32 North America: Mid-Revenue Cycle Management Solutions Market, By Type, 2016�2023 (USD Million)
Table 33 North America: Mid-Revenue Cycle Management Market for Clinical Coding Solutions, By Type, 2016�2023 (USD Million)
Table 34 North America: Mid-Revenue Cycle Management Solutions Market, By End User, 2016�2023 (USD Million)
Table 35 North America: Mid-Revenue Cycle Management Solutions Market for Healthcare Providers, By Type, 2016�2023 (USD Million)
Table 36 US: Key Macroindicators
Table 37 US: Mid-Revenue Cycle Management Solutions Market, By Product & Service, 2016�2023 (USD Million)
Table 38 US: Mid-Revenue Cycle Management Solutions Market, By Type, 2016�2023 (USD Million)
Table 39 US: Mid-Revenue Cycle Management Market for Clinical Coding Solutions, By Type, 2016�2023 (USD Million)
Table 40 US: Mid-Revenue Cycle Management Solutions Market, By End User, 2016�2023 (USD Million)
Table 41 US: Mid-Revenue Cycle Management Solutions Market for Healthcare Providers, By Type, 2016�2023 (USD Million)
Table 42 Canada: Key Macroindicators
Table 43 Canada: Mid-Revenue Cycle Management Solutions Market, By Product & Service, 2016�2023 (USD Million)
Table 44 Canada: Mid-Revenue Cycle Management Solutions Market, By Type, 2016�2023 (USD Million)
Table 45 Canada: Mid-Revenue Cycle Management Market for Clinical Coding Solutions, By Type, 2016�2023 (USD Million)
Table 46 Canada: Mid-Revenue Cycle Management Solutions Market, By End User, 2016�2023 (USD Million)
Table 47 Canada: Mid-Revenue Cycle Management Solutions Market for Healthcare Providers, By Type, 2016�2023 (USD Million)
Table 48 Europe: Mid-Revenue Cycle Management Solutions Market, By Product & Service, 2016�2023 (USD Million)
Table 49 Europe: Mid-Revenue Cycle Management Solutions Market, By Type, 2016�2023 (USD Million)
Table 50 Europe: Mid-Revenue Cycle Management Market for Clinical Coding Solutions, By Type, 2016�2023 (USD Million)
Table 51 Europe: Mid-Revenue Cycle Management Solutions Market, By End User, 2016�2023 (USD Million)
Table 52 Europe: Mid-Revenue Cycle Management Solutions Market for Healthcare Providers, By Type, 2016�2023 (USD Million)
Table 53 APAC: Mid-Revenue Cycle Management Solutions Market, By Product & Service, 2016�2023 (USD Million)
Table 54 APAC: Mid-Revenue Cycle Management Solutions Market, By Type, 2016�2023 (USD Million)
Table 55 APAC: Mid-Revenue Cycle Management Market for Clinical Coding Solutions, By Type, 2016�2023 (USD Million)
Table 56 APAC: Mid-Revenue Cycle Management Solutions Market, By End User, 2016�2023 (USD Million)
Table 57 APAC: Mid-Revenue Cycle Management Solutions Market for Healthcare Providers, By Type, 2016�2023 (USD Million)
Table 58 RoW: Mid-Revenue Cycle Management Solutions Market, By Product & Service, 2016�2023 (USD Million)
Table 59 RoW: Mid-Revenue Cycle Management Solutions Market, By Type, 2016�2023 (USD Million)
Table 60 RoW: Mid-Revenue Cycle Management Market for Clinical Coding Solutions, By Type, 2016�2023 (USD Million)
Table 61 RoW: Mid-Revenue Cycle Management Solutions Market, By End User, 2016�2023 (USD Million)
Table 62 RoW: Mid-Revenue Cycle Management Solutions Market for Healthcare Providers, By Type, 2016�2023 (USD Million)
Table 63 Key Developments in the Mid-Revenue Cycle Management Solutions Market Between January 2014 and November 2018
Table 64 Growth Strategy Matrix (2014�2018)
Table 65 Market Position of Leading Players in Mid-Revenue Cycle Management Solutions Market
Table 66 Agreements, Collaborations, & Partnerships, 2014�2018
Table 67 Product Launches and Enhancements, 2014�2018
Table 68 Acquisitions, 2014�2018
Table 69 Expansions, 2014�2018
List of Figures (26 Figures)
Figure 1 Research Design
Figure 2 Breakdown of Primary Interviews: By Company Type, Designation, and Region
Figure 3 Bottom-Up Approach
Figure 4 Top-Down Approach
Figure 5 Data Triangulation Methodology
Figure 6 Mid-Revenue Cycle Management Solutions Market, By Product & Service, 2018 vs 2023 (USD Million)
Figure 7 Mid-Revenue Cycle Management Solutions Market, By Type, 2018 vs 2023 (USD Million)
Figure 8 Mid-Revenue Cycle Management Solutions Market for Clinical Coding, By Type, 2018 vs 2023 (USD Million)
Figure 9 Mid-Revenue Cycle Management Solutions Market, By End User, 2018 vs 2023 (USD Million)
Figure 10 Mid-Revenue Cycle Management Solutions Market for Healthcare Providers, By Type, 2018 vs 2023 (USD Million)
Figure 11 North America Dominated the Mid-Revenue Cycle Management Solutions Market in 2017
Figure 12 Increasing Utilization of Mid-RCM Solutions to Reduce Healthcare Costs�A Key Factor Driving Market Growth
Figure 13 The US Will Continue to Dominate the Market Through 2023
Figure 14 APAC to Grow at the Highest CAGR During the Forecast Period
Figure 15 North America Will Continue to Dominate the Market Through 2023
Figure 16 Consulting Services Segment to Witness the Highest Growth During the Forecast Period
Figure 17 Healthcare Providers to Register the Highest Growth Rate of the Mid-Revenue Cycle Management Solutions Market During the Forecast Period
Figure 18 Mid-Revenue Cycle Management Solutions Market: Geographic Growth Opportunities
Figure 19 North America: Mid-Revenue Cycle Management Solutions Market Snapshot
Figure 20 Europe: Mid-Revenue Cycle Management Solutions Market Snapshot
Figure 21 APAC: Mid-Revenue Cycle Management Solutions Market Snapshot
Figure 22 RoW: Mid-Revenue Cycle Management Solutions Market Snapshot
Figure 23 3M: Company Snapshot (2017)
Figure 24 Optum: Company Snapshot (2017)
Figure 25 Nuance: Company Snapshot (2017)
Figure 26 Streamline Health: Company Snapshot (2017)
The study involved four major activities to estimate the current market size for the mid-revenue cycle management/clinical documentation improvement market. Exhaustive secondary research was done to collect information on the market, peer market, and parent market. The next step was to validate these findings, assumptions, and sizing with industry experts across the value chain through primary research. Both top-down and bottom-up approaches were employed to estimate the complete market size. Thereafter, market breakdown and data triangulation procedures were used to estimate the market size of segments and subsegments.
Secondary Research
In the secondary research process, various secondary sources such as annual reports, press releases & investor presentations of companies, white papers, certified publications, articles by recognized authors, trade directories, and databases such as D&B, Hoovers, and Bloomberg Businessweek were referred to identify and collect information for this study.
Primary Research
The mid-revenue cycle management market/clinical documentation improvement market comprises several stakeholders such as mid-revenue cycle management solution developers and distributors. Primary sources from the supply side include CEOs, vice presidents, marketing and sales directors, business development managers, and innovation directors of companies developing mid-revenue cycle management solutions. Demand-side primary sources include industry experts such as directors of healthcare providers such as hospitals, clinics, ambulatory surgery centers, payers, professors, research scientists, and related key opinion leaders.
To know about the assumptions considered for the study, download the pdf brochure
Market Size Estimation
Both top-down and bottom-up approaches were used to estimate and validate the total size of the mid-revenue cycle management/clinical documentation improvement market. These methods were also used extensively to estimate the size of various subsegments in the market. The research methodology used to estimate the market size includes the following:
- The key players in the industry and markets have been identified through extensive secondary research.
- The industry�s supply chain and market size, in terms of value, have been determined through primary and secondary research processes.
- All percentage shares, splits, and breakdowns have been determined using secondary sources and verified through primary sources.
Data Triangulation
After arriving at the overall market size using the market size estimation processes as explained above�the market was split into several segments and subsegments. In order to complete the overall market engineering process and arrive at the exact statistics of each market segment and subsegment, the data triangulation and market breakdown procedures were employed, wherever applicable. The data was triangulated by studying various factors and trends from both, the demand and supply sides.
Objectives of the Study
- To define, describe, segment, and forecast the global mid-revenue cycle management/clinical documentation improvement market by product & service, end user, and region.
- To forecast the size of the mid-revenue cycle management/clinical documentation improvement market in North America, Europe, Asia Pacific (APAC), and the Rest of the World (RoW).
- To provide detailed information about factors influencing market growth (drivers, restraints, opportunities, and industry-specific challenges).
- To analyze micromarkets with respect to individual growth trends, prospects, and contributions to the overall market.
- To analyze market opportunities for stakeholders and provide details of the competitive landscape for key players.
- To profile key players in the mid-revenue cycle management/clinical documentation improvement market and comprehensively analyze their core competencies and market rankings.
- To track and analyze competitive developments such as acquisitions, product launches, collaborations, partnerships, and agreements in the market.
Research Methodology
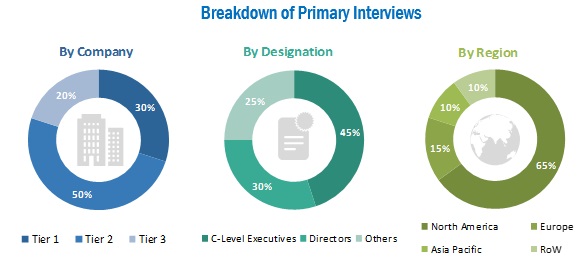
Top-down and bottom-up approaches were used to validate the size of the mid-revenue cycle management/clinical documentation improvement market and estimate the size of other dependent submarkets. Various secondary sources such as directories, industry journals, databases such as Bloomberg Business, Factiva, and Dun & Bradstreet; white papers; annual reports; company house documents; and SEC filings of the companies have been used to identify and collect information useful for the study of this market. Primary sources such as experts from both supply and demand sides have been interviewed to obtain and validate information as well as to assess the dynamics of this market. The breakdown of profiles of primaries is shown in the figure below:
Available Customization
With the given market data, MarketsandMarkets offers customizations as per the company�s specific needs. The following customization options are available for the report:
Product Analysis
Product matrix which gives a detailed comparison of the product portfolios of the top companies
Geographic Analysis
Further breakdown of the European mid-revenue cycle management/clinical documentation improvement market into the UK, France, the Rest of Europe
Company Information
Detailed analysis and profiling of additional market players (Up to 5)

 Generating Response ...


Growth opportunities and latent adjacency in Mid-Revenue Cycle Management/Clinical Documentation Improvement Market